


Quick summary
HYPE is Hyperliquid’s staking and revenue token, with 99% of fees buying and burning
Token has outperformed BTC and major alts, driven by strong perpetuals revenue in 2026
Hyperliquid captures nearly 80 percent of perpetual DEX revenue, with $932M buybacks yearly
Key risks are reliance on perpetuals volume and unclear release schedule for 60 percent supply
HYPE is breaking to all-time highs. For anyone watching from the outside, the question is simple: what is actually driving this?
The token belongs to Hyperliquid, a proof-of-stake Layer 1 blockchain built for on-chain trading. HYPE serves two functions: it secures the network through staking, and it captures protocol revenue through an automated buyback and burn mechanism. Unlike most protocols that collect fees and route them to founders or treasuries, Hyperliquid sends 99% of everything it earns directly back to HYPE holders. Over the last 12 months, $932 million was channelled to HYPE buybacks out of $1.04 billion in total fees collected. That revenue is real, it is measurable, and it is the reason serious money is paying attention.
How HYPE Has Performed Against Bitcoin and the Broader Crypto Market
HYPE launched on November 29, 2024 at $3.90. As of June 1, 2026 it trades at $71.71 — a 1,737% return from launch day. All data in this article is as of June 1, 2026. Source: DefiLlama.
The cleanest way to evaluate that performance is not against USD. It is against BTC, the benchmark every serious crypto investor uses to measure whether an asset earned its allocation.
Since launch, one HYPE now buys 24 times more Bitcoin than it did on day one. BTC only declined 23.8% over this period, appreciating versus BTC by 24 times is the clearest available proof of genuine outperformance, not a chart inflated by a weak comparison.
The ratio table below shows the same picture across the broader market:
Pair | Ratio Change Since Launch |
HYPE/BNB | +1,555% |
HYPE/BTC | +2,311% |
HYPE/XRP | +2,067% |
HYPE/ETH | +3,210% |
HYPE/SOL | +5,282% |
HYPE/DOGE | +7,284% |
HYPE/ADA | +8,087% |
HYPE/AVAX | +8,783% |
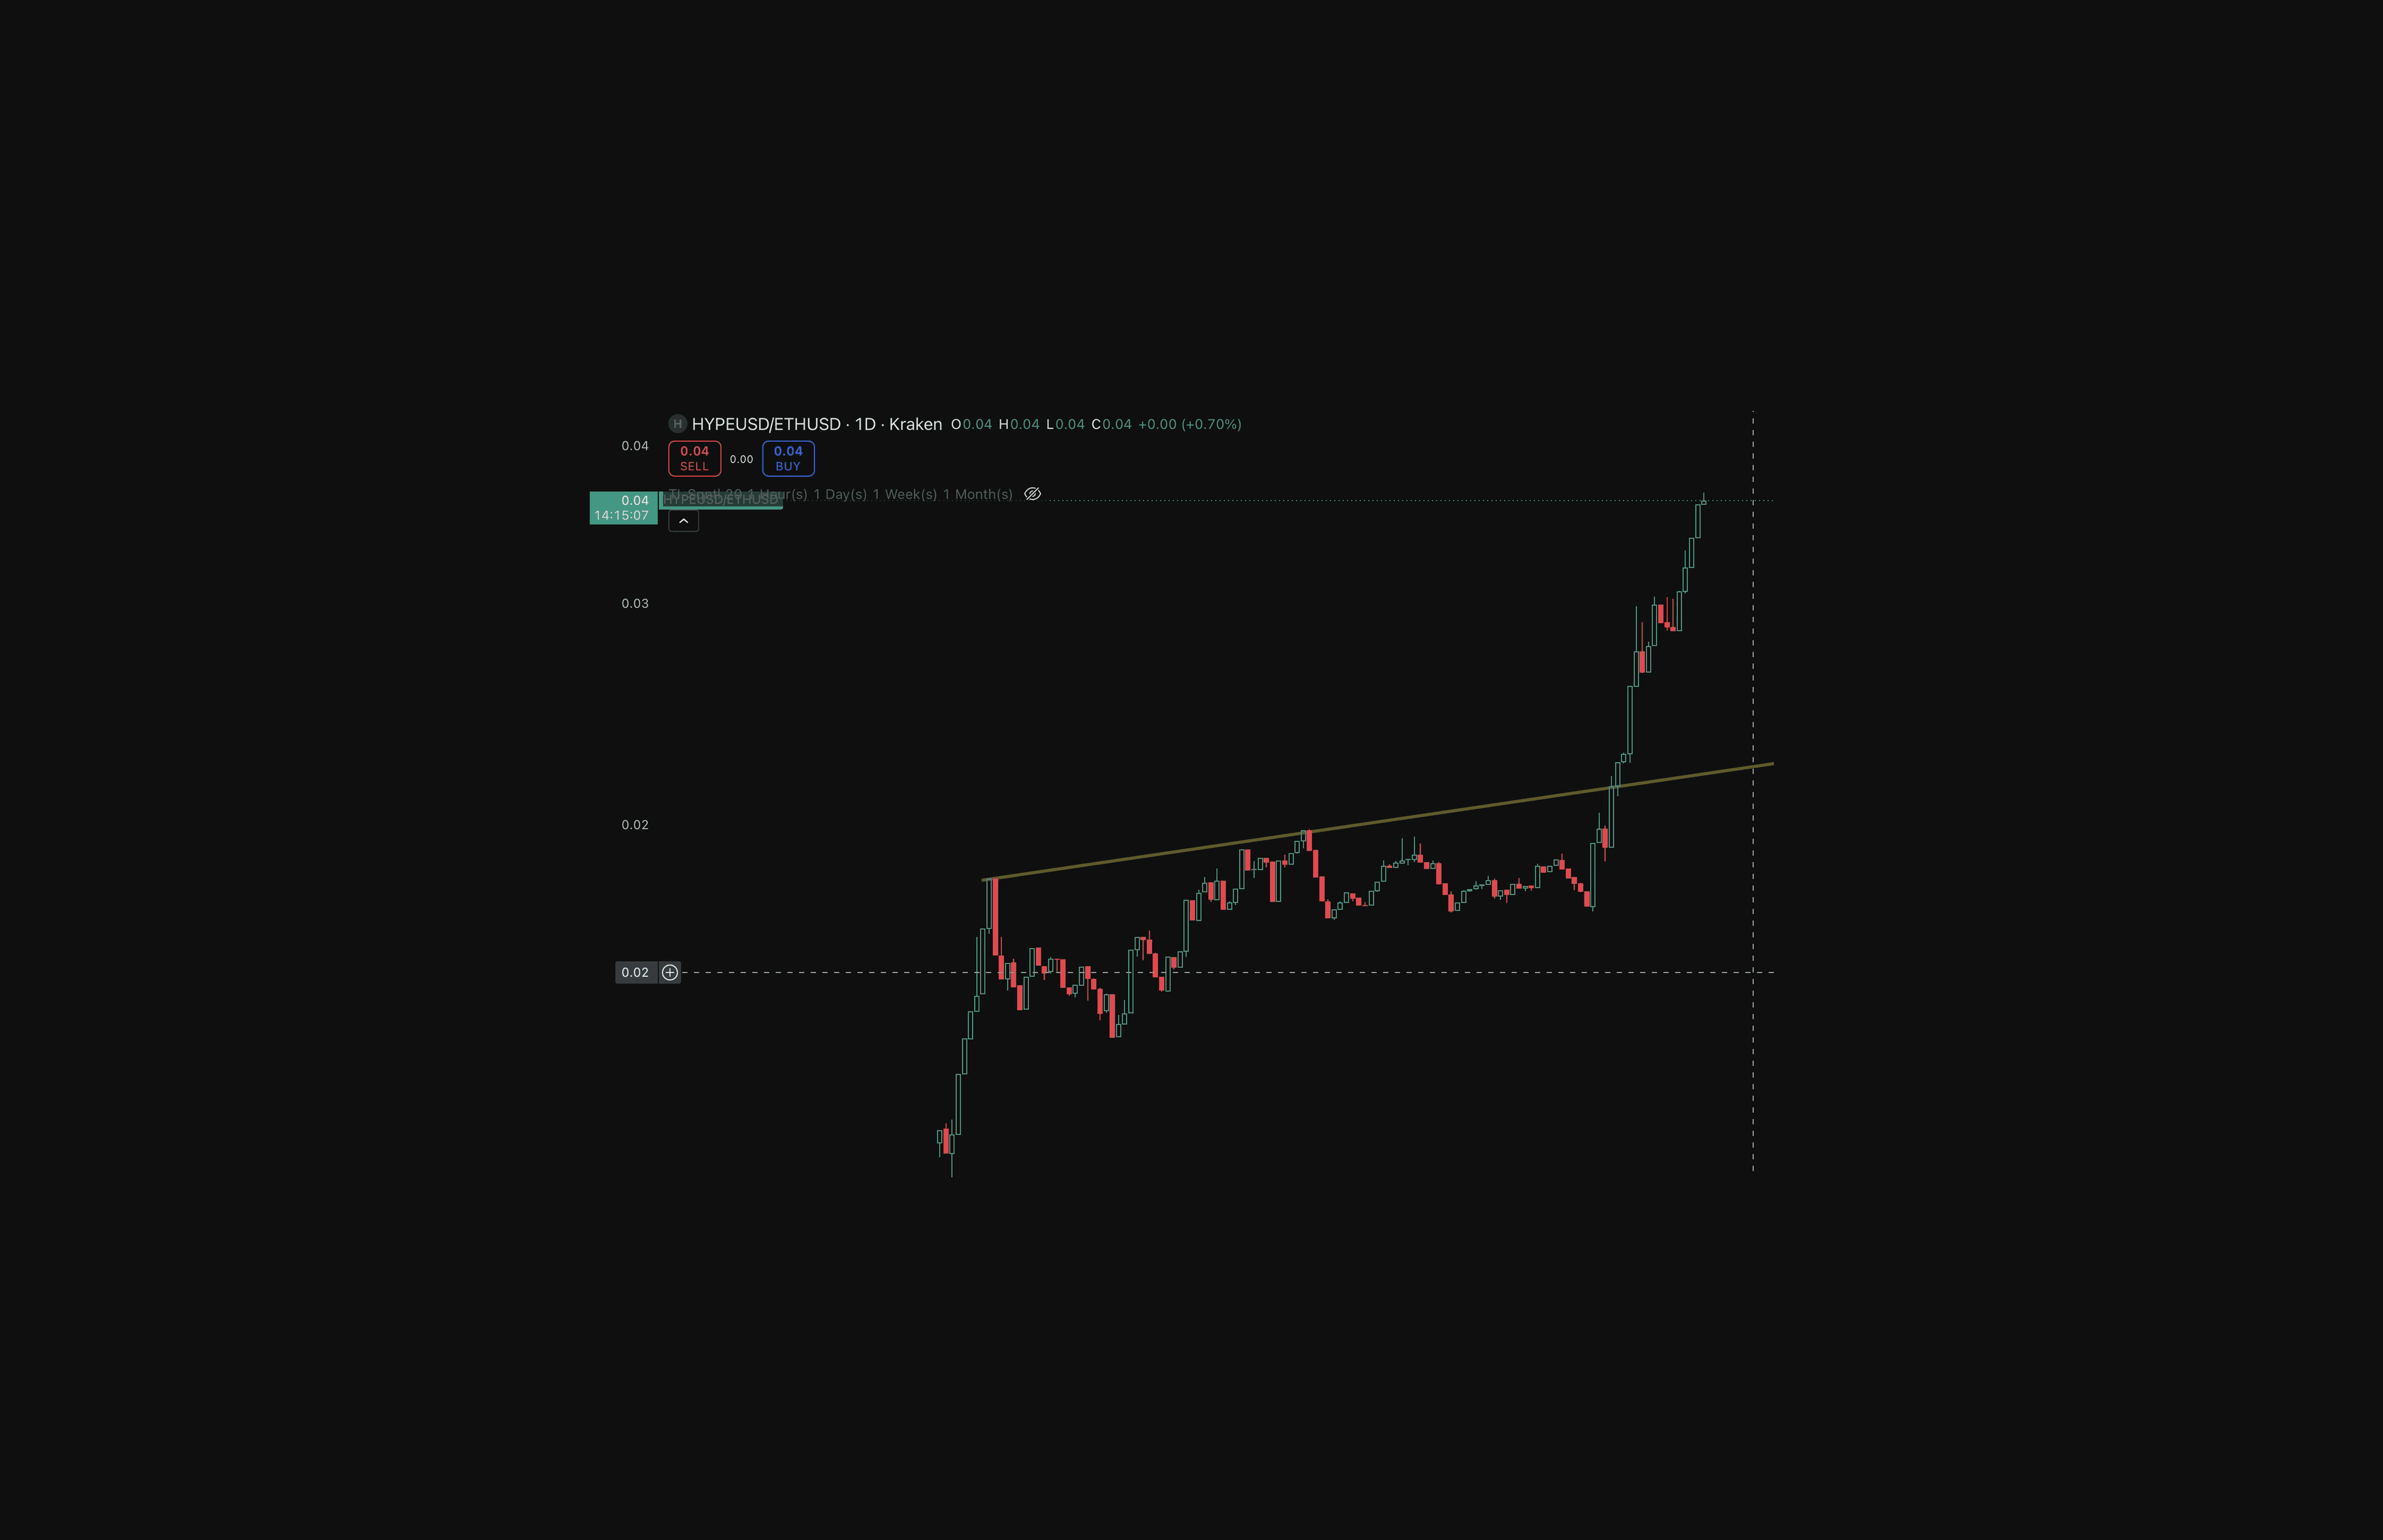
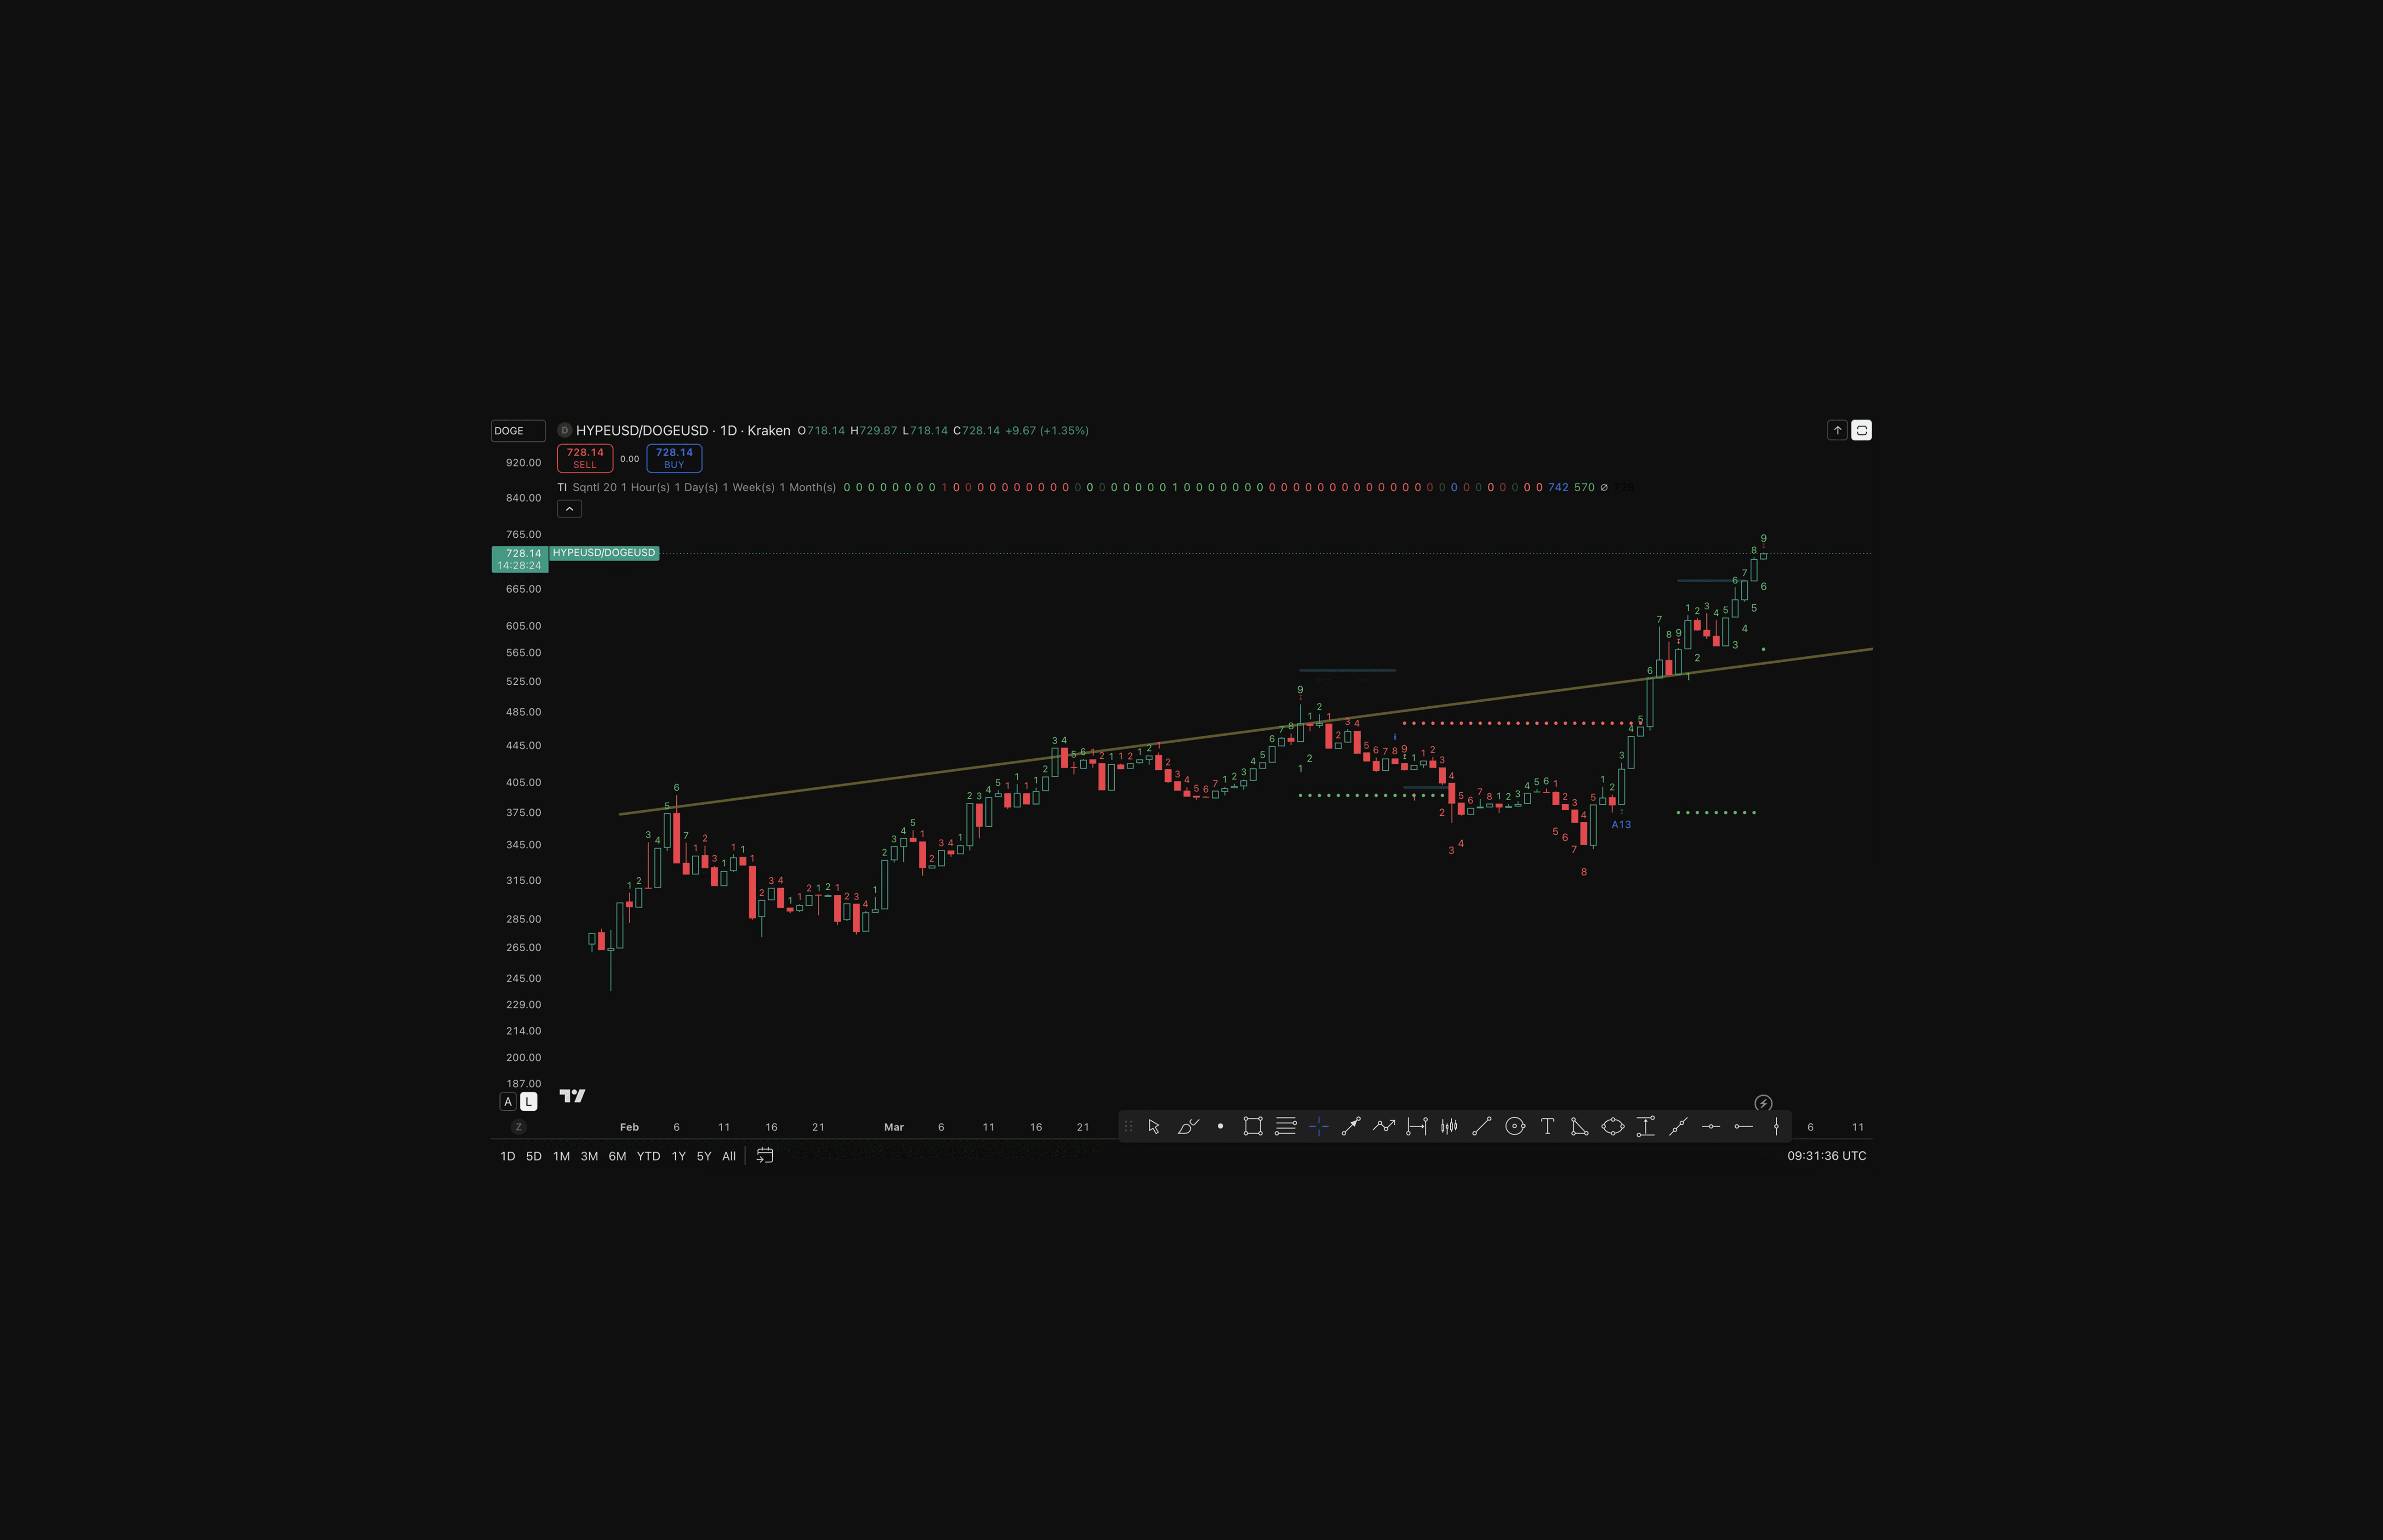
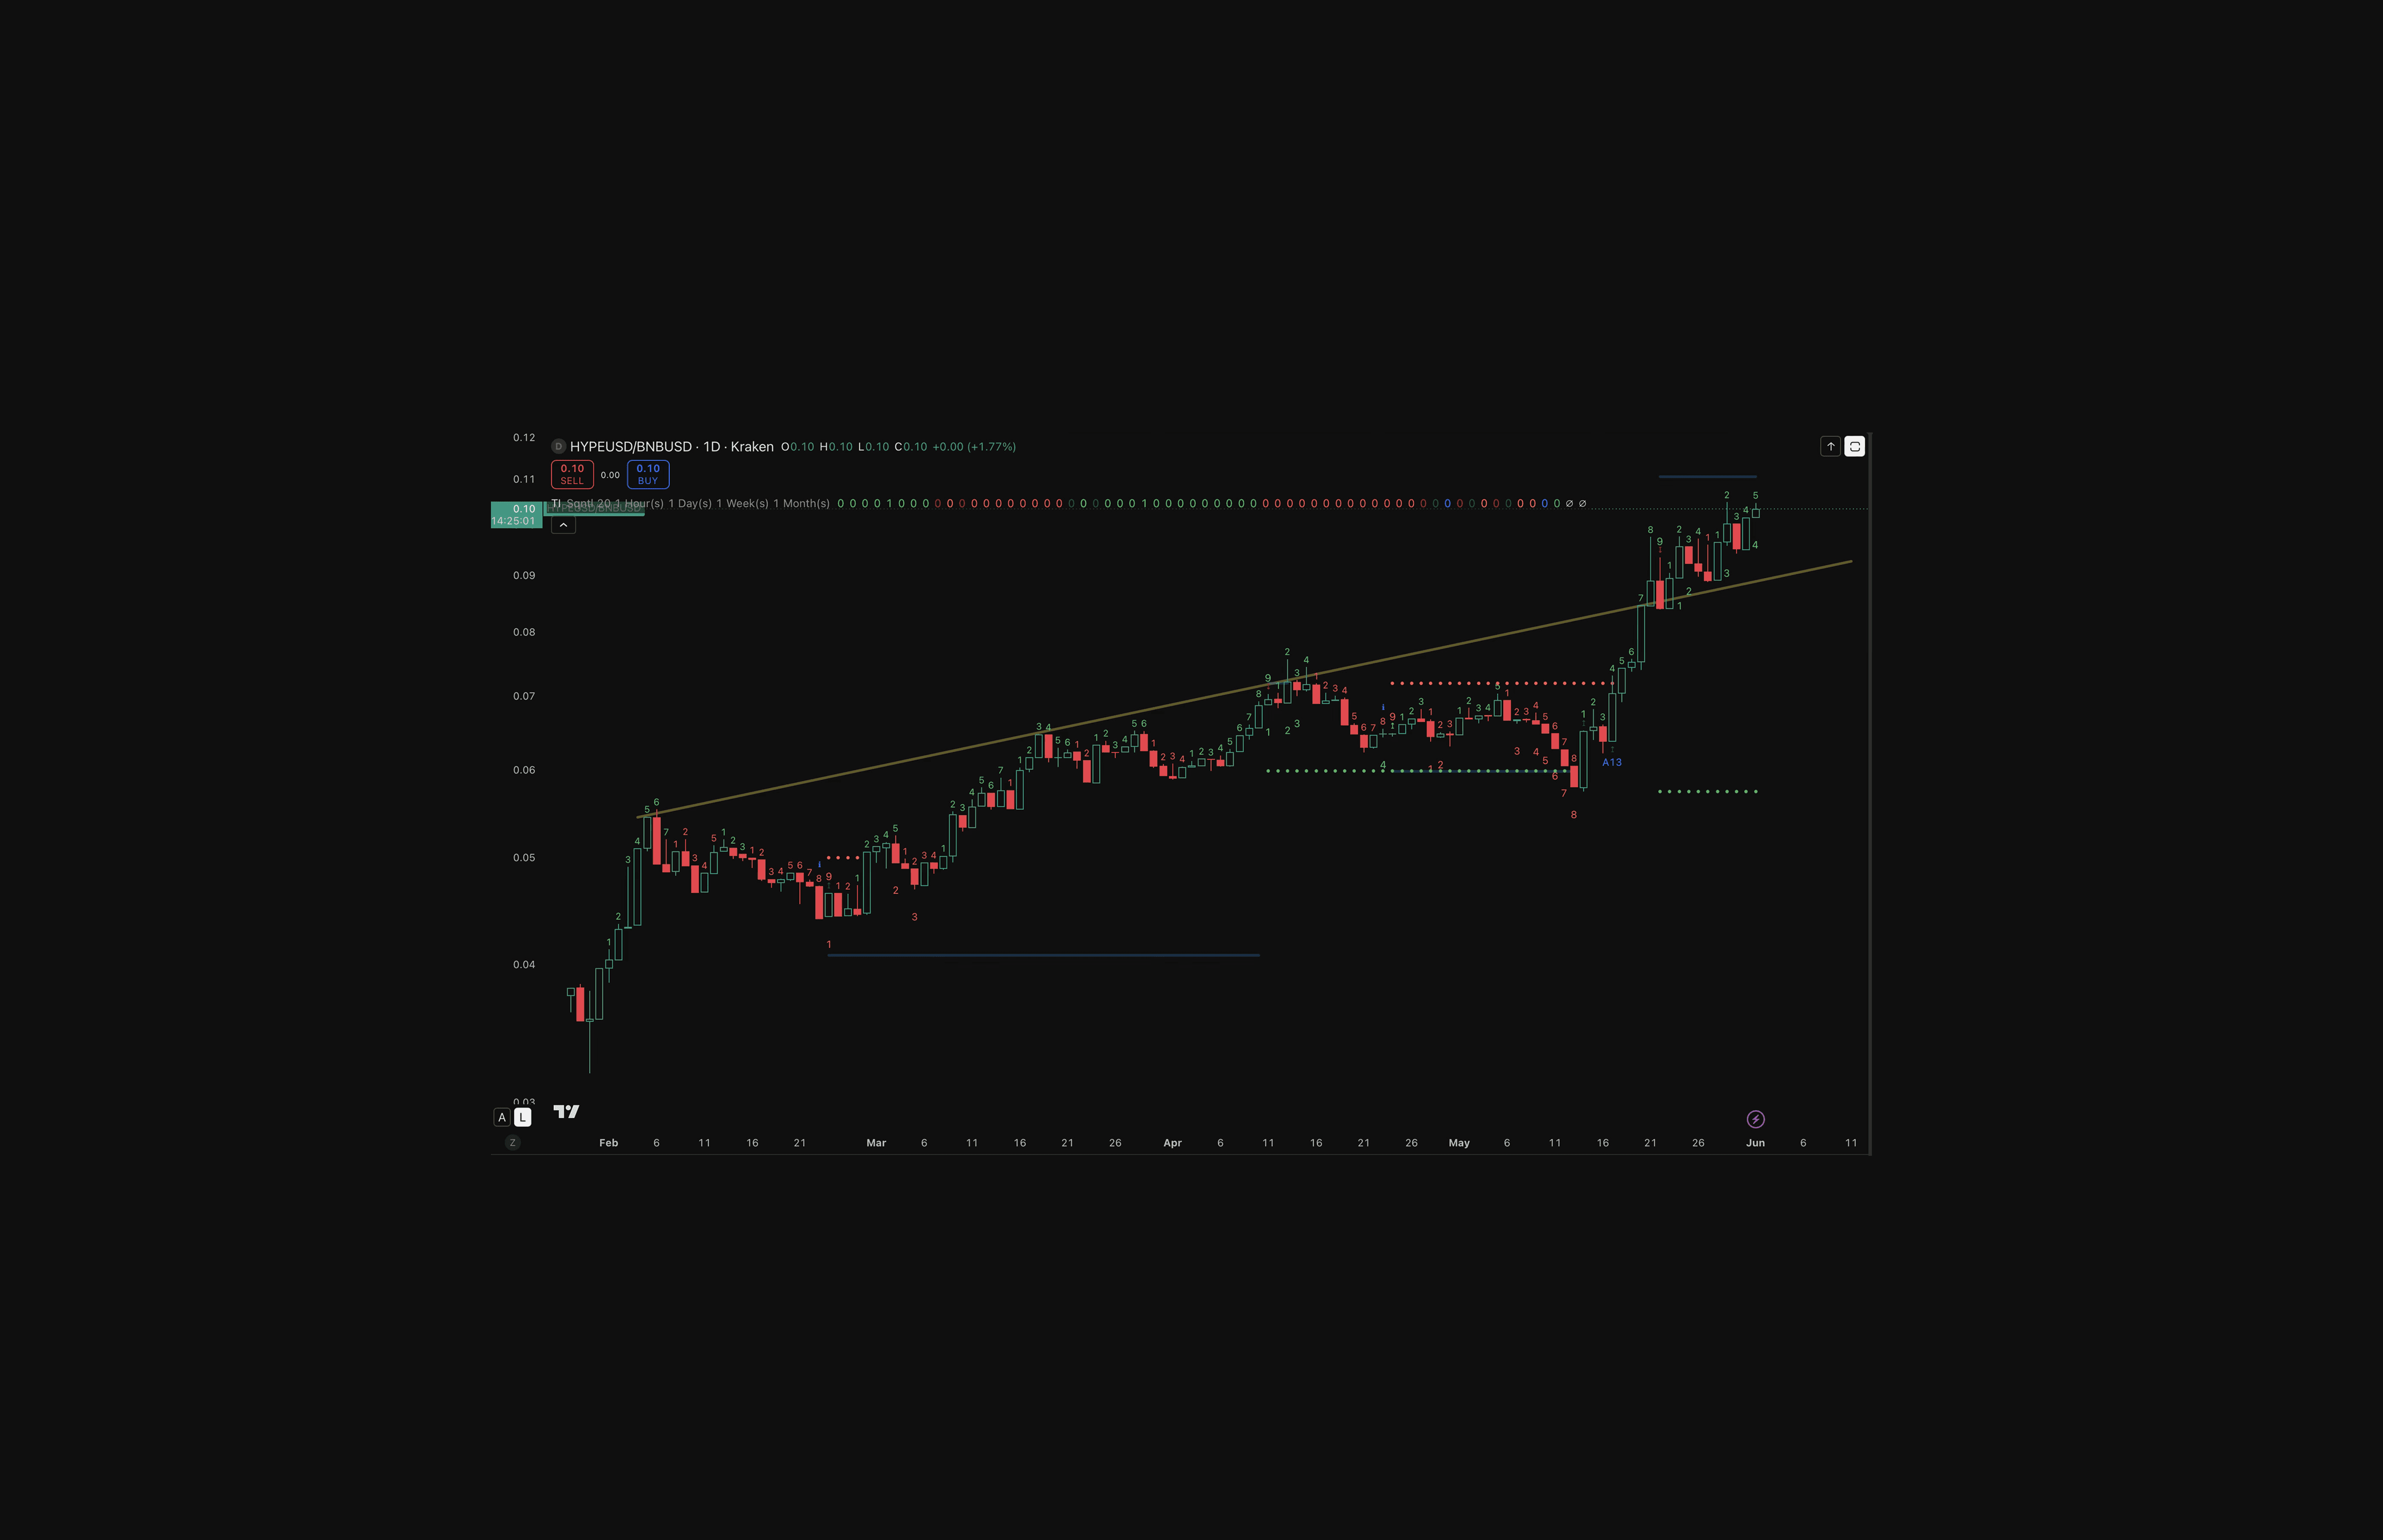
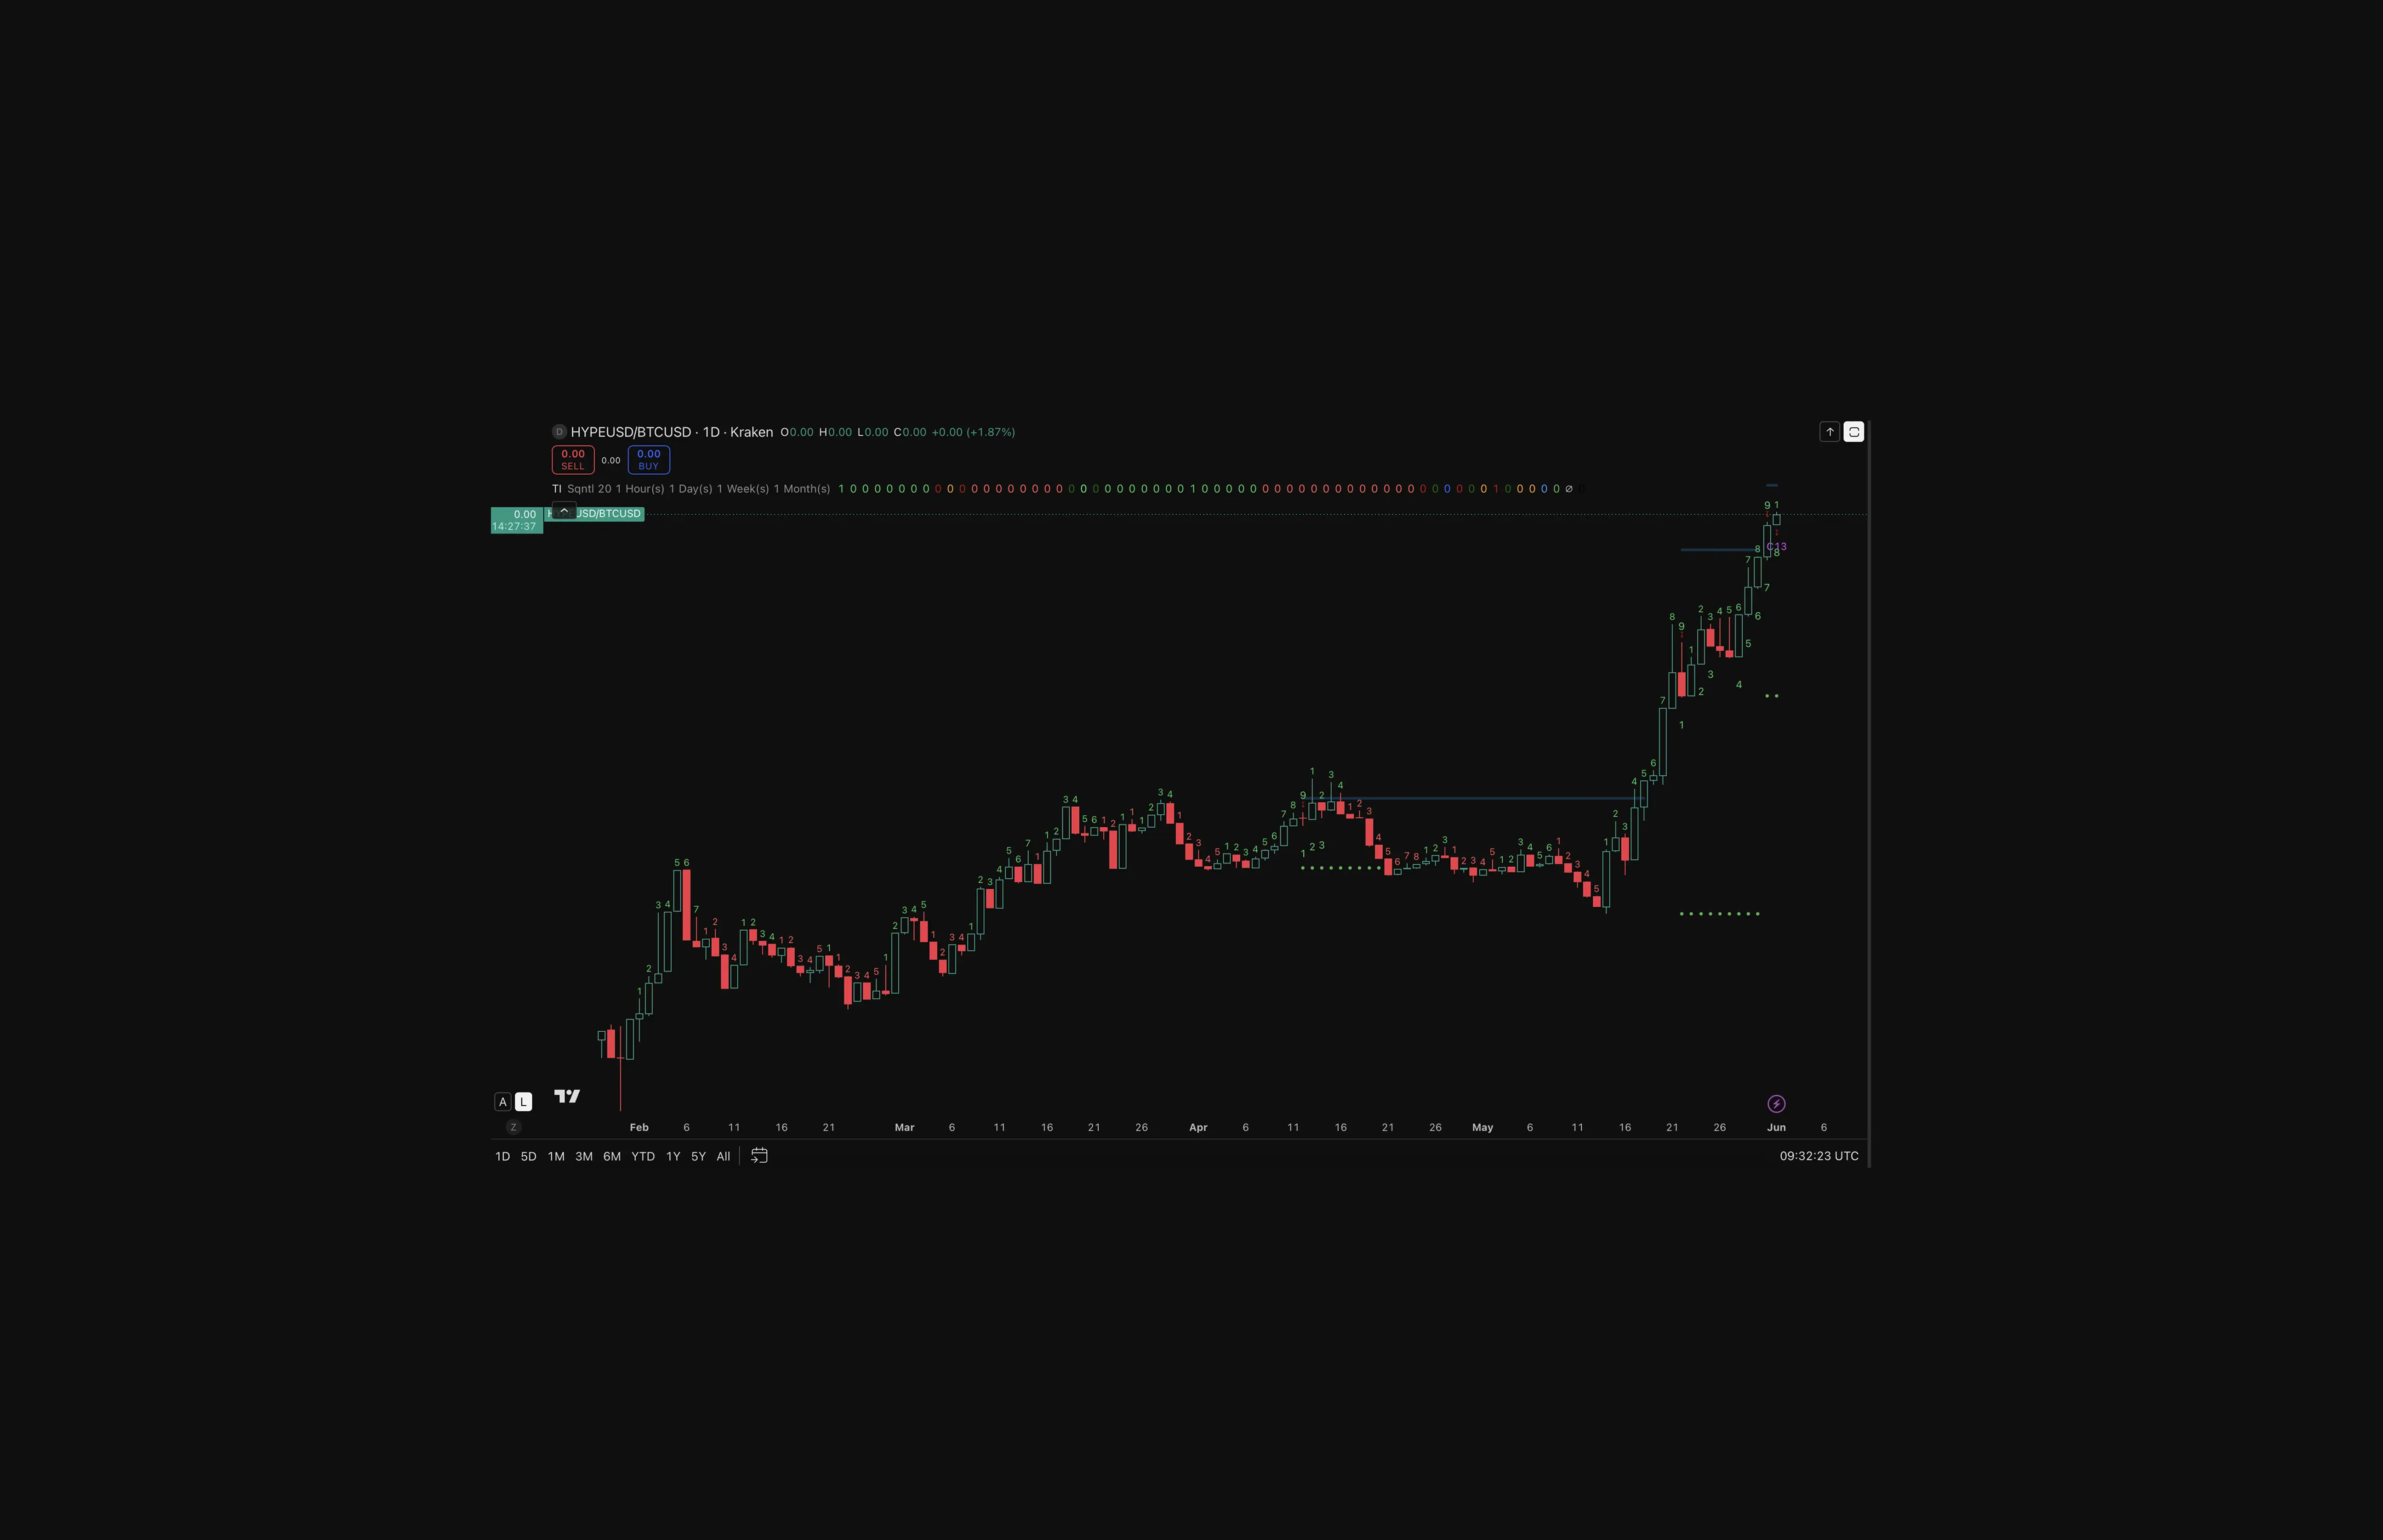
Measured against ETH, BTC, DOGE, and BNB since February 2026, HYPE has outpaced every pair. These are not USD charts inflated by a broad market move but they are ratio charts showing HYPE gaining ground against assets that were themselves rising.
All four follow the same pattern: consistent uptrend, no meaningful reversal period, ratio intact through the May ATH.
HYPE Revenue Engine: What Is Actually Driving Buybacks
Hyperliquid's buyback mechanism is funded by trading fees, 99% of which flow back to HYPE holders.
As of June 1, the protocol is generating $1.48 million in daily revenue. Every dollar goes toward repurchasing and permanently burning HYPE.
Buyback Rate: Every day, 20,100 HYPE tokens are permanently removed from circulation, funded entirely by trading fees. Over the trailing 12 months, the $932M channelled to buybacks represents a 5.8% annualised yield against HYPE's $16B market cap
Revenue Concentration: 92.8% of fees come from perpetual futures trading, the highest-volume activity on the platform. Every time a trader opens or closes a leveraged position, the burn engine gets funded
Concentration Risk: The burn engine runs on one fuel source perpetual futures trading fees. Hyperliquid currently handles nearly 80% of all on-chain perpetual futures volume, so for the burn rate to slow, traders would have to abandon the entire market, not just Hyperliquid.
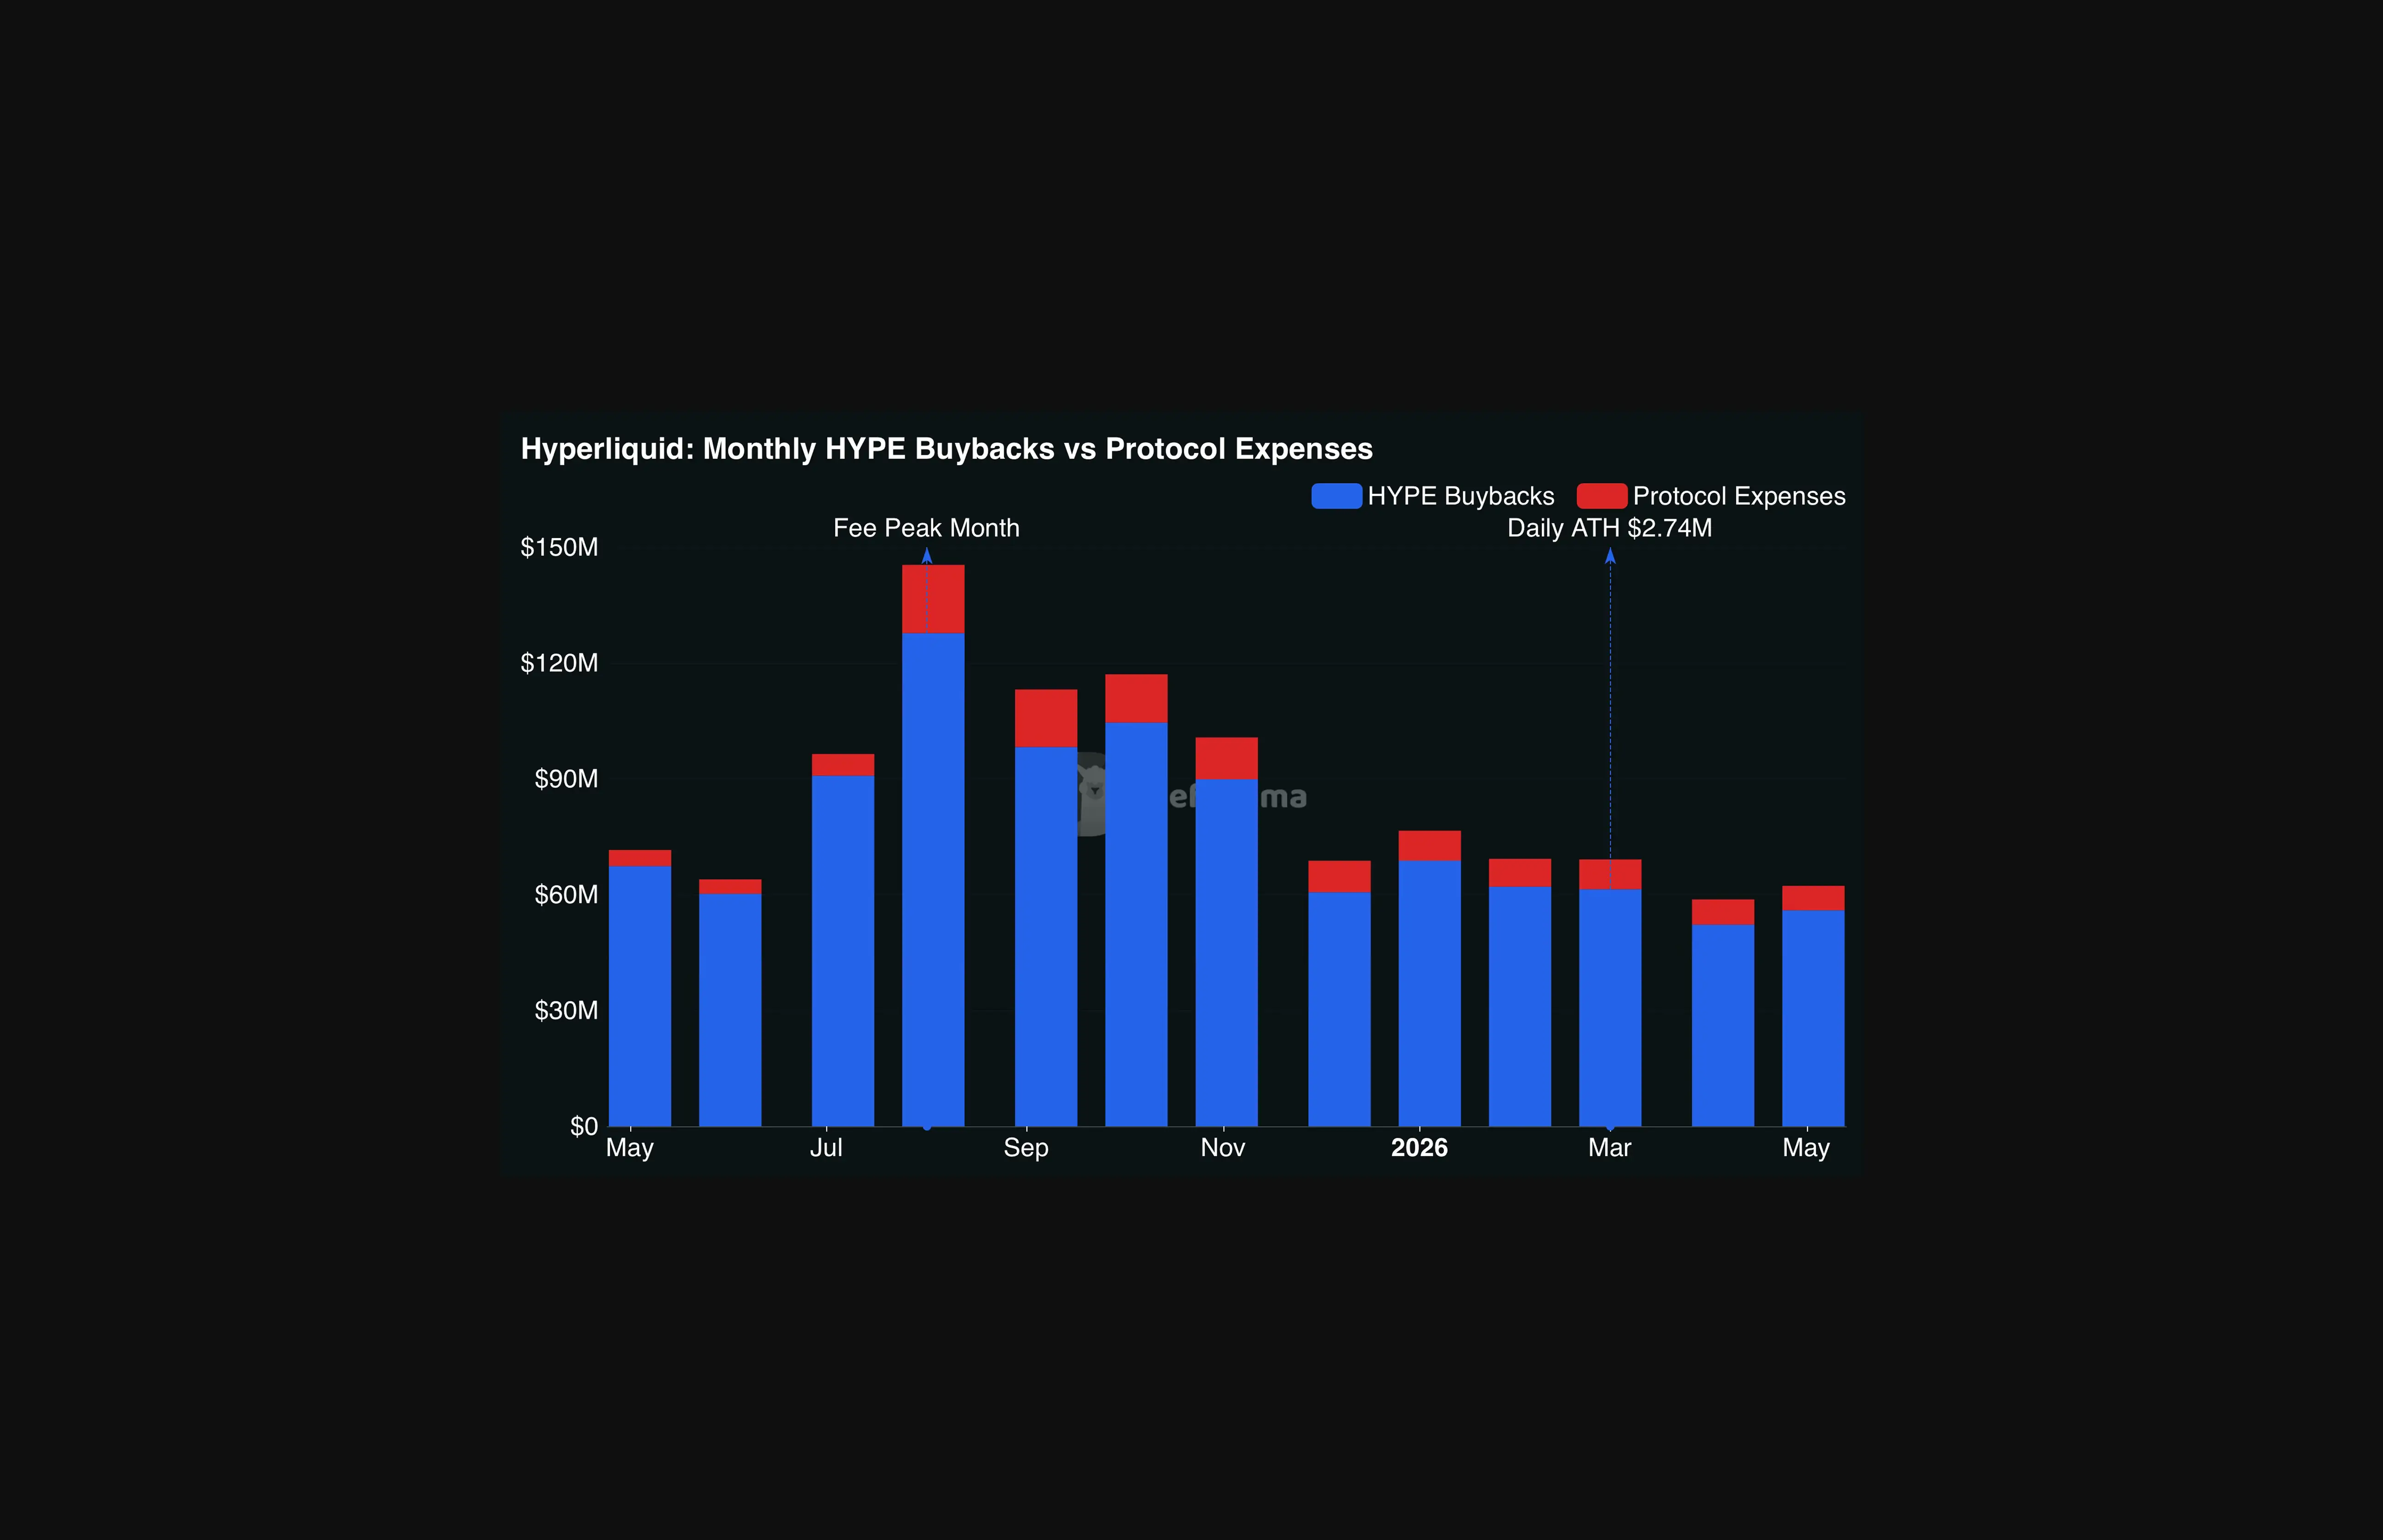
Buyback Consistency: Between 88% and 93% of every month's fees have gone directly to HYPE repurchases. Protocol expenses, the red in the chart, are a thin sliver across the entire period
Peak Efficiency: August 2025 was the highest buyback month at $127.7M, occurring before the current all-time high. The protocol was burning tokens at far lower prices than today
Key Number: $932 million channelled to HYPE buybacks over the trailing 12 months, out of $1.04 billion in total fees collected. The gap between those two figures is the red in the chart.
How Hyperliquid Compares to Every Major Perpetual DEX
Among the top perpetual DEX protocols, Hyperliquid captured 79.7% of all 30-day revenue across the top five.
Protocol | 30-Day Revenue | P/F Ratio | 12-Month Revenue Trend |
Hyperliquid | $54.3M | 22.5x | Growing |
EdgeX | $5.9M | 3.5x | Limited history |
Jupiter | $4.1M | 3.9x | Flat |
GMX | $716K | 3.0x | -58% |
dYdX | $242K | 54.1x | Declining |
GMX was the benchmark protocol for on-chain perpetuals for two years. Hyperliquid now generates 76 times more monthly revenue. The price-to-fee ratio (P/F) measures how much the market is paying for every dollar of fees a protocol generates and the lower the number, the cheaper the asset looks relative to its revenue.
GMX: Revenue has fallen 58% in 12 months. The low P/F multiple reflects a shrinking business, not a discounted one.
Jupiter: Flat revenue trend. The 3.9x P/F looks cheap until compared against a protocol generating 13 times more fees.
dYdX: Trades at 54.1x on $242K in monthly revenue. HYPE at 22.5x generates 224 times more revenue for a lower multiple.
HYPE Supply Question the Market Is Quietly Pricing In
Of the 955 million total HYPE tokens, only 377 million have followed a publicly tracked release schedule. The remaining 578 million or 60.5% of total supply have no confirmed release dates in any public database.
What Is Confirmed: No major token releases are scheduled in the next 12 months.
What Is Not Confirmed: The Foundation, ecosystem partners, and community programs hold the remaining 60.5% of total supply. No public release schedule exists for when those tokens enter circulation.
The question worth watching: if allocated token supply enters circulation faster than the burn mechanism can absorb it, price faces headwinds. If it enters slowly or the burn rate accelerates, the supply overhang becomes negligible.
What Happens to HYPE If Trading Volume Drops?
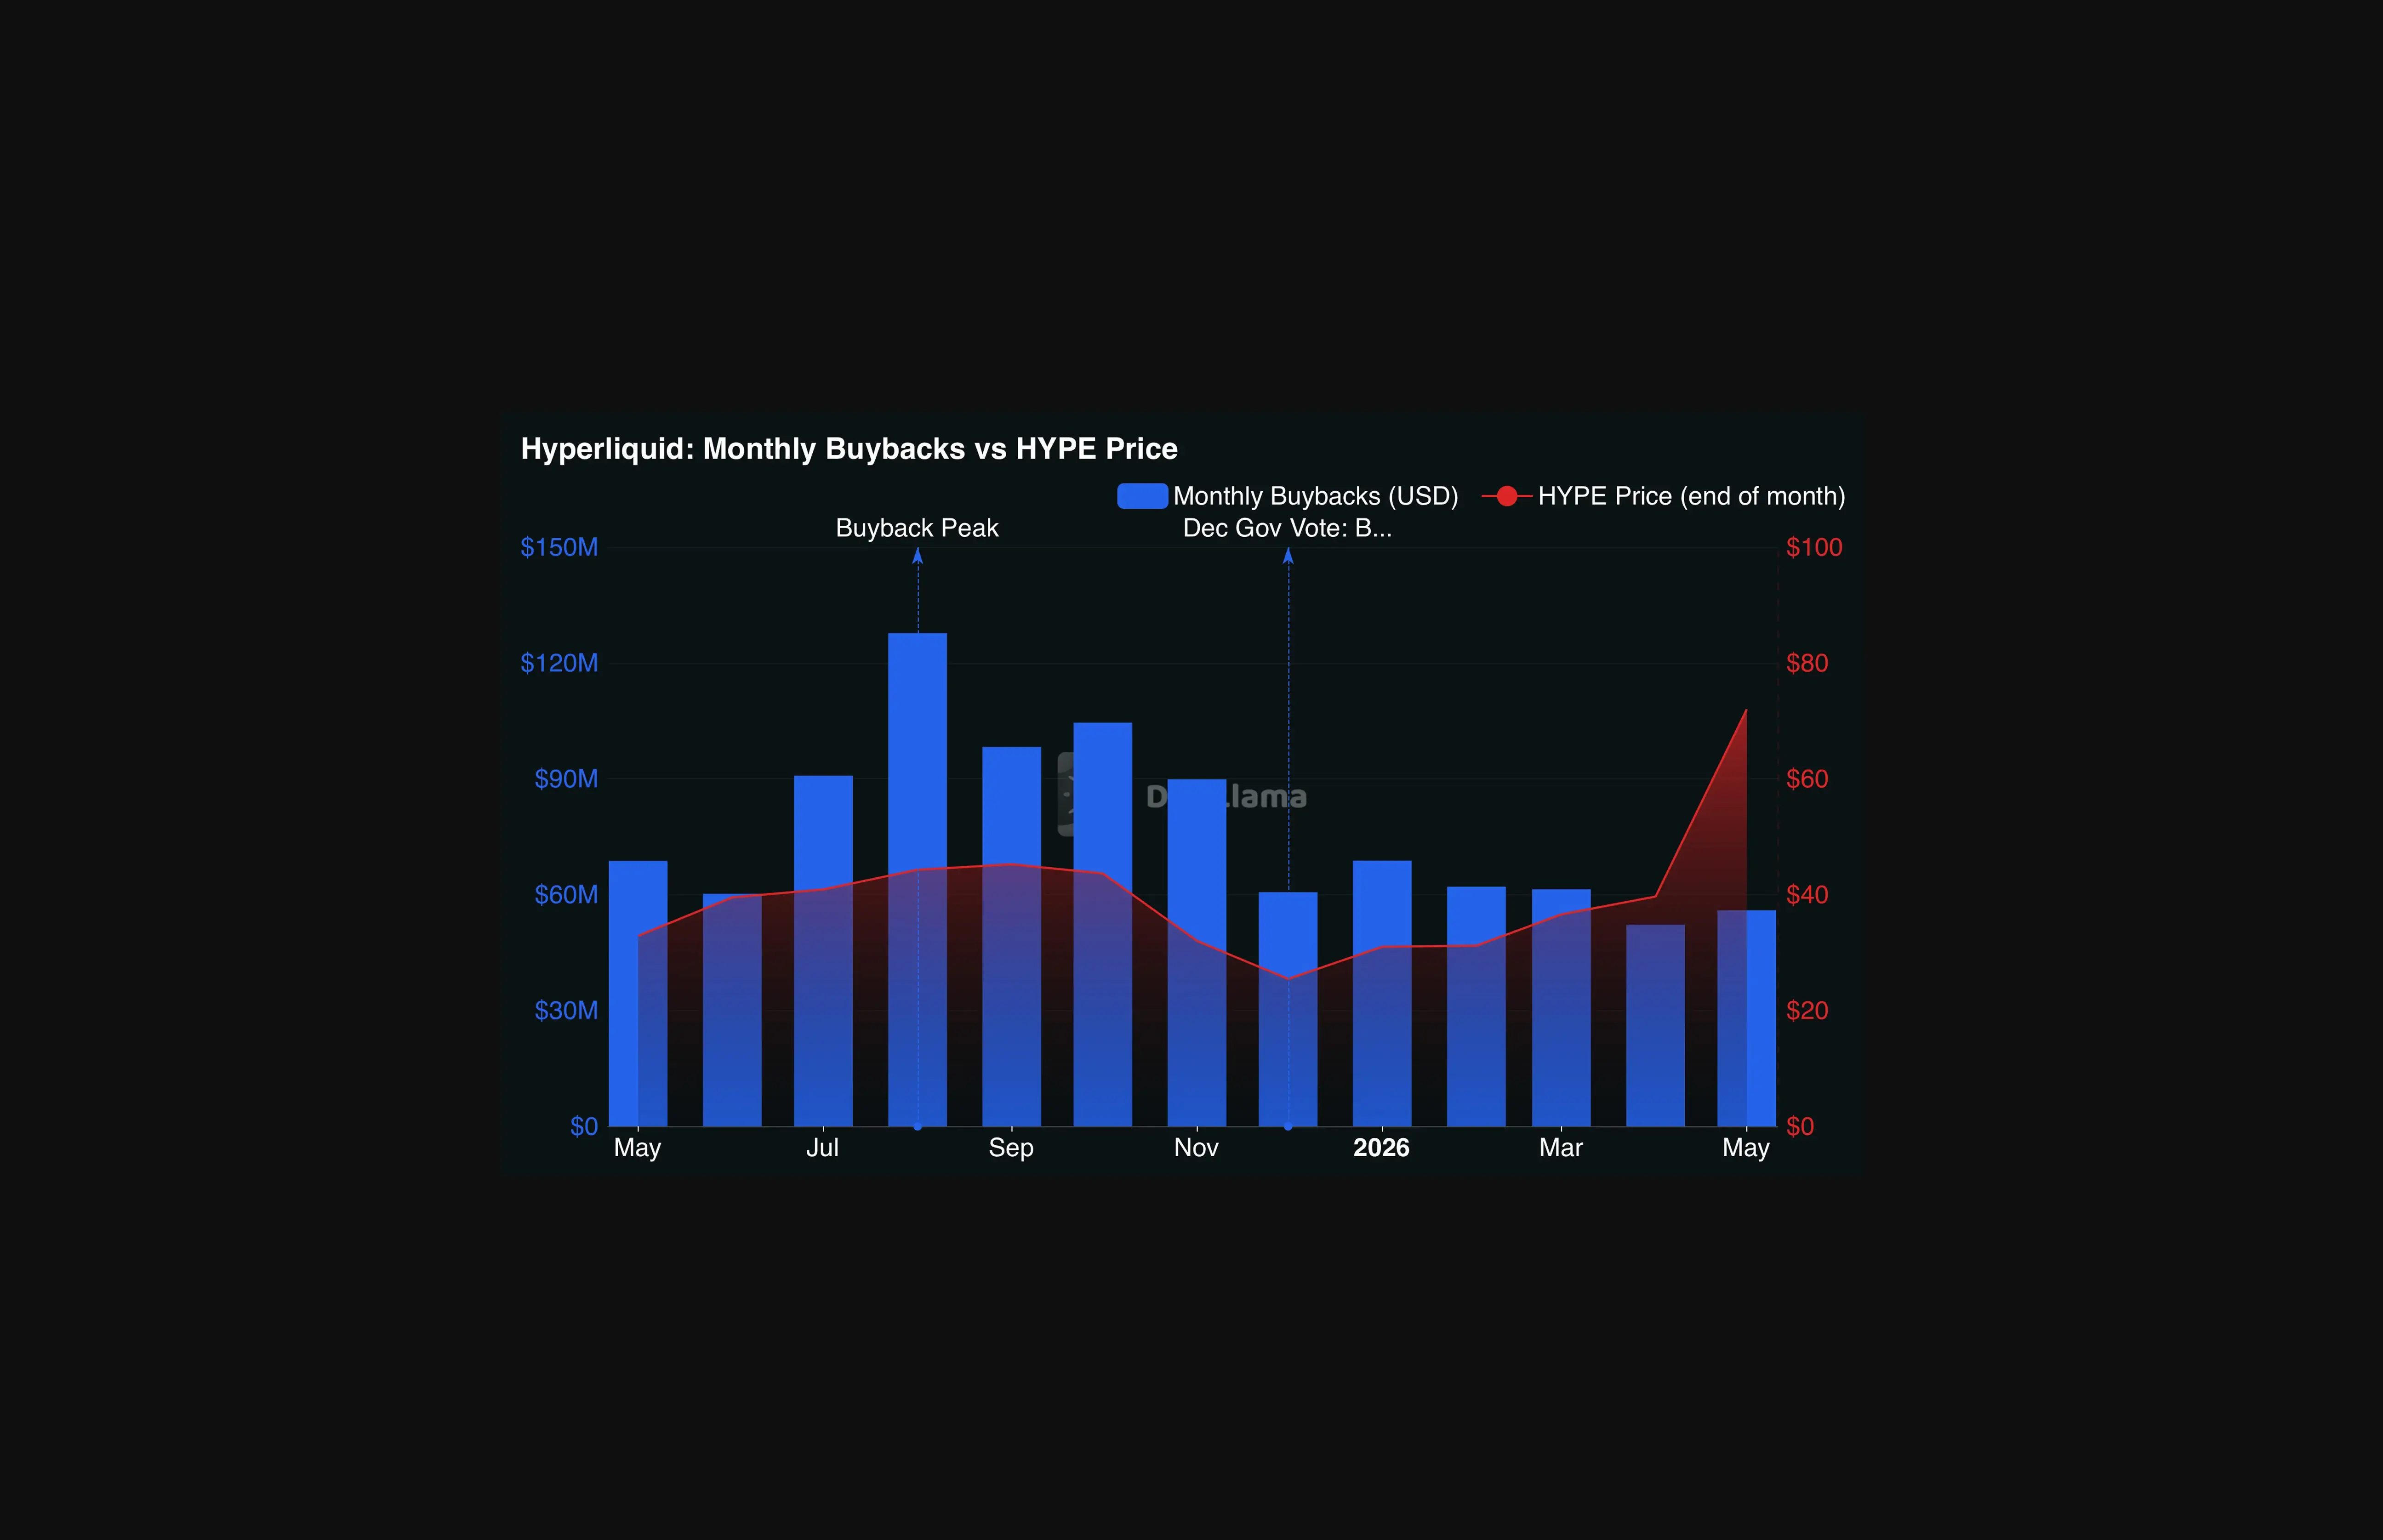
The bars show monthly dollars spent repurchasing and permanently burning HYPE. The line shows where the price closed each month.
Buyback peak price lag: August 2025 saw the largest single buyback month at $127.7M and HYPE was trading at $44. The mechanism was removing the most tokens at the lowest prices
Cooldown: Buybacks pulled back through Q4 2025 into the $60M range. Price followed, dropping to $25 by year end
Divergence: By May 2026, monthly buybacks sat at $55.9M roughly half the August peak. HYPE closed the month at $72. The burn engine was running slower in dollar terms while price hit all-time highs.
One likely explanation: the December 2025 governance vote made burns permanent and irreversible. The market may have stopped pricing what was being burned that month and started pricing every future month's burns as locked-in certainty.
The 50% volume stress test is visible in the chart without a model. Buybacks dropped 40-50% from peak across Q4 2025 and Q1 2026.
The Hyperliquid protocol did not break. Price recovered and pushed to new highs while buybacks ran at half their peak rate. Compression of the bars slows the mechanism, it does not stop it.
What to Watch On HYPE in 2026
Two variables define the HYPE thesis from here.
Volume Trend: Revenue peaked in March at $2.74M in daily fees. As of June 1, fees sit at $1.67M a cooling from the peak, with 30-day fee growth at 3.8%. Stable, not accelerating.
Untracked Supply: The most important question in this analysis is not answered by price charts. What is the release schedule for the 578 million HYPE outside the tracked unlock calendar? When that becomes publicly legible, the valuation picture sharpens considerably.
Conclusion
The narrative around HYPE is backed by a real revenue base, a dominant competitive position, and an open question about future supply. At 22.5x P/F, the market has assigned a meaningful premium to that combination. Whether that premium holds depends almost entirely on whether the revenue engine does.
The Coinjuice trading ebook covers position sizing and structural analysis frameworks applicable to high-multiple assets with asymmetric supply risk. All figures referenced in this article are sourced from DefiLlama and accurate as of June 1, 2026.
FAQ
What are the main functions of the HYPE token in the Hyperliquid ecosystem?
HYPE secures the Hyperliquid proof-of-stake Layer 1 blockchain through staking and captures protocol revenue through an automated buyback and burn mechanism.
How much revenue has been returned to HYPE holders through buybacks?
Over the last 12 months, $932 million has been channelled to HYPE buybacks out of $1.04 billion in total fees collected, with 99% of protocol revenue flowing back to HYPE holders.
What is the key supply-related risk for HYPE going forward?
Out of 955 million total HYPE tokens, 578 million tokens, or 60.5% of supply, have no confirmed public release schedule. If this allocated supply enters circulation faster than the burn mechanism can absorb it, price faces headwinds; if it enters slowly or burn accelerates, the supply overhang becomes negligible.
How dominant is Hyperliquid among perpetual DEX protocols based on revenue?
Among the top perpetual DEX protocols, Hyperliquid captured 79.7% of all 30-day revenue across the top five, generating $54.3 million in 30-day revenue with a growing 12-month revenue trend and a 22.5x price-to-fee ratio.
Disclaimer
The information provided in this article is for informational purposes only. It is not intended to be, nor should it be construed as, financial advice. We do not make any warranties regarding the completeness, reliability, or accuracy of this information. All investments involve risk, and past performance does not guarantee future results. We recommend consulting a financial advisor before making any investment decisions.
Written by

Andrew Kamsky
Andrew Kamsky is a Bitcoin analyst. He spent a decade in traditional finance across a Big Four firm and a listed fintech bank before going deep on Bitcoin full-time.


