


Quick summary
Bitcoin’s fixed 21 million supply can be used as a rigid ruler to compare assets
Pricing gold, equities, and housing in BTC reveals their relative scale and unit bias
US housing, gold, and major stocks appear far costlier per BTC-equivalent than Bitcoin today
Despite volatility, Bitcoin’s capped supply makes cross-asset valuations clearer than expanding fiat rulers
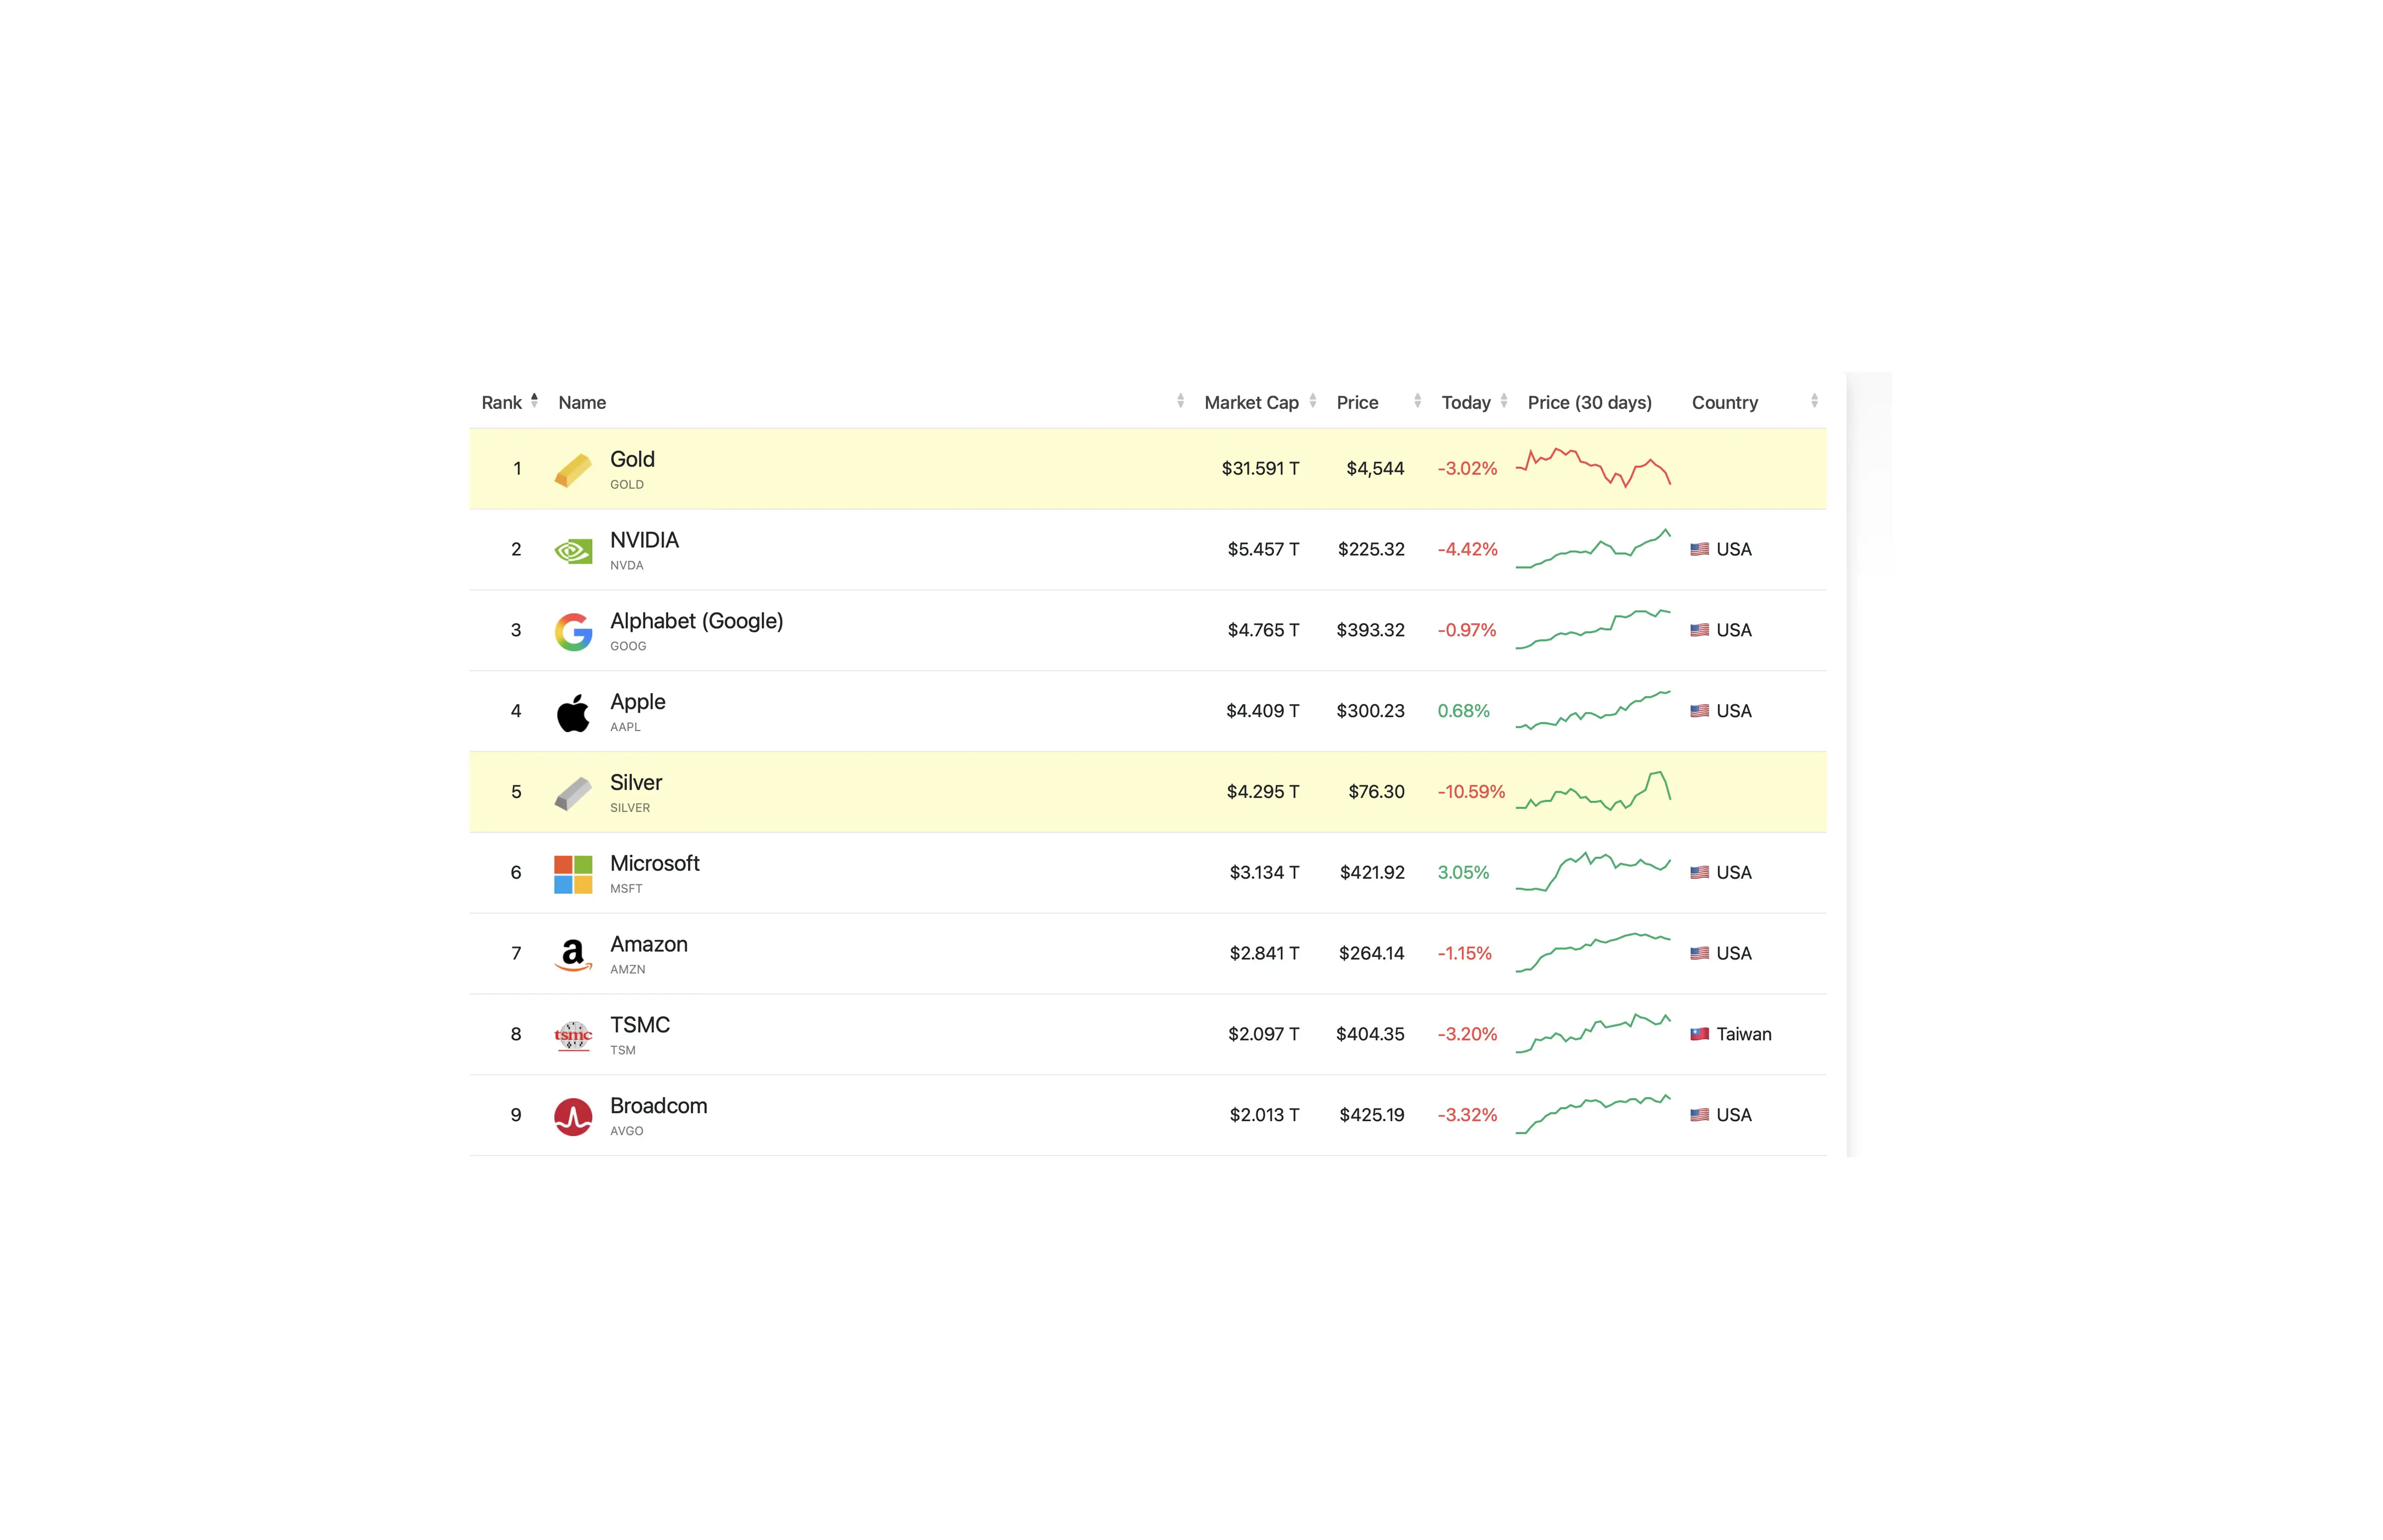
Gold's total market capitalisation in May 2026 stands at $31.59 trillion. NVIDIA, the combined value of every share in the company, sits at $5.46 trillion. Bitcoin's network value sits at $1.56 trillion.
Gold costs 20x the entire Bitcoin network. NVIDIA costs 3.5x. The S&P 500 costs 33x. Price Bitcoin against the world's largest assets and something shifts. BTC stops looking expensive and starts functioning as a measuring tool for everything else.
This article prices the world's largest asset classes in Bitcoin. A measuring exercise that compares assets on the same scale, the way you might compare NVIDIA to Apple, but with Bitcoin as the common unit.
How To Value Assets In Bitcoin: BTC Denominator
Every price ever quoted is a ratio between an asset and whatever is being used to measure it. At $78,000 per Bitcoin, that ratio is Bitcoin measured against the US dollar at a specific moment in time. But Bitcoin carries a fixed supply of 21 million coins. That fixed supply is the denominator.
Divide any asset's market capitalisation by 21 million and the comparison becomes direct.
Economists call the chosen unit of measurement a numéraire. The dollar is today's dominant numéraire. Oil, stocks, housing, gold all priced against the dollar. But the dollar supply expands continuously through monetary policy. It is an elastic ruler. The length of the stick changes while measuring.
US public debt stood at $11.1 trillion in Q1 2009.
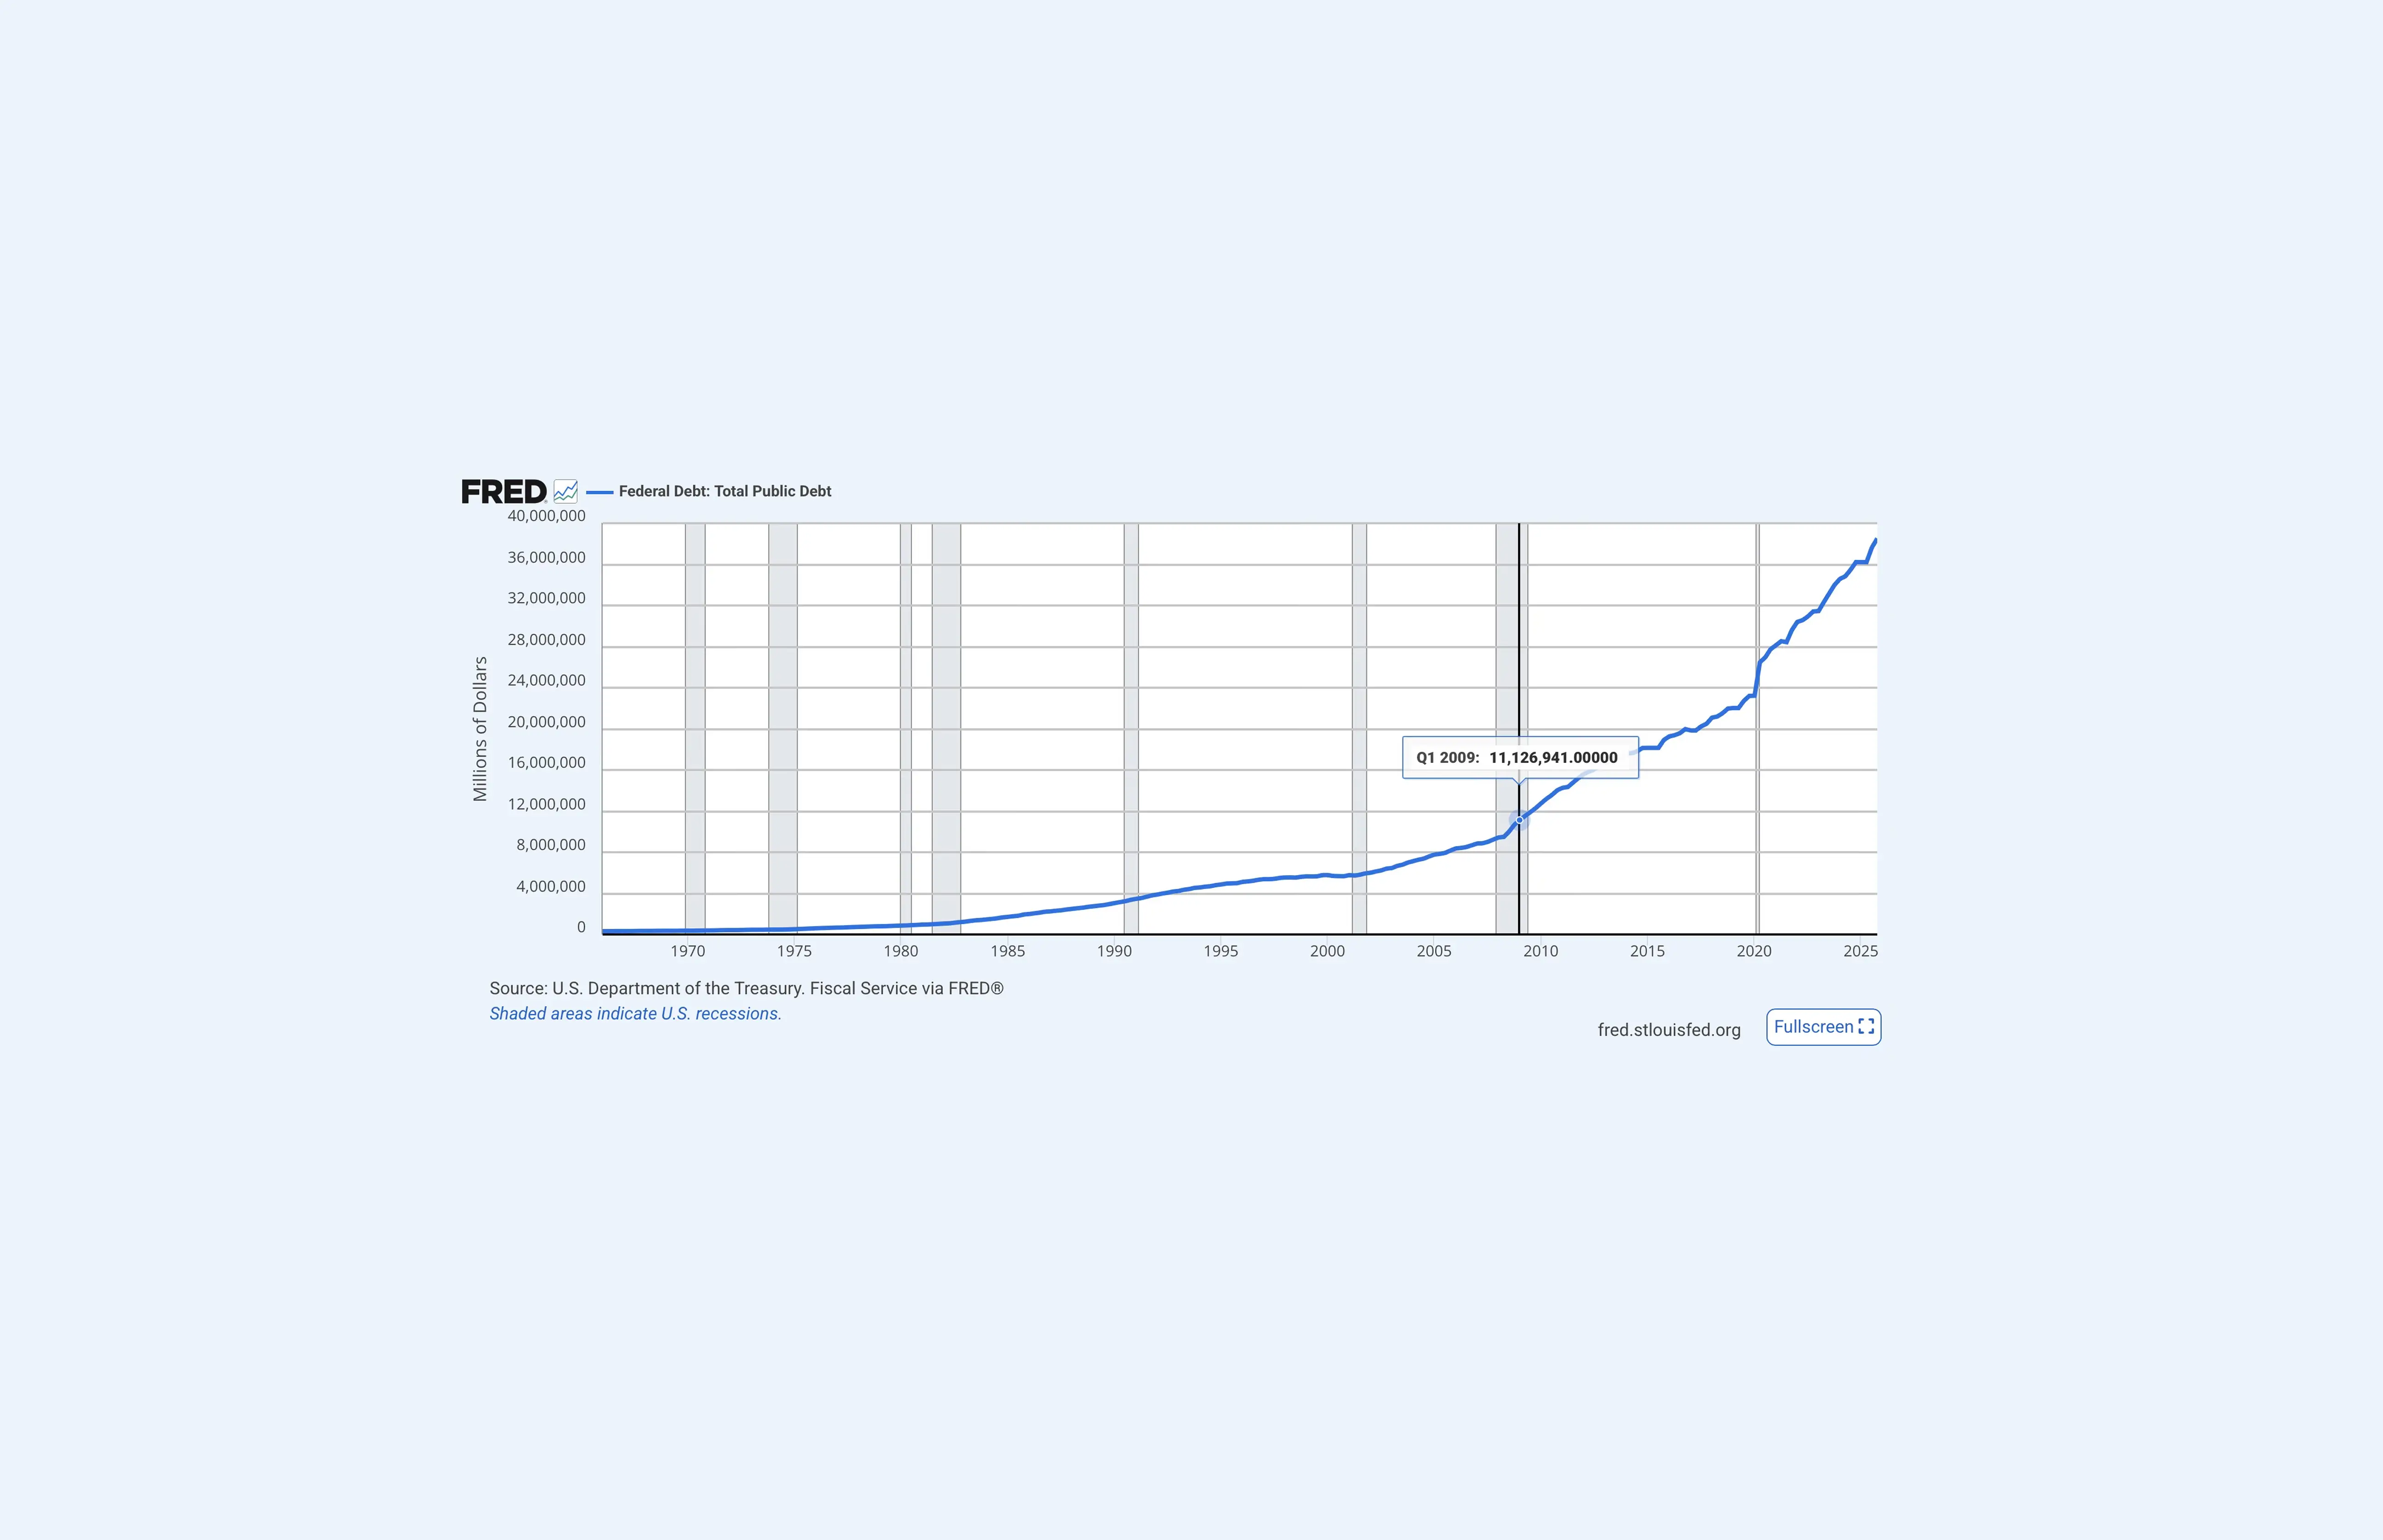
By Q4 2025 it reached $38.5 trillion, a 3.5x expansion in 16 years, per Federal Reserve data. The ruler stretched. Every asset priced in dollars was measured against a unit that kept shrinking.
Bitcoin's supply is roughly 20 million in circulation in May 2026. The issuance schedule is public, fixed, and unchangeable.
That makes Bitcoin a rigid ruler and rigid rulers reveal things elastic ones hide.
A 2007 LSE working paper by economist Willem Buiter Is Numérairology the Future of Monetary Economics? found that units of account are determined by individual choice and social convention, not government decree. The dollar is the dominant measuring stick not because it is the most accurate, but because convention made it the default. That convention is what Bitcoin is now pressure-testing.
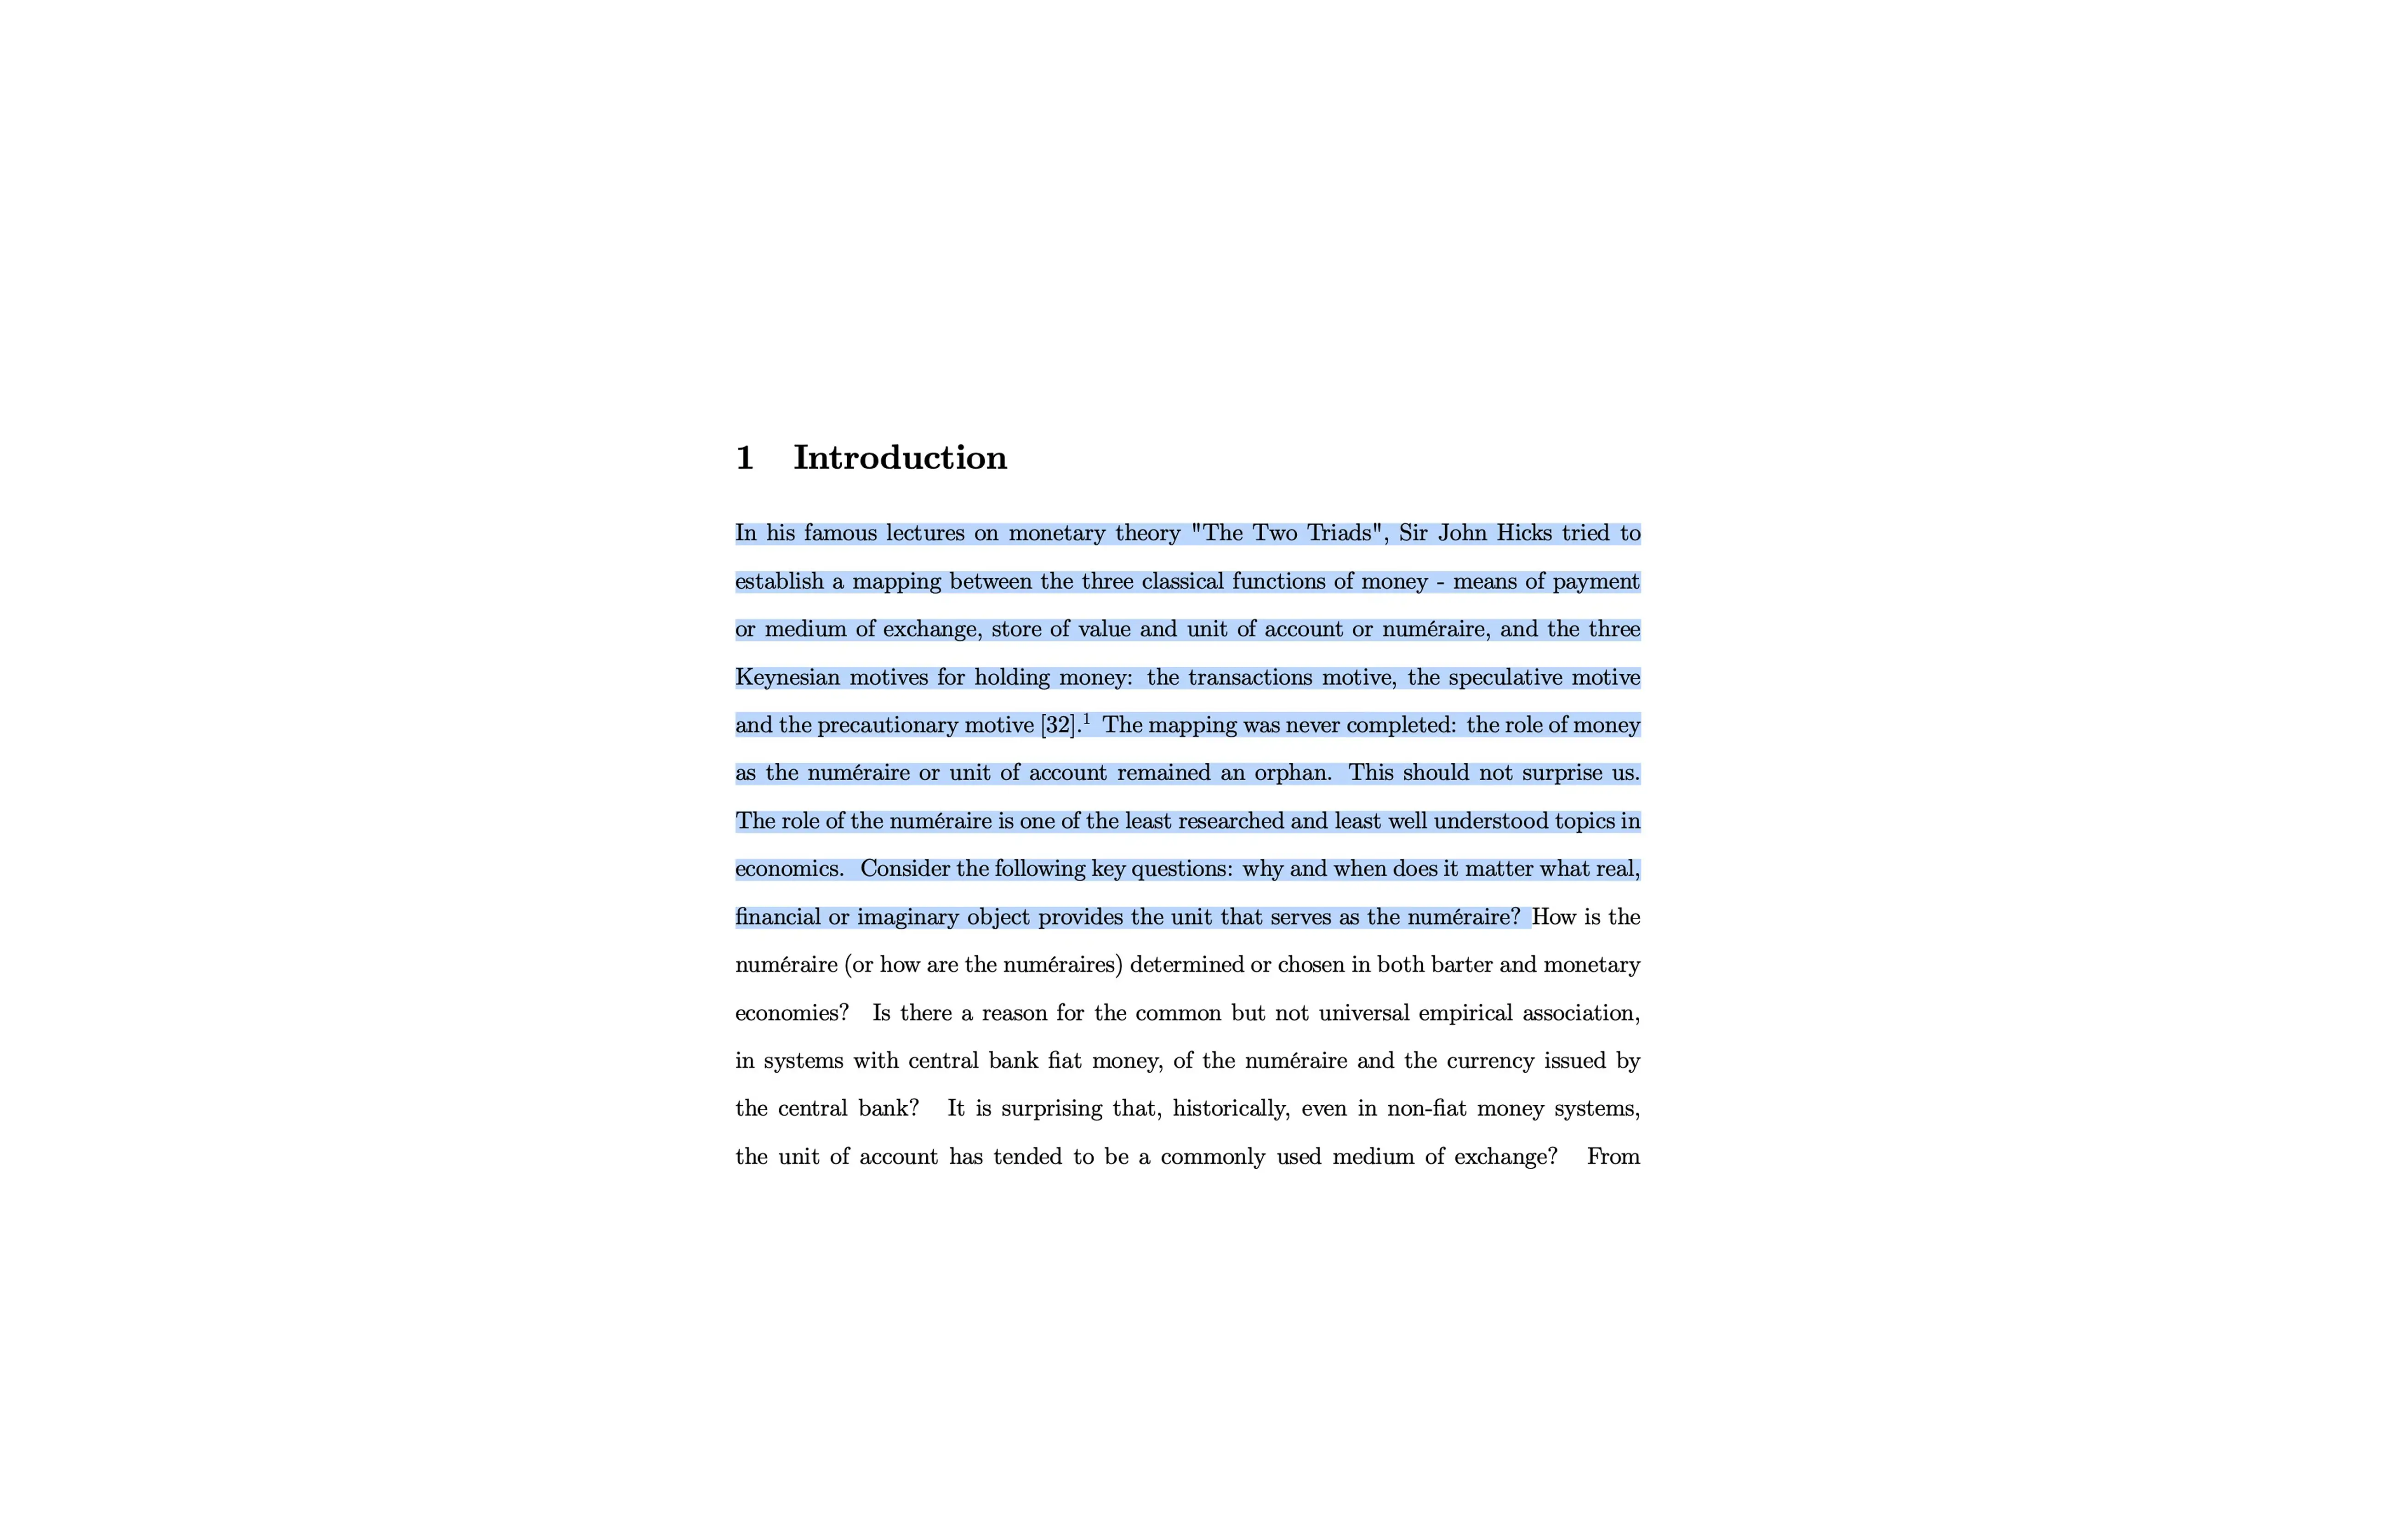
Buiter was not writing about Bitcoin. He could not have been. But the problem he identified in 2007, that economics had no satisfying theory of what determines the unit of account, is the same gap Bitcoin is testing in practice.
What Is Unit Bias In Bitcoin Pricing?
Most people see $78,000 and stop there assuming it is too expensive and that more opportunity lies elsewhere.
That number feels large. Larger than a share of Apple at $300. Larger than a share of Google at $393. The price of Bitcoin itself triggers hesitation, a cognitive response called unit bias, where the size of the unit influences perceived value independently of the underlying economics.
Run the same comparison through Bitcoin's ruler and the picture changes:
Apple: Entire market cap ($4.41T) costs 220,000 BTC ($4,410,000,000,000 ÷ 21,000,000)
NVIDIA: Entire market cap ($5.46T) costs 273,000 BTC ($5,460,000,000,000 ÷ 21,000,000)
Gold: Entire market cap ($31.59T) costs 1,580,000 BTC ($31,590,000,000,000 ÷ 21,000,000)
Bitcoin at one unit sits lower in cost than other assets on the table below. The question worth asking is: expensive relative to what?
When every major asset is measured against the same fixed supply, unit bias on Bitcoin dissolves.
Global Assets Priced In Bitcoin
Using market data from May 17, 2026, and Bitcoin's circulating supply (~20M BTC) and hard cap (21M BTC)
Asset | Market Cap | ÷ 20M BTC | ÷ 21M BTC |
Gold | $31.59T | $1.58M | $1.50M |
NVIDIA | $5.46T | $273k | $260k |
Alphabet (Google) | $4.77T | $238k | $227k |
Apple | $4.41T | $220k | $210k |
Silver | $4.30T | $215k | $204k |
Microsoft | $3.13T | $157k | $149k |
Amazon | $2.84T | $142k | $135k |
Tesla | $1.59T | $79k | $75k |
Bitcoin | $1.56T | $78k | $74k |
Saudi Aramco | $1.79T | $89k | $85k |
Reading this table correctly the ÷ 21M column asks what one Bitcoin would need to be worth if Bitcoin's entire monetary base were equivalent to that asset's total market capitalization. A scale comparison, with no price target implied.
Both figures answer the same question: if Bitcoin's entire monetary base were equivalent to that asset's market capitalisation, what would one BTC be worth? That makes every row directly comparable, one Bitcoin measured against one Bitcoin.
Gold At 20x: What The Ruler Shows
Gold's market cap sits at $31.59 trillion. Bitcoin's sits at $1.56 trillion.
Gold carries a millennium of monetary history and is currently valued at 20x the entire Bitcoin network.
Two possible interpretations:
Gold is right: Monetary assets at scale command massive premiums. Bitcoin, as a younger and still-maturing monetary network, has considerable room to grow into gold's implied valuation. The ÷ 21M column suggests $1.5 million per BTC if Bitcoin ever matches gold's monetary footprint
Bitcoin makes gold look expensive: A fixed-supply, globally liquid, infinitely divisible, digitally native monetary asset trading at 1/20th of gold's valuation could represent one of the more unusual valuation gaps in modern finance.
NVIDIA At 3.5x: The Equity Comparison
NVIDIA's market cap is $5.46 trillion. Bitcoin's is $1.56 trillion.
NVIDIA, a single company exposed to competitive risk, supply chain dynamics, regulatory pressure, and the cyclical nature of semiconductor demand, is currently valued at 3.5x the entire Bitcoin monetary network.
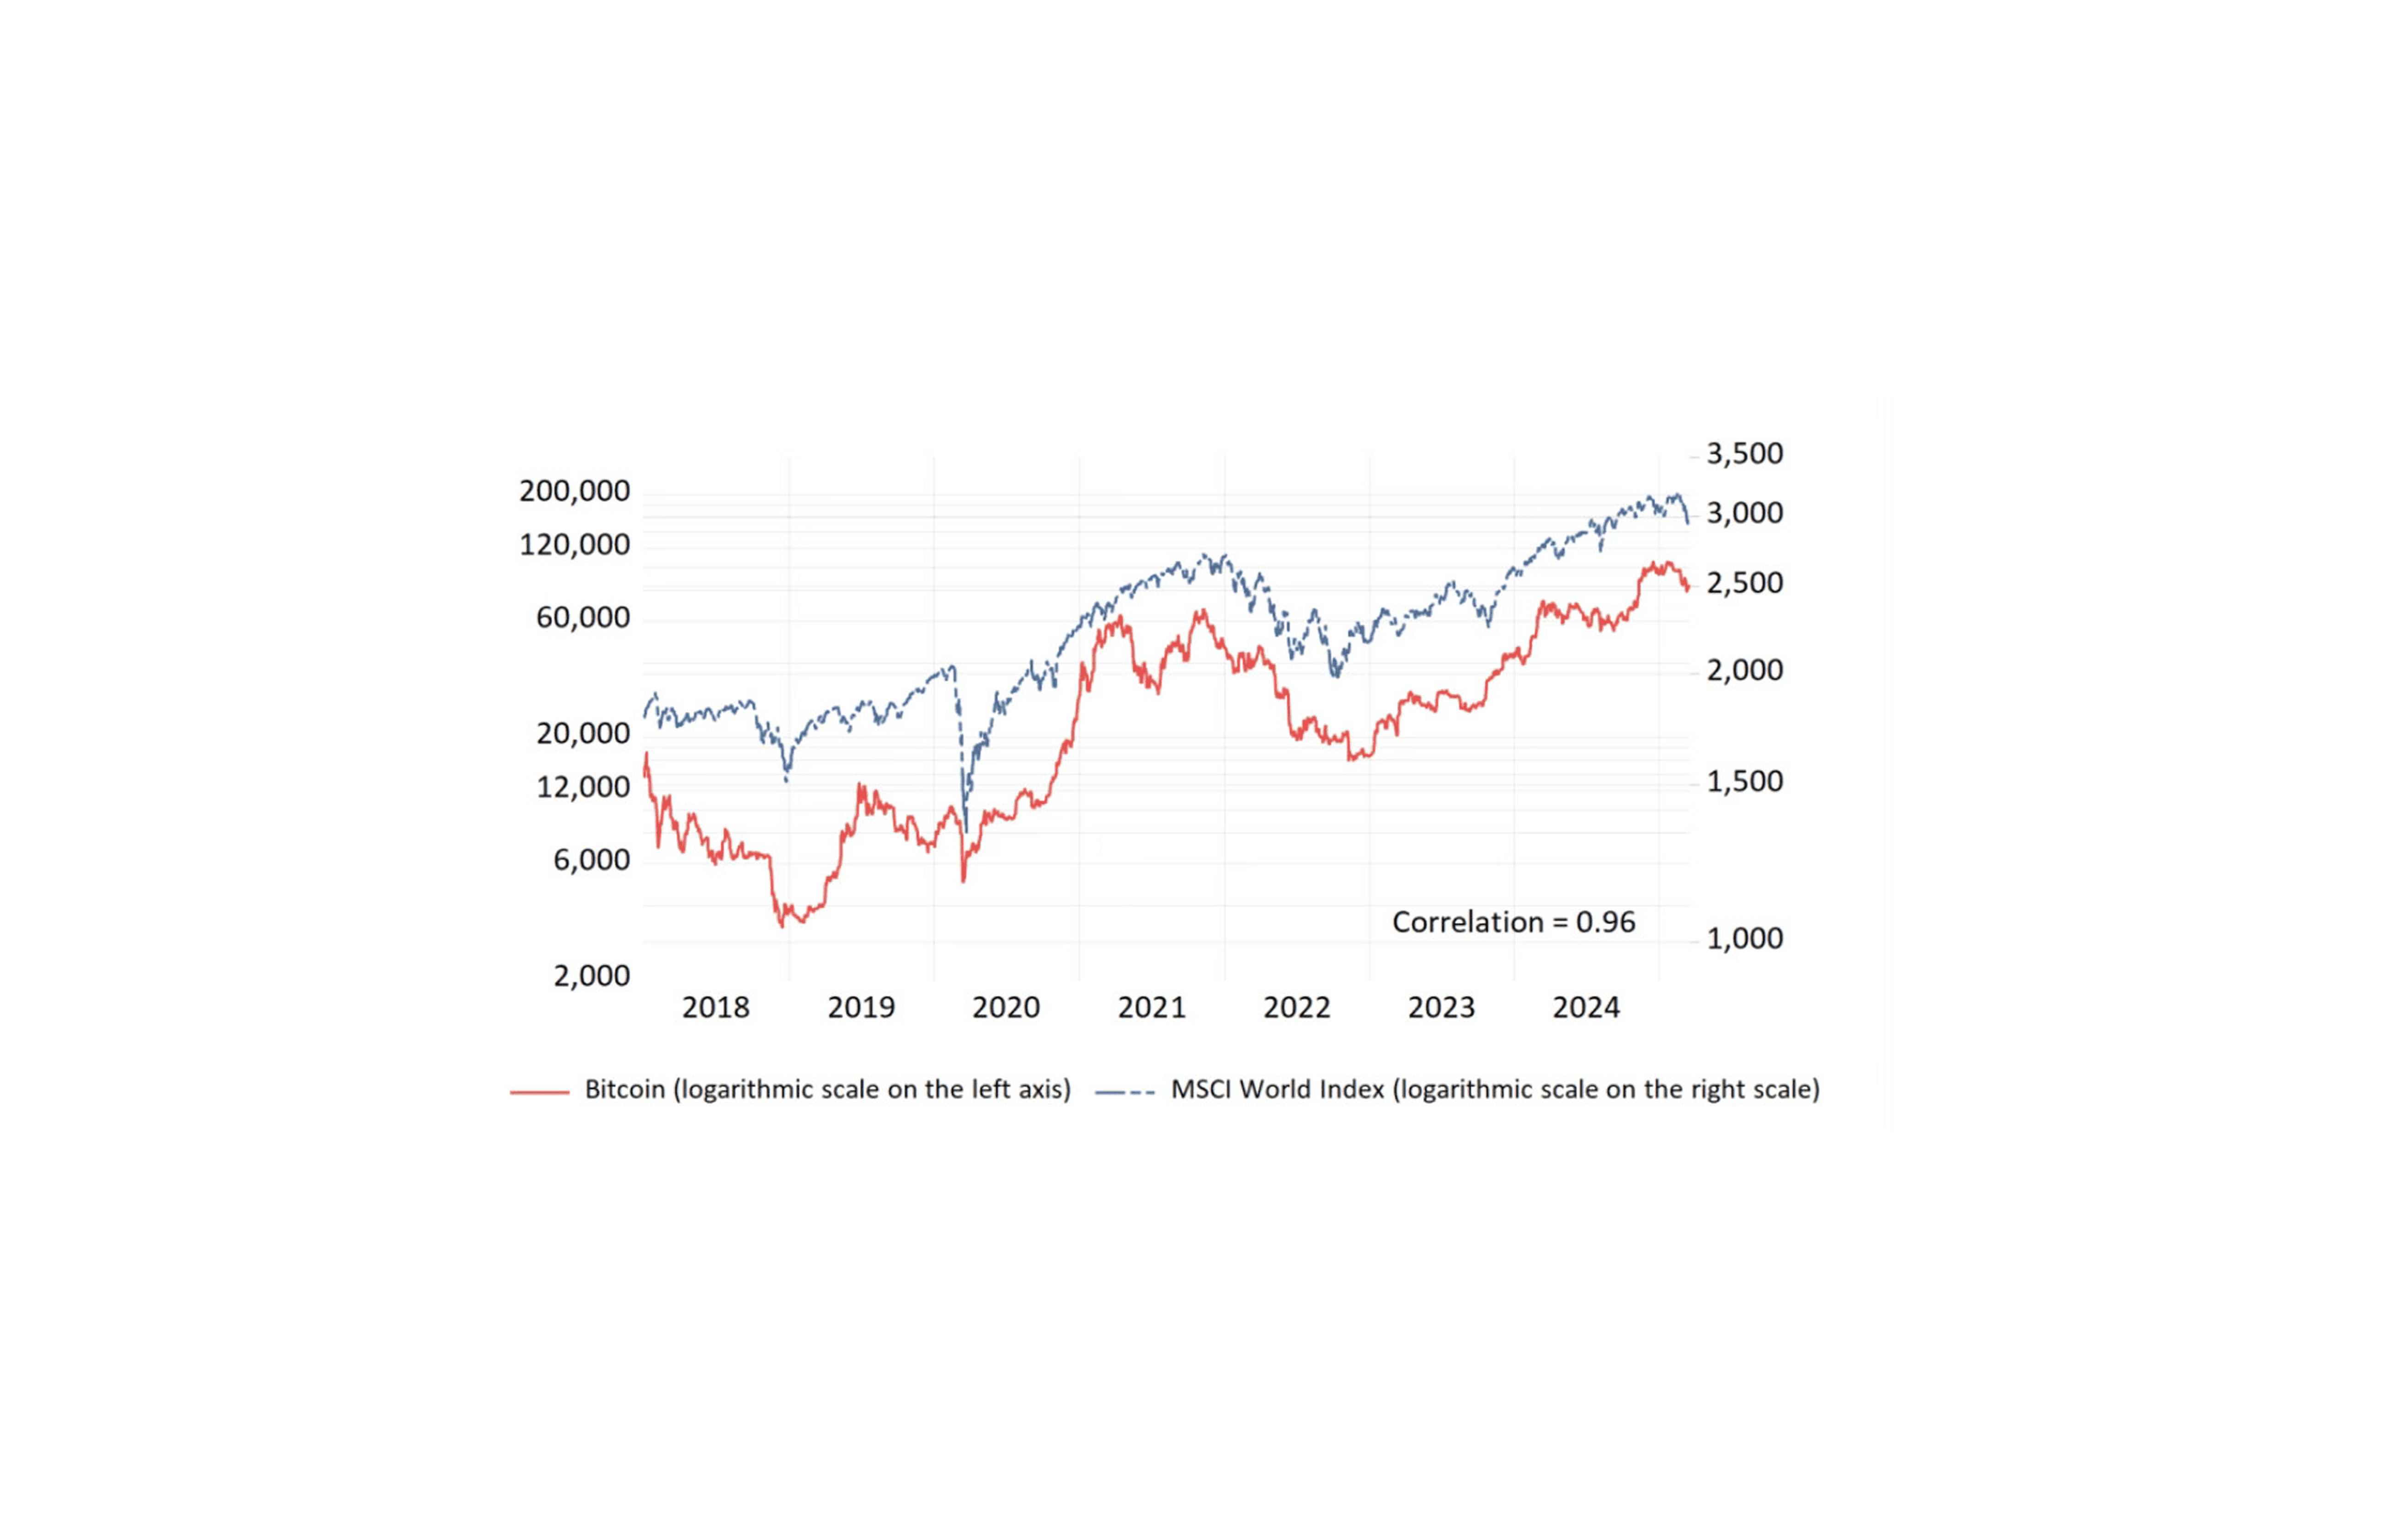
A 2025 study by Marti and Reimat found that Bitcoin tracks global equities more closely than most investors assume and that a 1% rise in the MSCI World Index produces a 4.8% rise in Bitcoin over one year. The two assets move together. The question the ruler asks is which one you are paying more for.
The fixed denominator removes one moving variable from the valuation framework.
Housing In Bitcoin: The Reframe That Hits Hardest
US residential real estate is valued at $107.97 trillion in 2026. Divide that by Bitcoin's hard cap of 21 million coins and one Bitcoin represents $5.14 million worth of American housing.
That is not the price of a house. It is the cost of a proportional claim on the entire US residential market, measured through Bitcoin's fixed supply.
Think of it this way. If the whole of American housing was divided into exactly 21 million equal shares, one share would cost $5.14 million. Bitcoin is priced at $78,000. Same 21 million coins. Same calculation. But American housing prices are at 66x the current Bitcoin price.
Buying $500,000 of real estate versus $500,000 of Bitcoin measured against the same fixed supply of 21 million units:
Housing market entry: Buying into a market priced at $5.14 million per Bitcoin-equivalent unit
Bitcoin network entry: Buying into a network priced at $78,000 per unit
Utility: One you can occupy tonight. The other you cannot live inside
Denominator: Housing is priced in currencies that have expanded continuously. Bitcoin's supply has never been inflated.
The ruler tells what each one actually costs.
Is Bitcoin Too Volatile To Use As A Financial Benchmark?
Bitcoin remains volatile. That volatility is the most common argument against using it as a unit of account. The objection is fair. Bitcoin is still early in its maturation as a stable pricing unit for salaries or long-term contracts. But volatility and utility as a comparative ruler are separate questions.
Volatility in the measuring unit does not invalidate the measurement. A fixed supply does. A volatile ruler with a hard cap of 21 million units still produces a more honest comparison than an elastic ruler whose supply has expanded 3.5x in 16 years. The measurement may shift daily. The denominator never does.
People are taking larger loans, measured in an expanding currency, to buy assets priced in a ruler that keeps stretching. Bitcoin does not make the house cheaper. It shows you what the house actually costs.
Gold traded at $18.93 per ounce for most of the period between 1833 and 1914. Once freed to float in 1968 it moved from $39 to $615 within 12 years before finding its footing as a globally recognised store of value. Bitcoin is earlier in that same process, reflecting continuous price discovery inside a fixed monetary base of 21 million coins, transparent open-market repricing rather than quiet supply expansion.
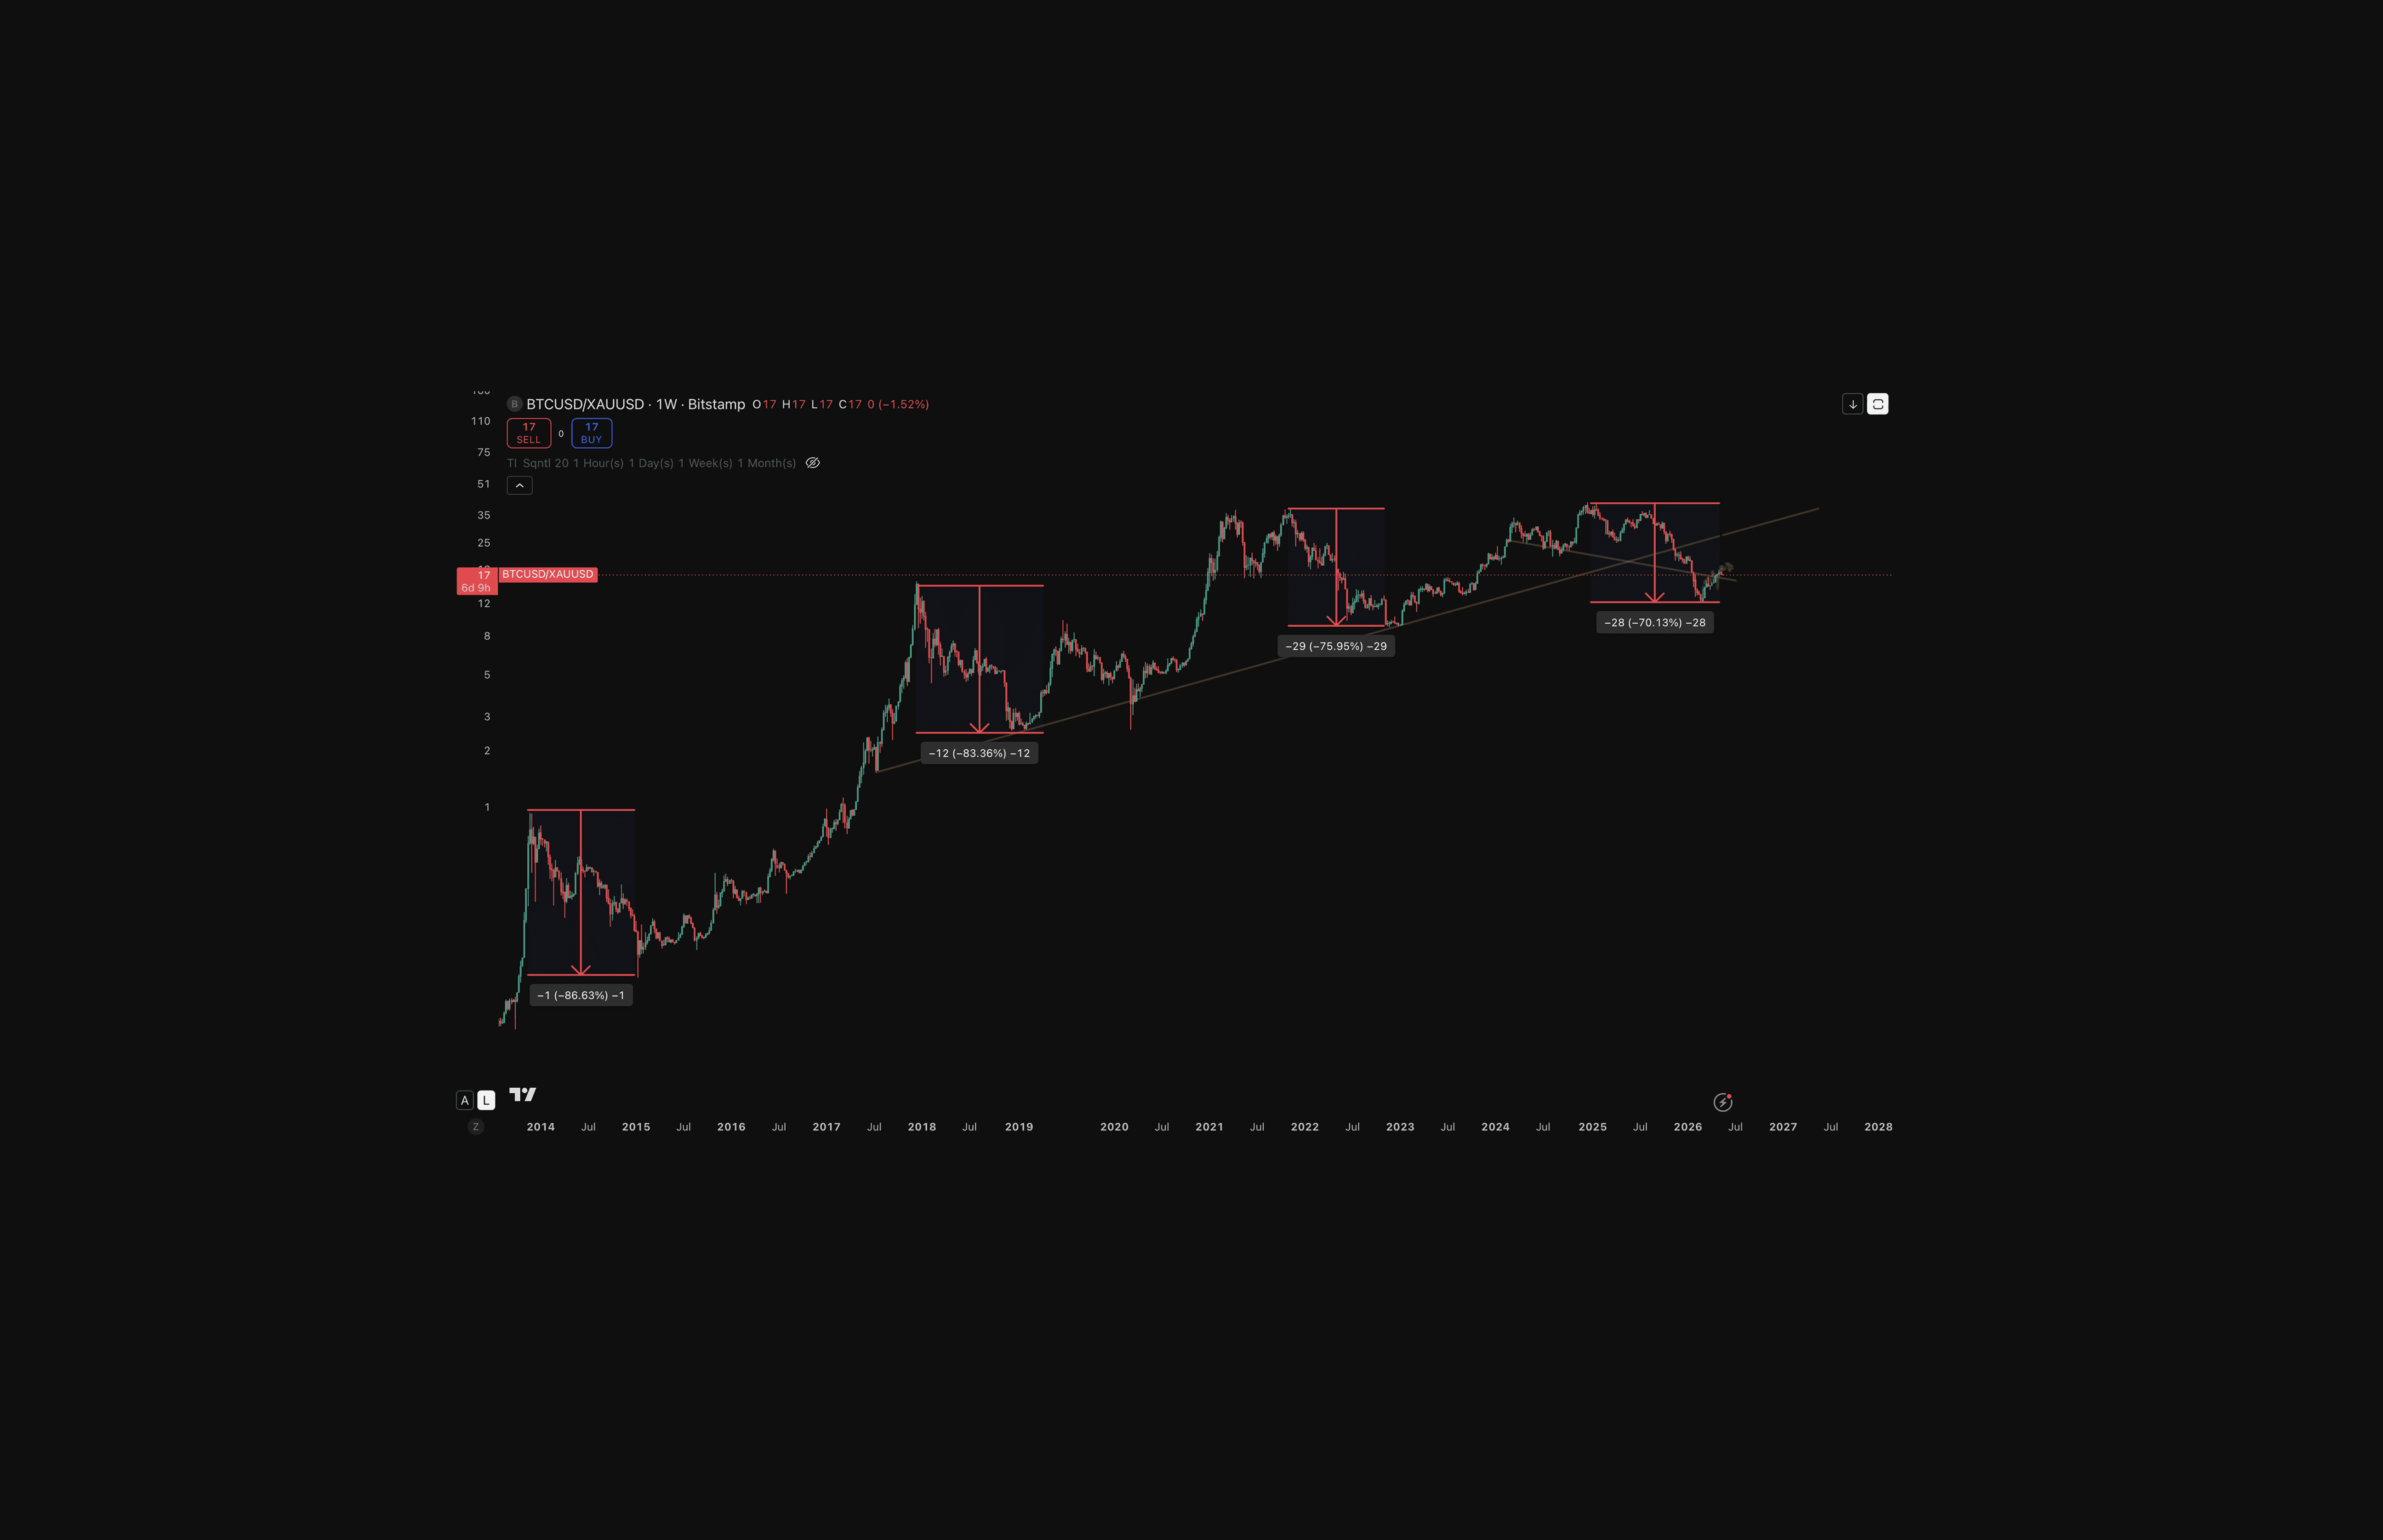
Bitcoin Bear Market Drawdowns: Five Cycles of Reducing Volatility
Measured in USD, Bitcoin's peak-to-trough drawdowns have reduced every cycle across five bear markets, from 94% in the first to 52% in the fifth.
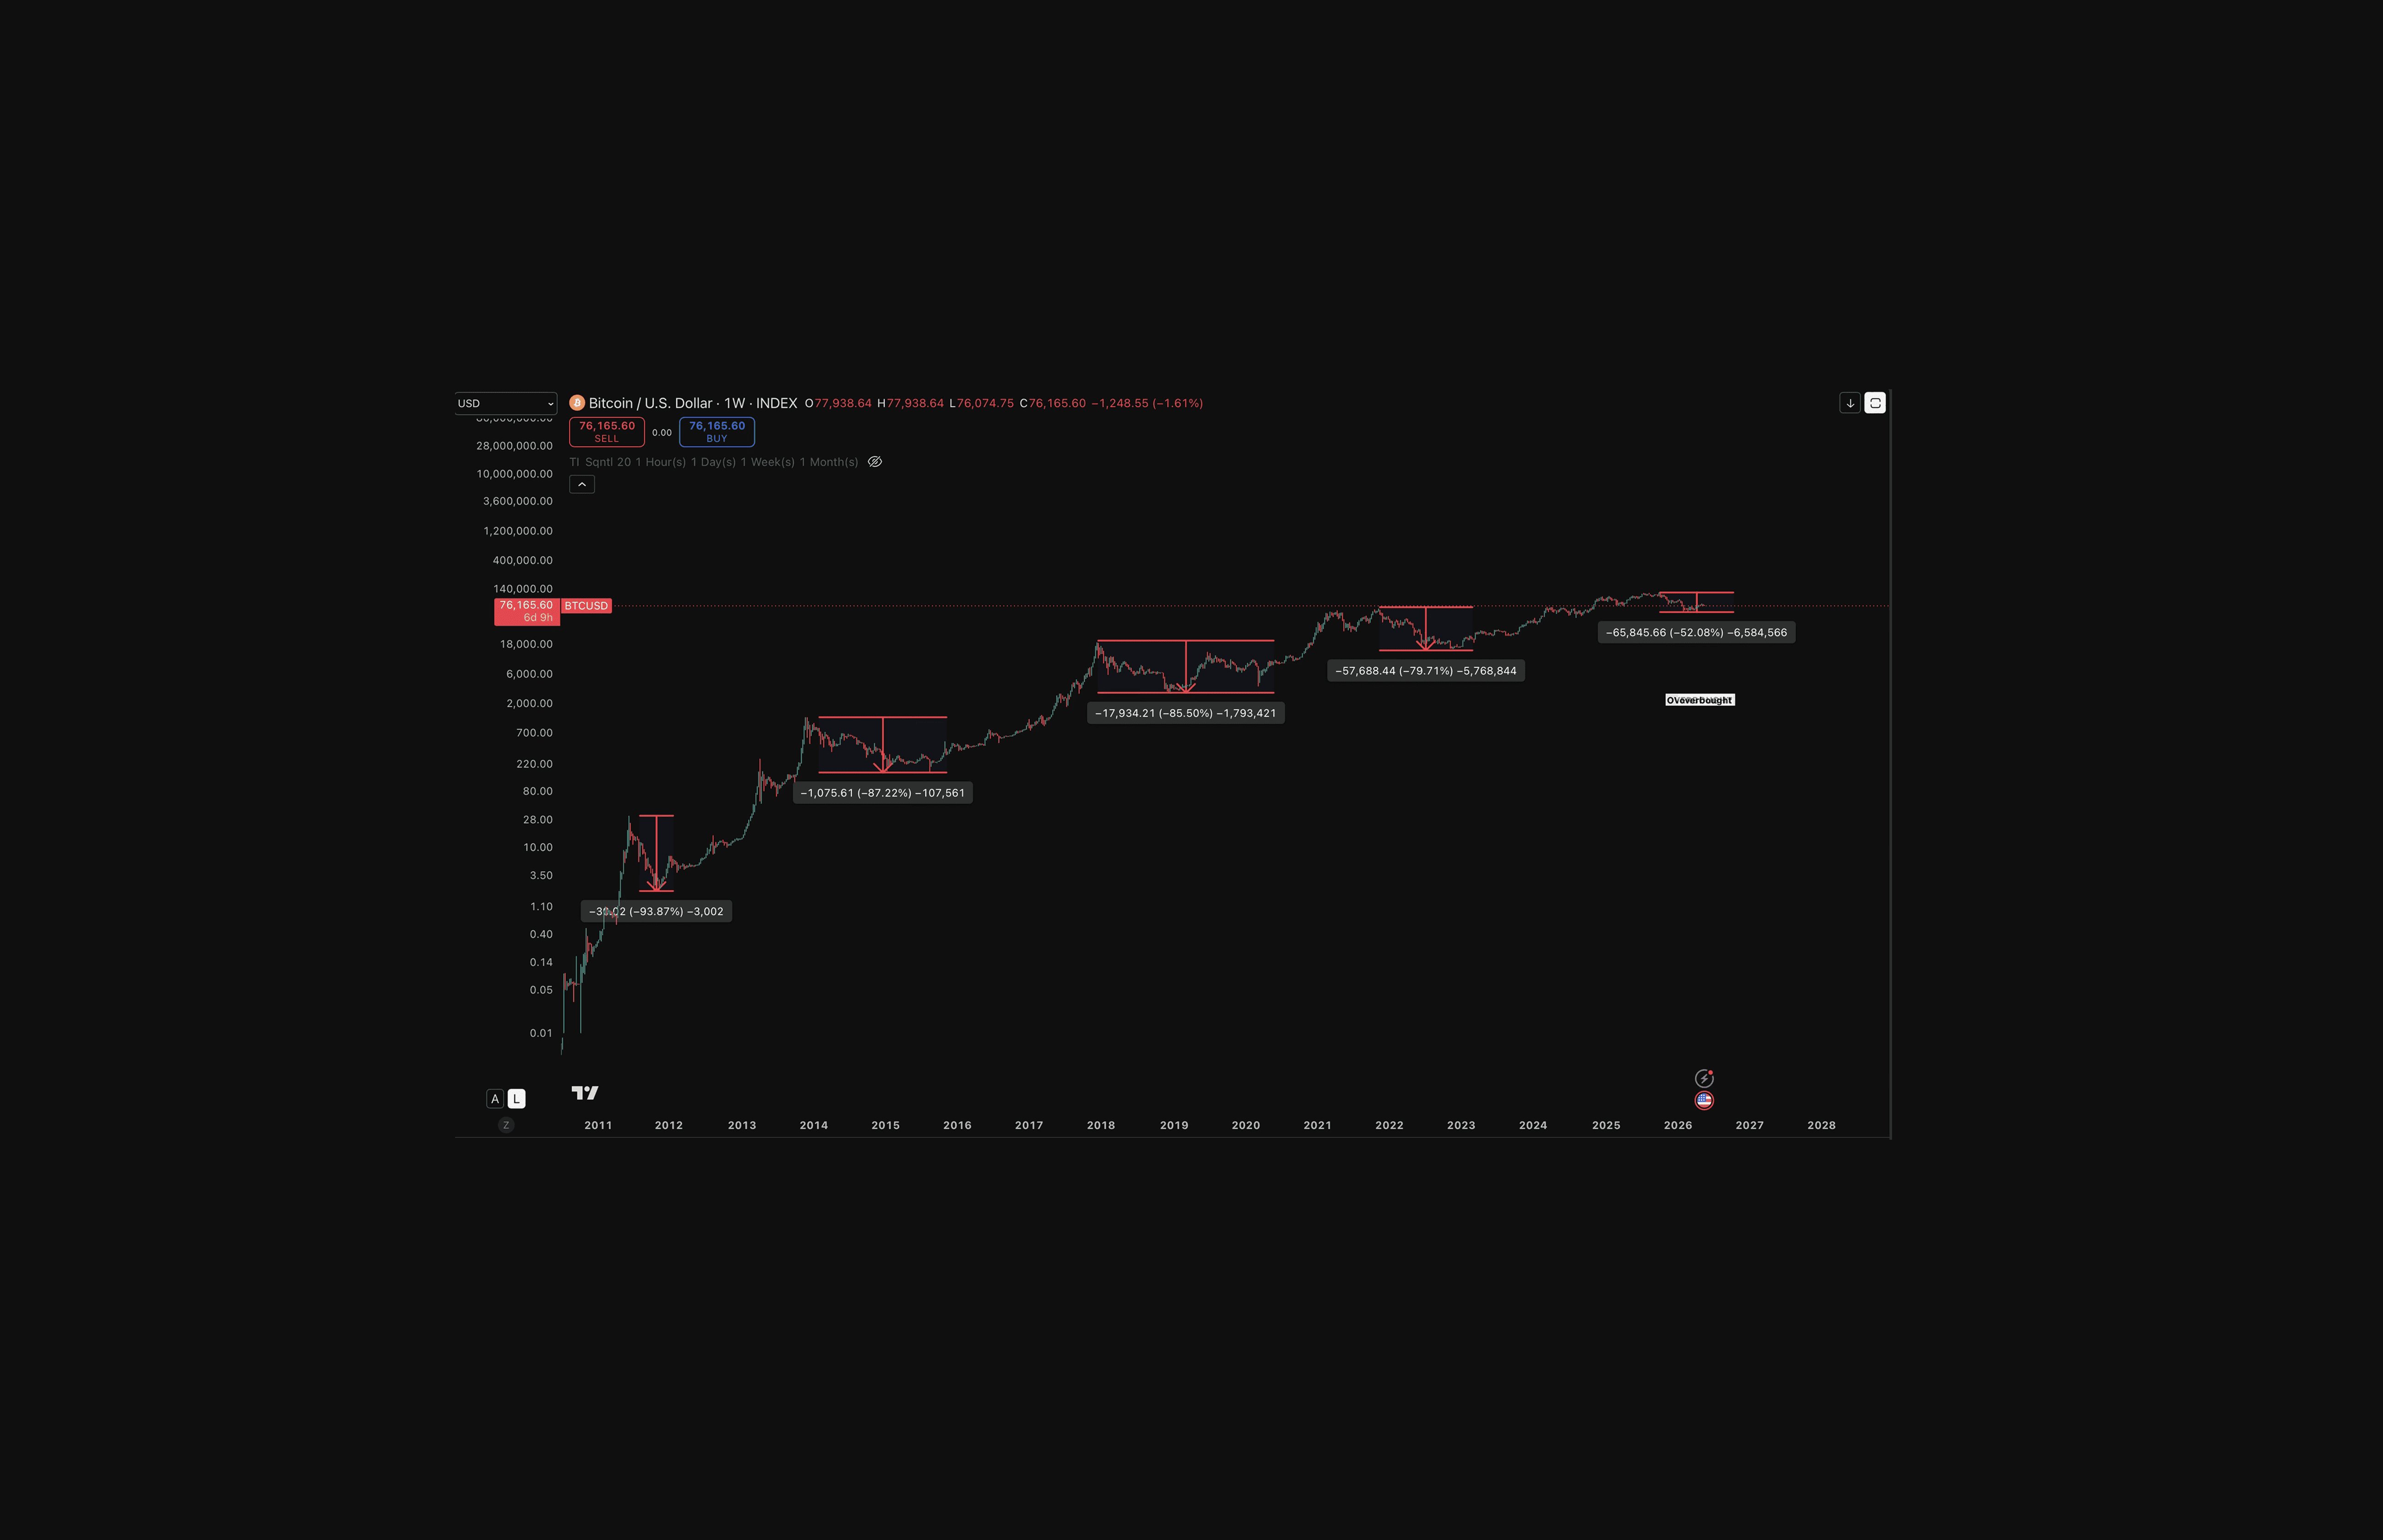
Measured against gold, the same pattern holds, from 87% to 70%. Each cycle Bitcoin loses less ground against both the dollar and the asset it is most often compared to. As institutional participation deepens and liquidity broadens, the volatility profile may compress further. If it does, the comparisons in this article become easier to interpret, not harder.
How To Use Bitcoin To Compare Asset Valuations
The exercise is straightforward. Take any asset's market capitalisation. Divide by 21 million. That number is what one Bitcoin represents as a proportional claim on that asset's total value.
Gold: $1.50M per BTC equivalent
S&P 500: ~$2.47M per BTC equivalent
NVIDIA: $260k per BTC equivalent
Bitcoin May, 17 2026: $78k
The gap between Bitcoin's current valuation and the scale of larger global asset classes explains why many investors increasingly use Bitcoin as a comparative monetary benchmark.
The fixed supply holds. The ruler stays straight. Everything else gets measured against it and the measurement tells you something the dollar-denominated price never could, which asset has more room relative to where it currently sits on the same fixed scale.
When you understand Bitcoin as the unit of account, the next question is when to accumulate. That is what the base structure eBook at coinjuice.com answers.
Conclusion
Bitcoin does not change what assets are worth. It changes what you measure them against. And when the ruler is fixed, the gaps become visible.
CoinJuice covers Bitcoin-first research, on-chain analysis, and market structure. Explore the Research Hub for deeper analysis.
FAQ
How do you price assets in Bitcoin using its fixed supply?
Take any asset’s total market capitalization and divide it by Bitcoin’s hard cap of 21 million coins. The result is what one Bitcoin would represent as a proportional claim on that asset’s total value. This uses Bitcoin’s fixed supply as the denominator, turning it into a rigid measuring stick.
What is unit bias in the context of Bitcoin pricing?
Unit bias is the cognitive response where the large dollar price of one Bitcoin, such as $78,000, makes it feel too expensive compared to cheaper-looking assets like individual shares of Apple or Google. This perception persists even when the underlying economics differ, and it fades when assets are compared on the same fixed Bitcoin supply.
Why is Bitcoin described as a ‘rigid ruler’ compared to the US dollar?
Bitcoin’s supply is fixed at 21 million coins with a public, unchangeable issuance schedule, so its denominator does not expand. The US dollar supply, by contrast, expands through monetary policy, as shown by US public debt growing from $11.1 trillion in 2009 to $38.5 trillion in 2025. This makes the dollar an ‘elastic ruler’ whose measuring unit keeps stretching.
What does valuing US housing in Bitcoin reveal?
US residential real estate is valued at $107.97 trillion in 2026. Divided by 21 million, one Bitcoin represents $5.14 million worth of American housing, while Bitcoin trades at $78,000. This means US housing is priced at about 66 times Bitcoin’s current unit price. The comparison highlights the relative scale of the housing market versus Bitcoin when both are measured against the same fixed supply.
Disclaimer
The information provided in this article is for informational purposes only. It is not intended to be, nor should it be construed as, financial advice. We do not make any warranties regarding the completeness, reliability, or accuracy of this information. All investments involve risk, and past performance does not guarantee future results. We recommend consulting a financial advisor before making any investment decisions.
Written by

Andrew Kamsky
Andrew Kamsky is a Bitcoin analyst. He spent a decade in traditional finance across a Big Four firm and a listed fintech bank before going deep on Bitcoin full-time.


