


Quick summary
By early 2026 Bitcoin’s circulating supply nears 20 million BTC, with fewer than 1 million coins left to be mined.
Daily issuance has fallen to roughly 450 BTC, a sharp decline from earlier eras and a key driver of increasing scarcity.
Fewer than 20,000 large addresses control over 60% of the existing Bitcoin supply.
An estimated 3–4 million BTC are likely permanently inaccessible, reducing effective circulating supply well below headline figures.
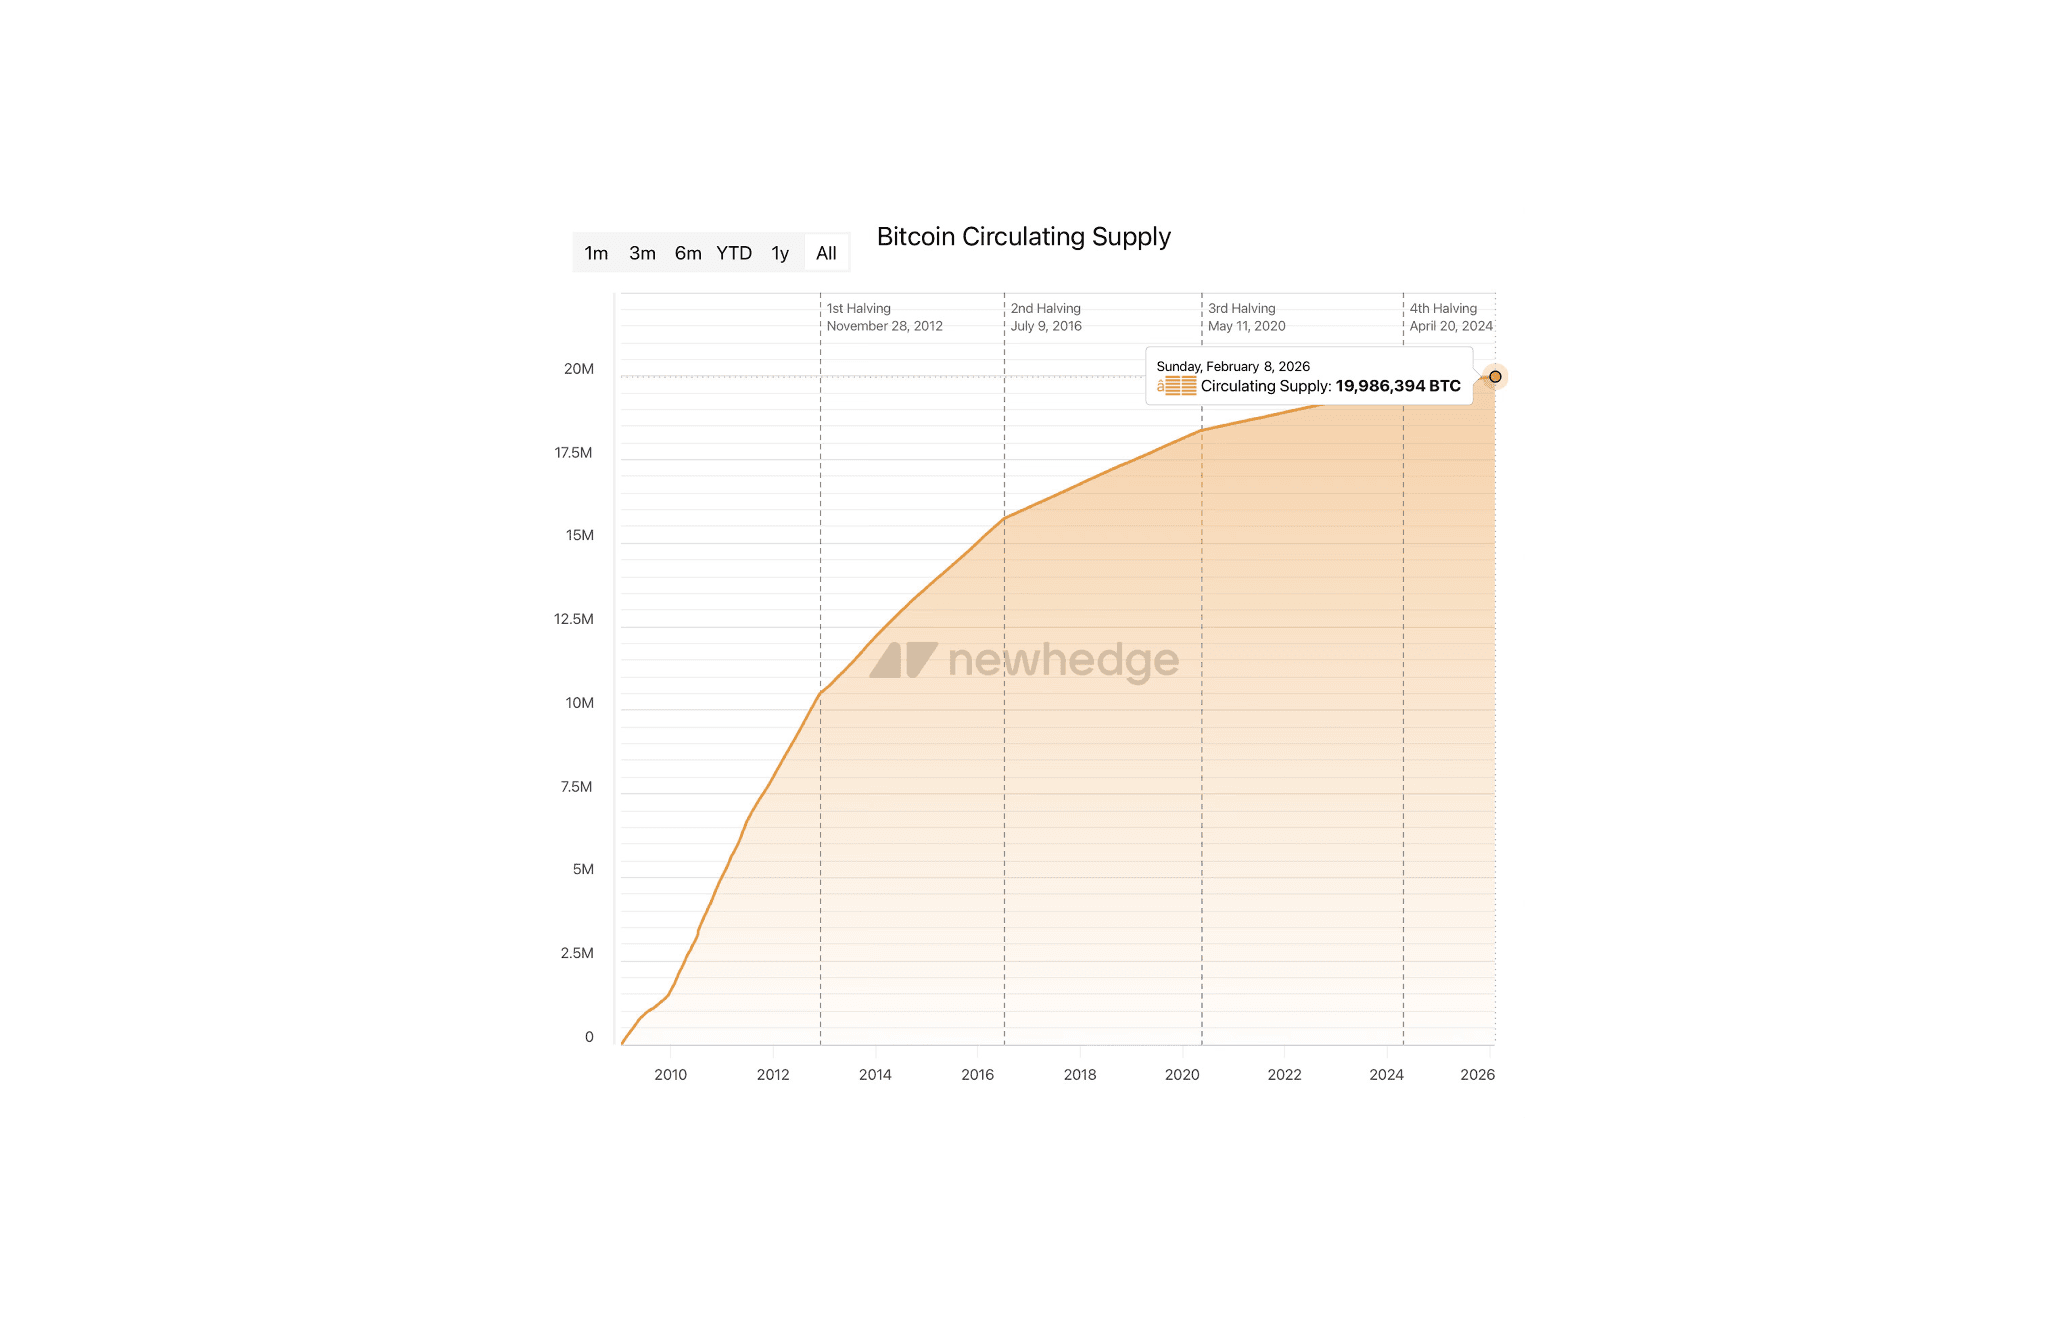
Bitcoin’s supply dynamics are entering a historically rare phase. With total circulating supply approaching 20 million BTC and fewer than 1 million bitcoins left to be mined, the network is now operating under a scarcity play unlike anything in its 17-year history.
Supply & Distribution Analysis: Bitcoin Enters Its Final Issuance Phase
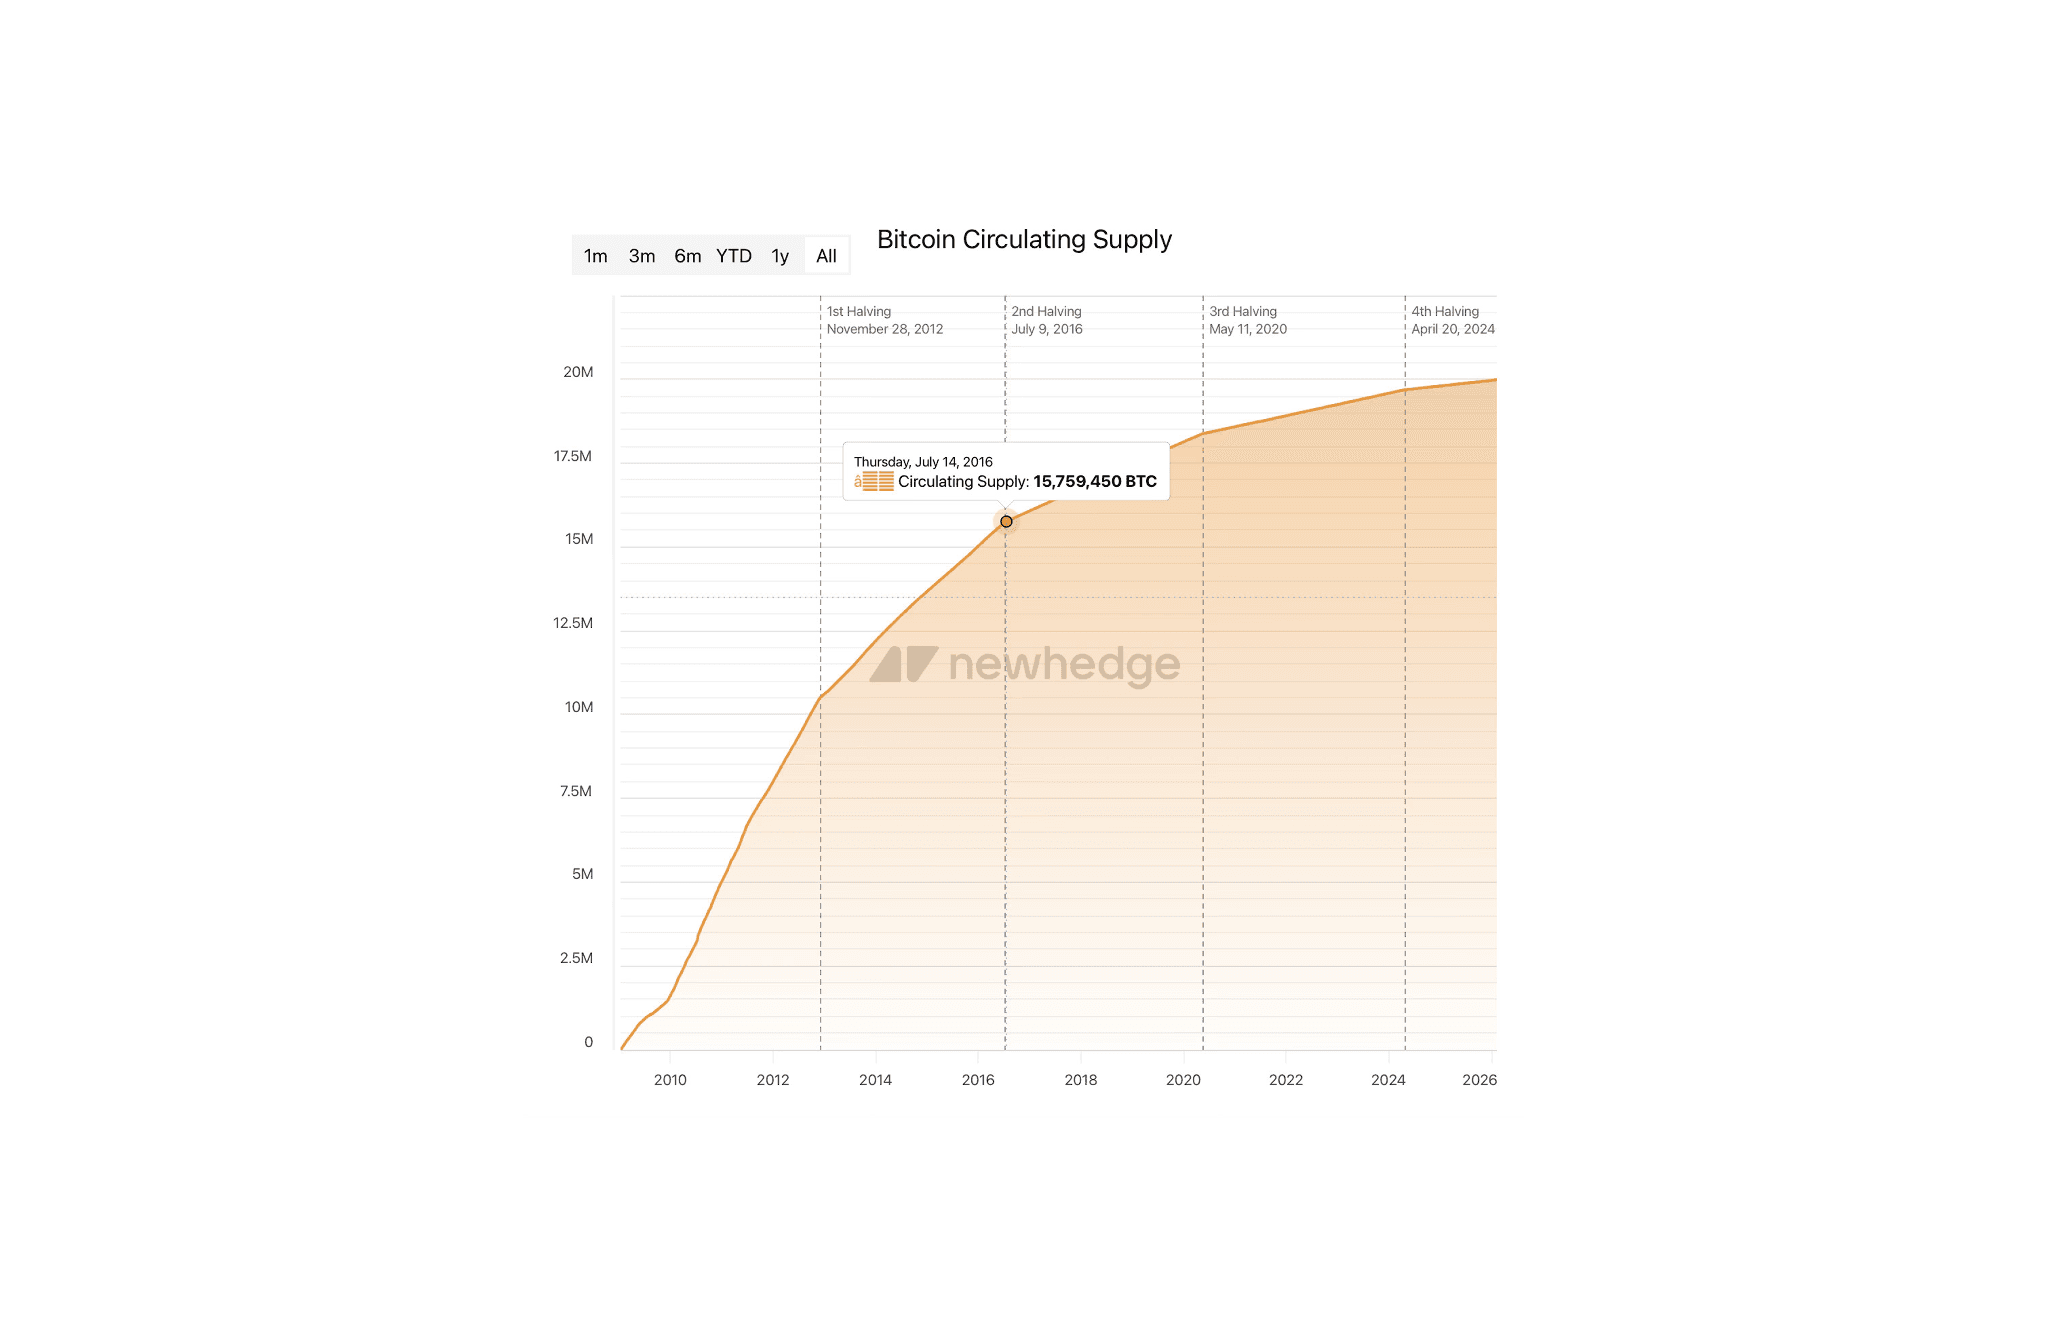
In the years leading up to January 2017, Bitcoin had several million coins left to enter circulation. Over the following years, markets absorbed newly issued coins across multiple halving cycles. By early 2026, Bitcoin stands on the edge of its final million a materially different supply backdrop, one changing issuance pressure, market absorption, and long-term scarcity dynamics at a structural level.
From Millions of BTC Remaining to only One Final Million
In January 2017, Bitcoin’s circulating supply stood at approximately 16.1 million BTC. At the time, nearly 4.9 million bitcoins were still scheduled to be mined. By February 2026, Bitcoin’s circulating supply had reached roughly 19,986,394 BTC, leaving just ~1,013,231 BTC left to be mined. With new issuance running at around 450 BTC per day, the network is weeks away from dropping below 1 million bitcoins in total remaining to be mined.
Those final coins will be distributed gradually over the next 100+ years. At the current issuance rate, Bitcoin is only weeks away from falling below 1 million BTC marking the start of its final issuance chapter. This milestone reflects a fundamental structural shift in Bitcoin’s supply dynamics, as the amount of new BTC the market must absorb is now smaller than at any point in prior cycles.
Unlike earlier eras, where halvings still released millions of coins into circulation, future issuance will be increasingly marginal.
Comparative Bitcoin Supply Absorption by Halving Era
Period | Halving Era | Supply (Start) | Supply (End) | BTC Absorbed | Daily Issuance |
Jul 2016 – May 2020 | 2nd → 3rd | ~15.8M | ~18.4M | ~2.6M | 1,800/day |
May 2020 – Apr 2024 | 3rd → 4th | ~18.4M | ~19.69M | ~1.3M | 900/day |
Apr 2024 – Feb 2026 | Post-4th | ~19.69M | ~19.99M | ~300K | 450/day |
2026 → 2140 | Final Phase | ~19.99M | 21M | ~1.01M | ↓ over time |
Between 2016 and 2024, the Bitcoin market absorbed approximately 3.9 million newly issued BTC. In contrast, the entire future issuance from 2026 onward, roughly 1.01 million BTC, is smaller than what the market absorbed in any single prior halving cycle.
Who Holds What: Bitcoin’s Concentration Problem
Scarcity alone does not tell the full story. How the existing supply is distributed across holders matters just as much, because concentrated ownership amplifies the practical effects of declining issuance.
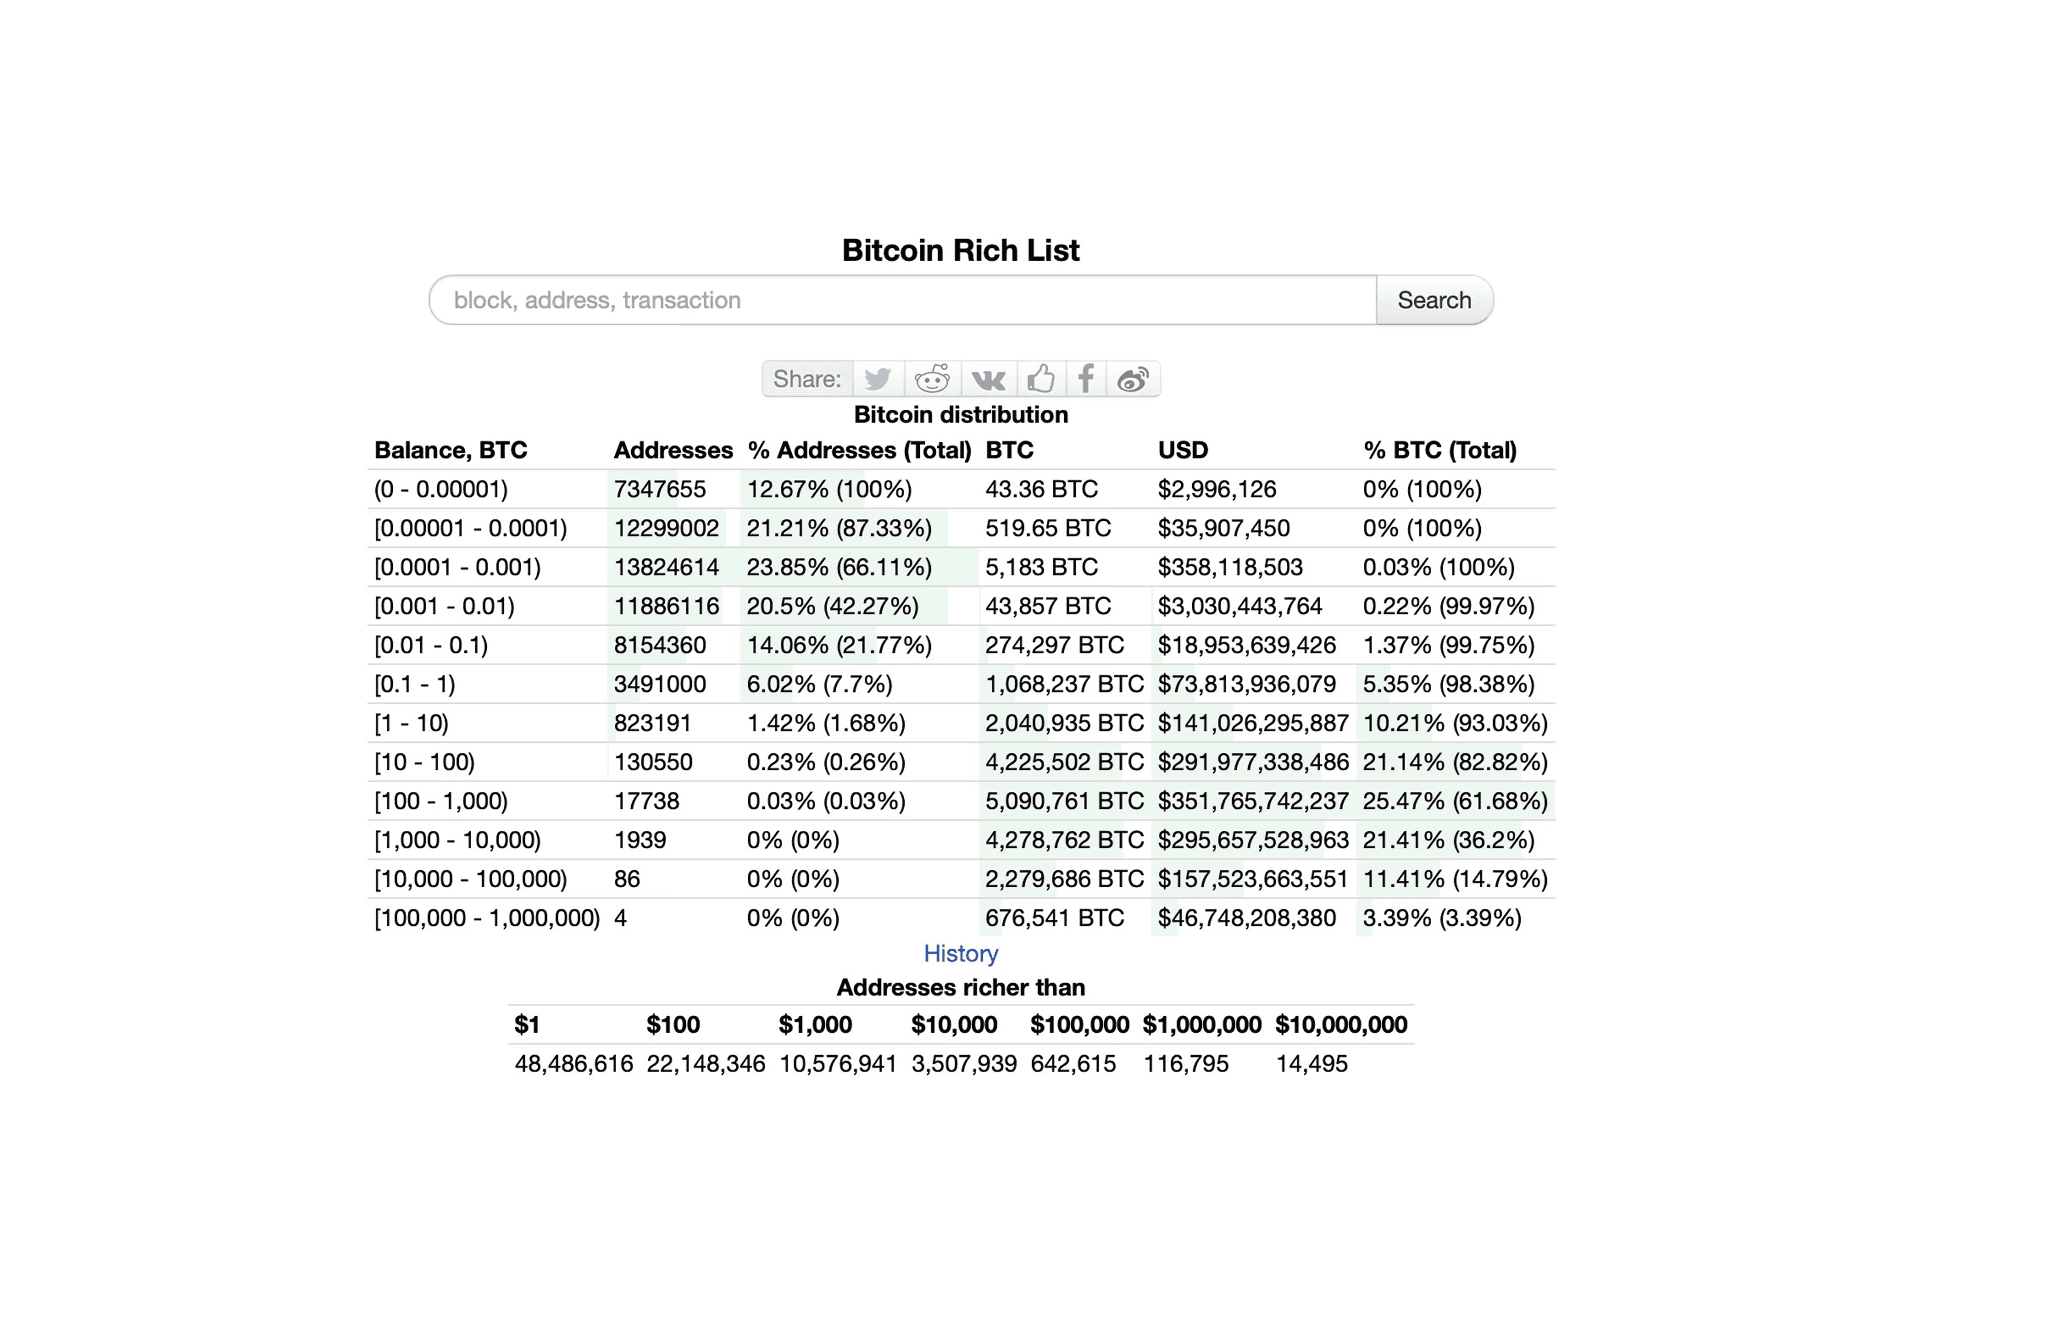
On-chain data from Bitinfocharts reveals a striking level of concentration. Just 2,029 addresses holding between 1,000 and 1,000,000 BTC each, collectively control roughly 36.2% of all Bitcoin in existence. Fewer than 20,000 addresses (those holding 100 BTC or more) account for over 61% of total supply.
Meanwhile, the vast majority of addresses, over 56 million of the network’s 57.9 million, hold less than 1 BTC and together represent under 7% of circulating supply.
Bitcoin Address Distribution by Balance Range
Balance Range (BTC) | Addresses | % of Addresses | Total BTC Held | USD Value | % of Supply |
100,000 – 1,000,000 | 4 | ~0% | 676,541 | $46.9B | 3.39% |
10,000 – 100,000 | 86 | ~0% | 2,273,476 | $157.6B | 11.38% |
1,000 – 10,000 | 1,948 | ~0% | 4,292,824 | $297.7B | 21.48% |
100 – 1,000 | 17,716 | 0.03% | 5,081,385 | $352.4B | 25.43% |
10 – 100 | 130,582 | 0.23% | 4,226,616 | $293.1B | 21.15% |
1 – 10 | 823,314 | 1.42% | 2,041,150 | $141.5B | 10.21% |
< 1 | 56,970,091 | 98.32% | 1,394,482 | $96.5B | 6.97% |
The interaction between supply scarcity and concentration is worth examining closely. When a small number of addresses control a disproportionate share of an asset whose new issuance is approaching zero, any movement by large holders carries outsized influence on available liquidity. A single address in the 10,000–100,000 BTC range deciding to sell, or hold, can move more Bitcoin than the entire network will produce in a month.
Put differently: the scarcity story is not just about how much Bitcoin remains to be mined. It is also about how much of the already-mined supply is practically available to the market at any given time.
Scarcity in 2026 Versus the Last Decade
From a supply perspective, Bitcoin in 2026 is not simply a later version of Bitcoin in 2017. It is categorically different. In 2017, Bitcoin still had nearly 25% of its total supply left to mine. In 2026, less than 5% remain.
Daily issuance has fallen from 1,800 BTC per day to 450 BTC per day. Future issuance can no longer meaningfully dilute existing supply, and the flattening circulating supply curve, confirms the network is approaching its asymptotic limit.
BTC Shrinking Issuance Versus Lost Coins
Layered on top of raw issuance, an estimated 3–4 million BTC are believed to be permanently lost (inaccessible wallets, lost keys, Satoshi’s dormant coins). If accurate, the functional circulating supply is closer to 16–17 million BTC, compressing effective scarcity even further than the headline numbers suggest.
However, a shrinking issuance schedule does not, by itself, guarantee higher prices. Reduced issuance only affects price if demand is sustained or growing. What the final million represents is a structural constraint: from this point forward, new supply will no longer be capable of materially increasing the amount of Bitcoin available to the market.
Conclusion
As Bitcoin approaches the milestone of fewer than 1 million BTC left to mine, the network will transition into its final issuance era. Unlike previous cycles, there are no longer millions of coins waiting to enter circulation and be absorbed by the market.
The concentration of existing supply in relatively few addresses adds another dimension where practical scarcity may be tighter than even the issuance data implies. The last decade was defined by Bitcoin growing into its scarcity. The next decade will be defined by Bitcoin operating within that scarcity-driven narrative.
FAQ
What key supply milestone is Bitcoin approaching in early 2026?
By February 2026, Bitcoin’s circulating supply is roughly 19,986,394 BTC, with about 1,013,231 BTC left to be mined. At an issuance rate of around 450 BTC per day, the network is only weeks away from having fewer than 1 million bitcoins remaining to be mined, marking the start of its final issuance chapter.
How is Bitcoin’s supply situation in 2026 structurally different from 2017?
In January 2017, circulating supply was about 16.1 million BTC with nearly 4.9 million BTC, or almost 25% of total supply, still left to mine, and daily issuance was 1,800 BTC. In 2026, less than 5% of total supply remains to be mined and daily issuance has fallen to 450 BTC, so future issuance can no longer meaningfully dilute existing supply.
How concentrated is Bitcoin ownership across addresses?
About 2,029 addresses holding between 1,000 and 1,000,000 BTC control roughly 36.25% of all Bitcoin, and fewer than 20,000 addresses with balances of 100 BTC or more account for over 61% of total supply. By contrast, over 56.9 million addresses with less than 1 BTC together hold under 7% of circulating supply.
What role do lost coins play in Bitcoin’s effective scarcity?
An estimated 3–4 million BTC are believed to be permanently lost through inaccessible wallets, lost keys, or dormant coins such as Satoshi’s. If so, the functional circulating supply is closer to 16–17 million BTC, making effective scarcity tighter than headline supply figures suggest.
Disclaimer
The information provided in this article is for informational purposes only. It is not intended to be, nor should it be construed as, financial advice. We do not make any warranties regarding the completeness, reliability, or accuracy of this information. All investments involve risk, and past performance does not guarantee future results. We recommend consulting a financial advisor before making any investment decisions.
Written by

Andrew Kamsky
Andrew Kamsky is a Bitcoin analyst. He spent a decade in traditional finance across a Big Four firm and a listed fintech bank before going deep on Bitcoin full-time.


