


Quick summary
Bitcoin’s MVRV Z-Score at 0.69 has occurred nine prior times since 2011
Six past readings near 0.69 led to higher 30-day prices, three led lower
Outcomes depended on score direction: rising or stabilising was bullish, falling was bearish
April 2026 reading is declining but supported by stronger structural backdrop than earlier bears
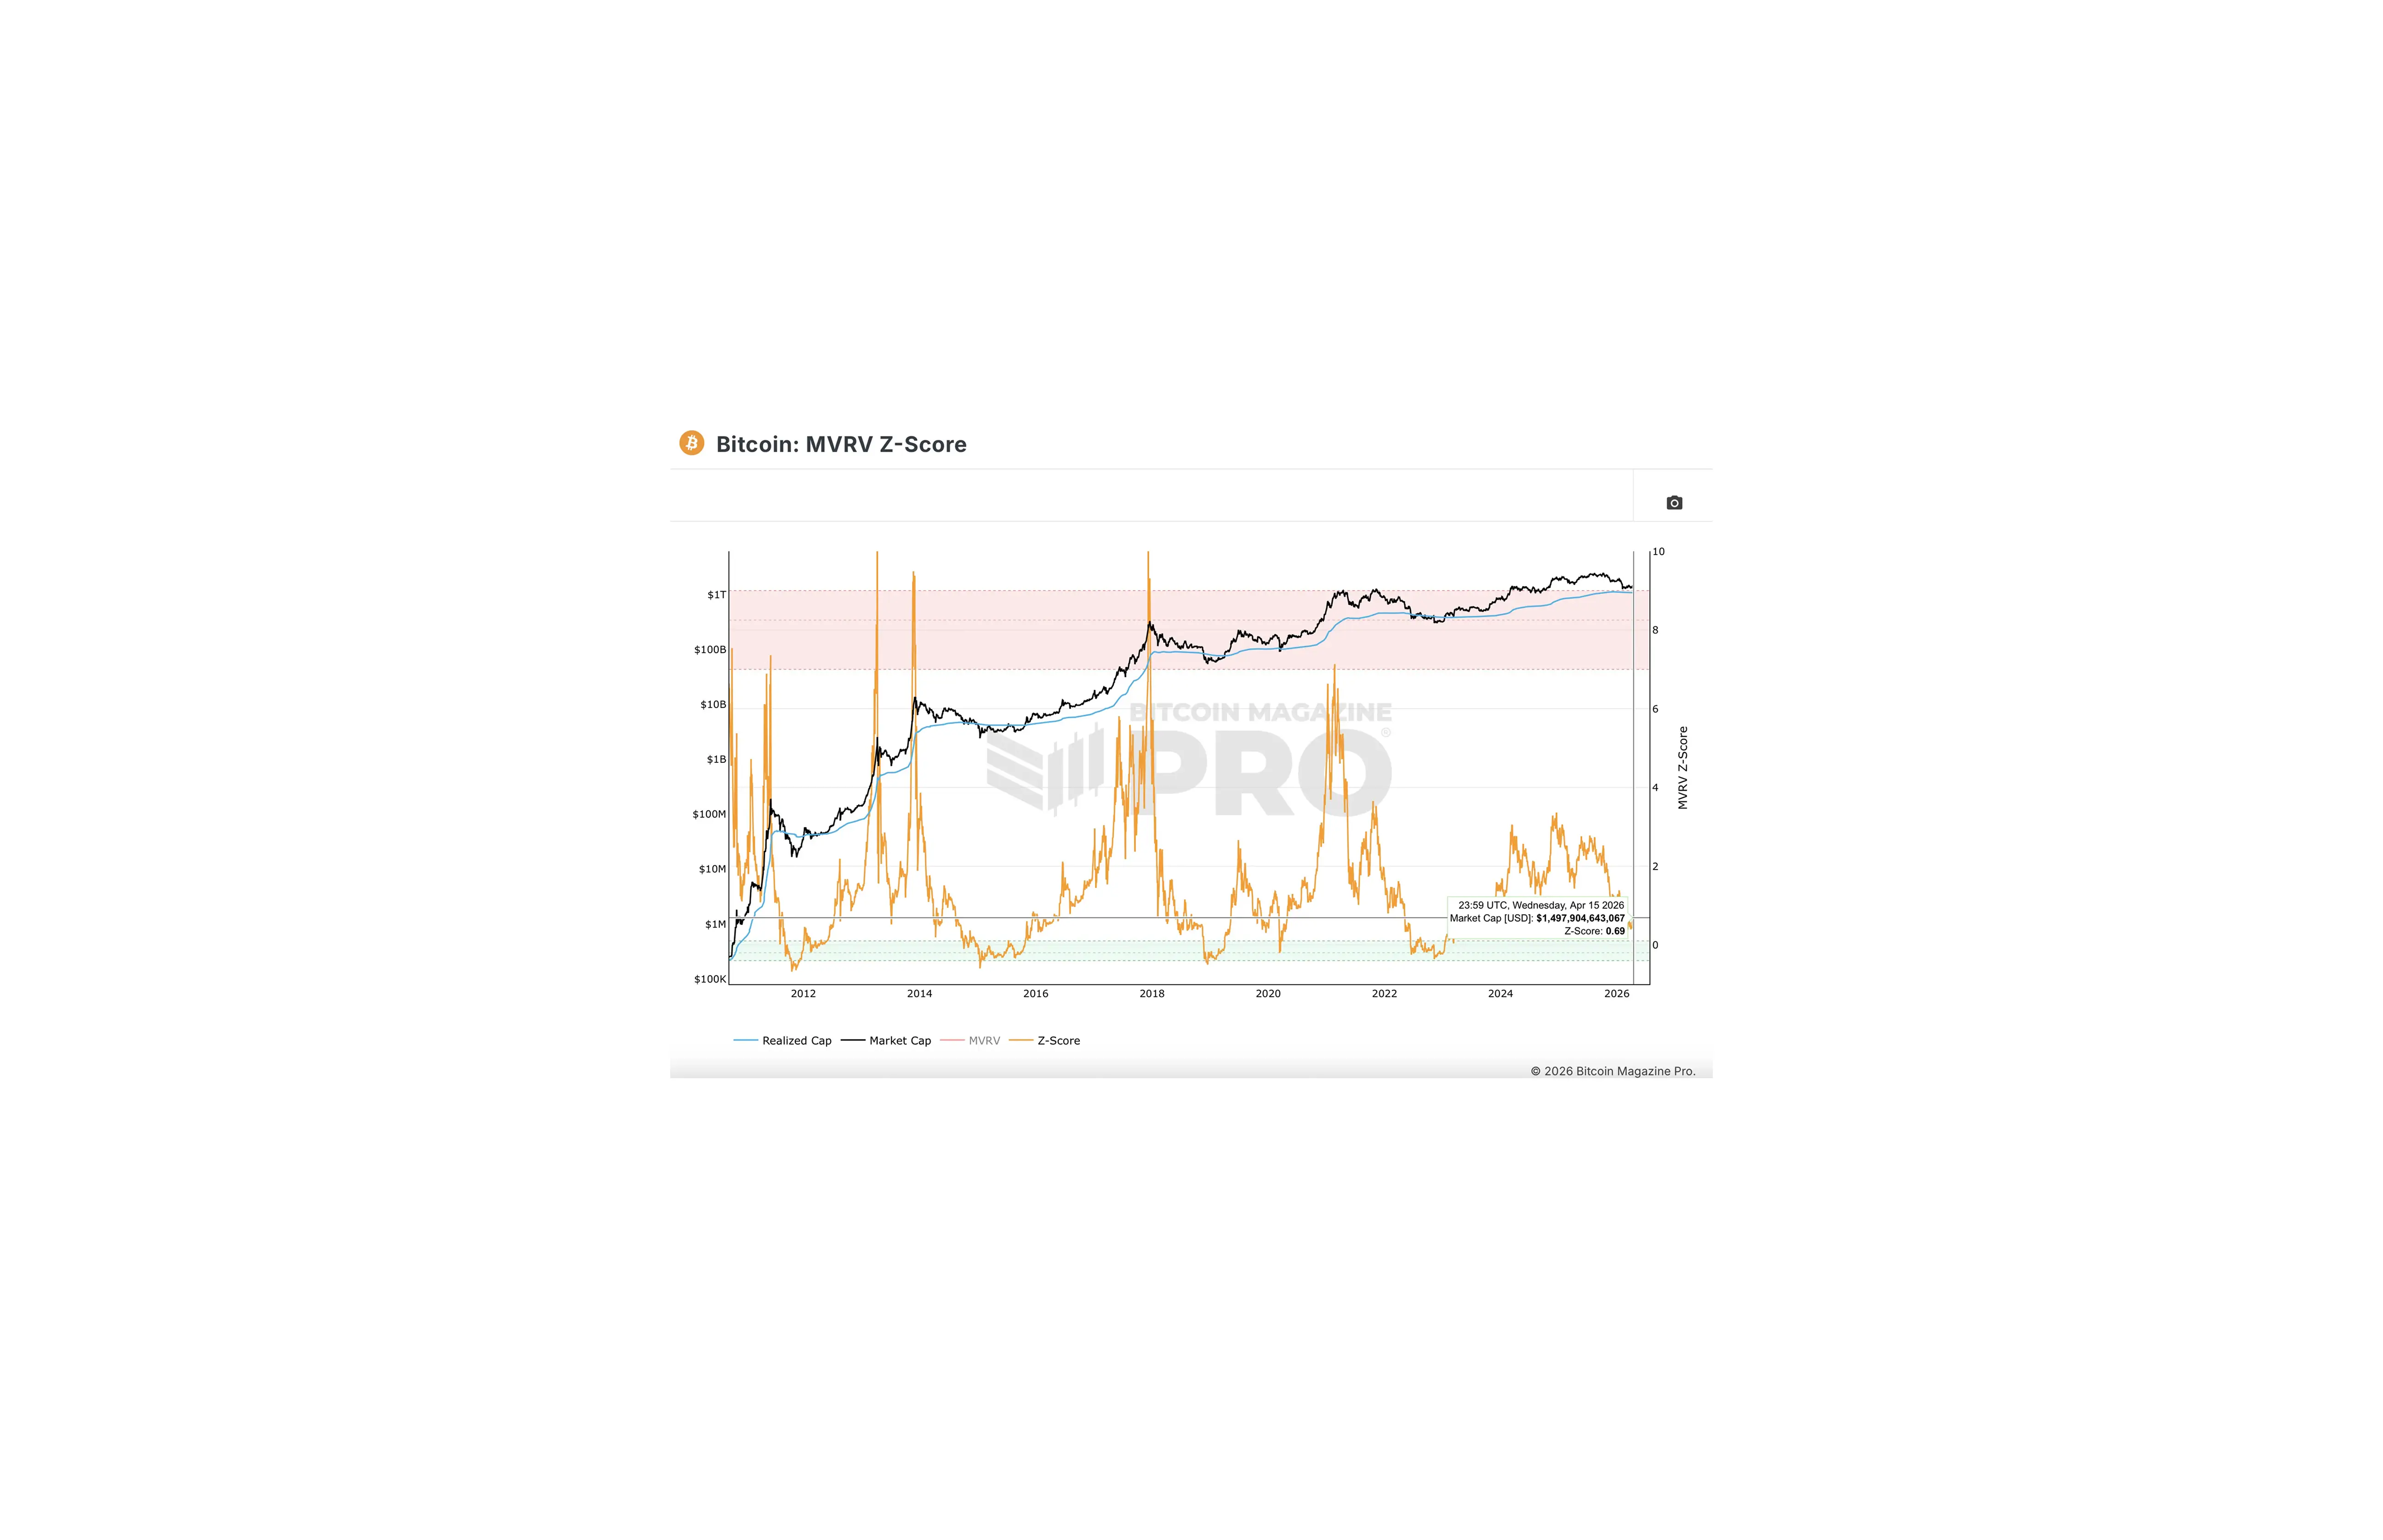
Every Bitcoin ever bought has a price tag attached to it. The MVRV Z-Score compares what the market says Bitcoin is worth today versus what everyone actually paid for it. When the score drops near zero, the market is pricing Bitcoin at roughly what holders paid and historically, that is where buyers with conviction show up.
At 0.69, recorded April 15, 2026, Bitcoin has reached a level seen approximately nine prior times since 2011. Three of nine prior instances continued lower. Six resolved higher. The level did not determine the outcome but the direction did.
Date | Z-Score | BTC Price | Score Direction | 30-Day Result |
Apr 15, 2026 | 0.69 | ~$75,000 | Declining | ? |
Oct 22, 2023 | 0.67 | ~$29,800 | Rising | +23% |
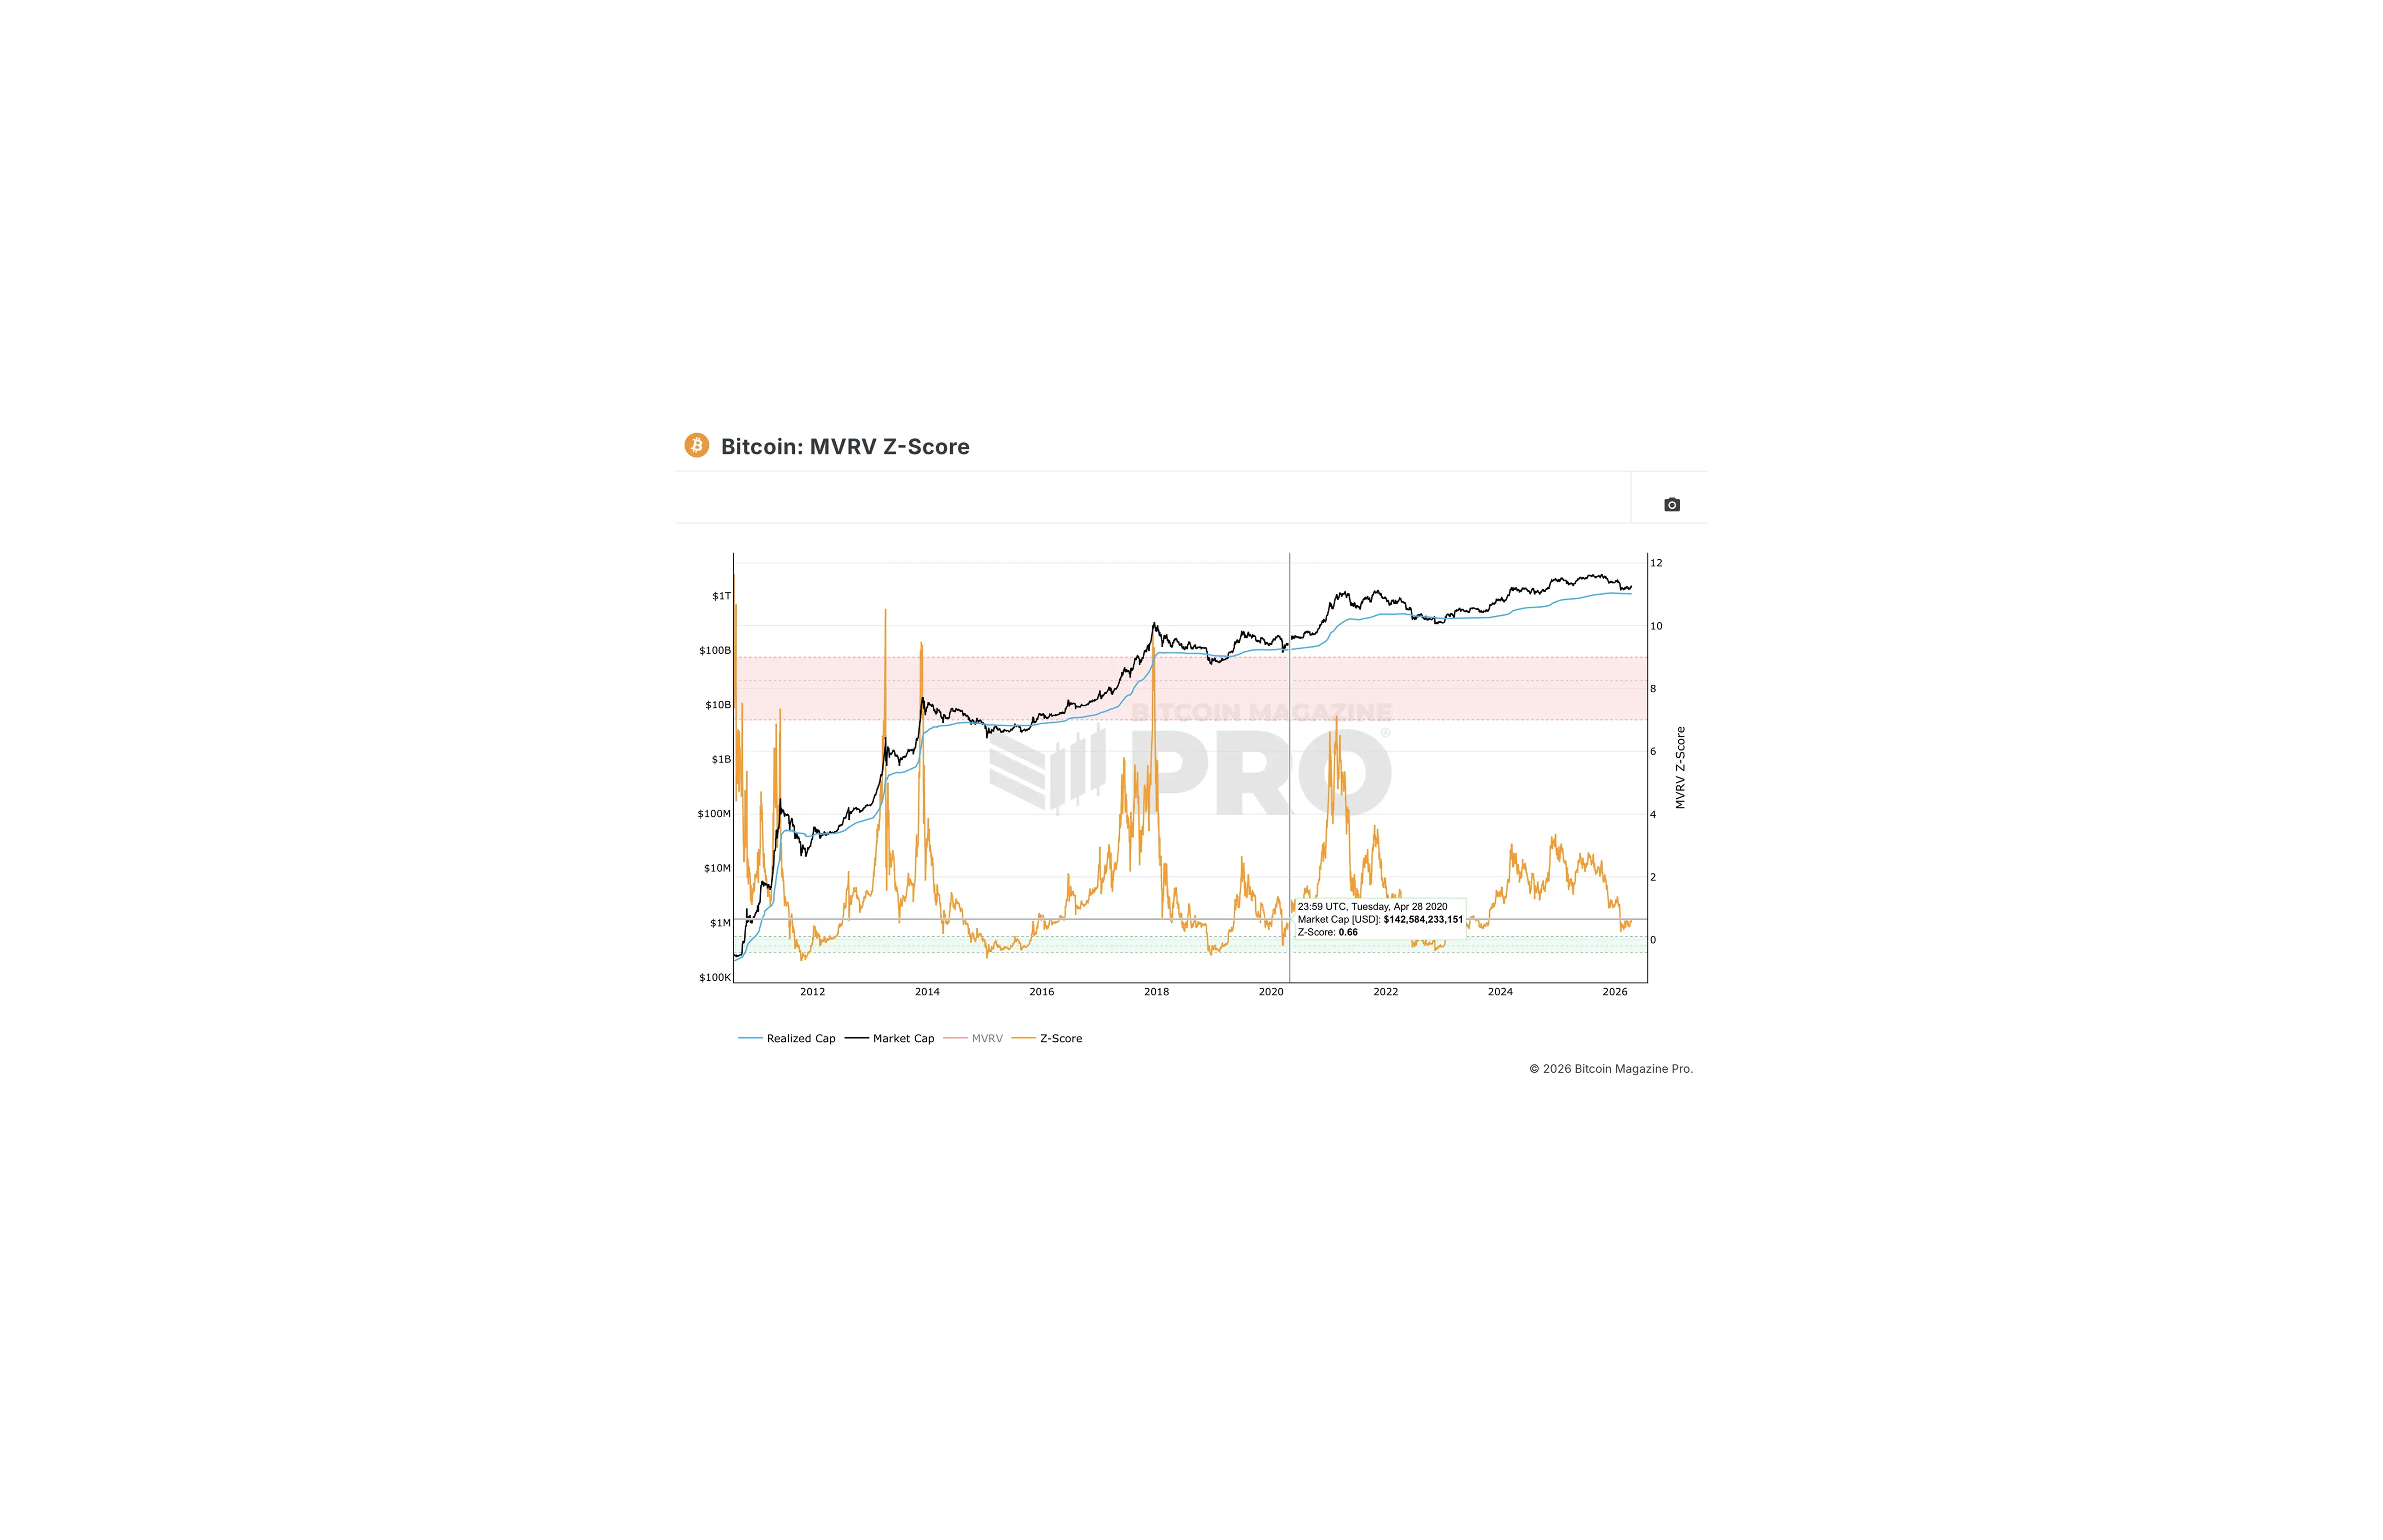
Apr 28, 2020 | 0.66 | ~$7,800 | Rising | +24% |
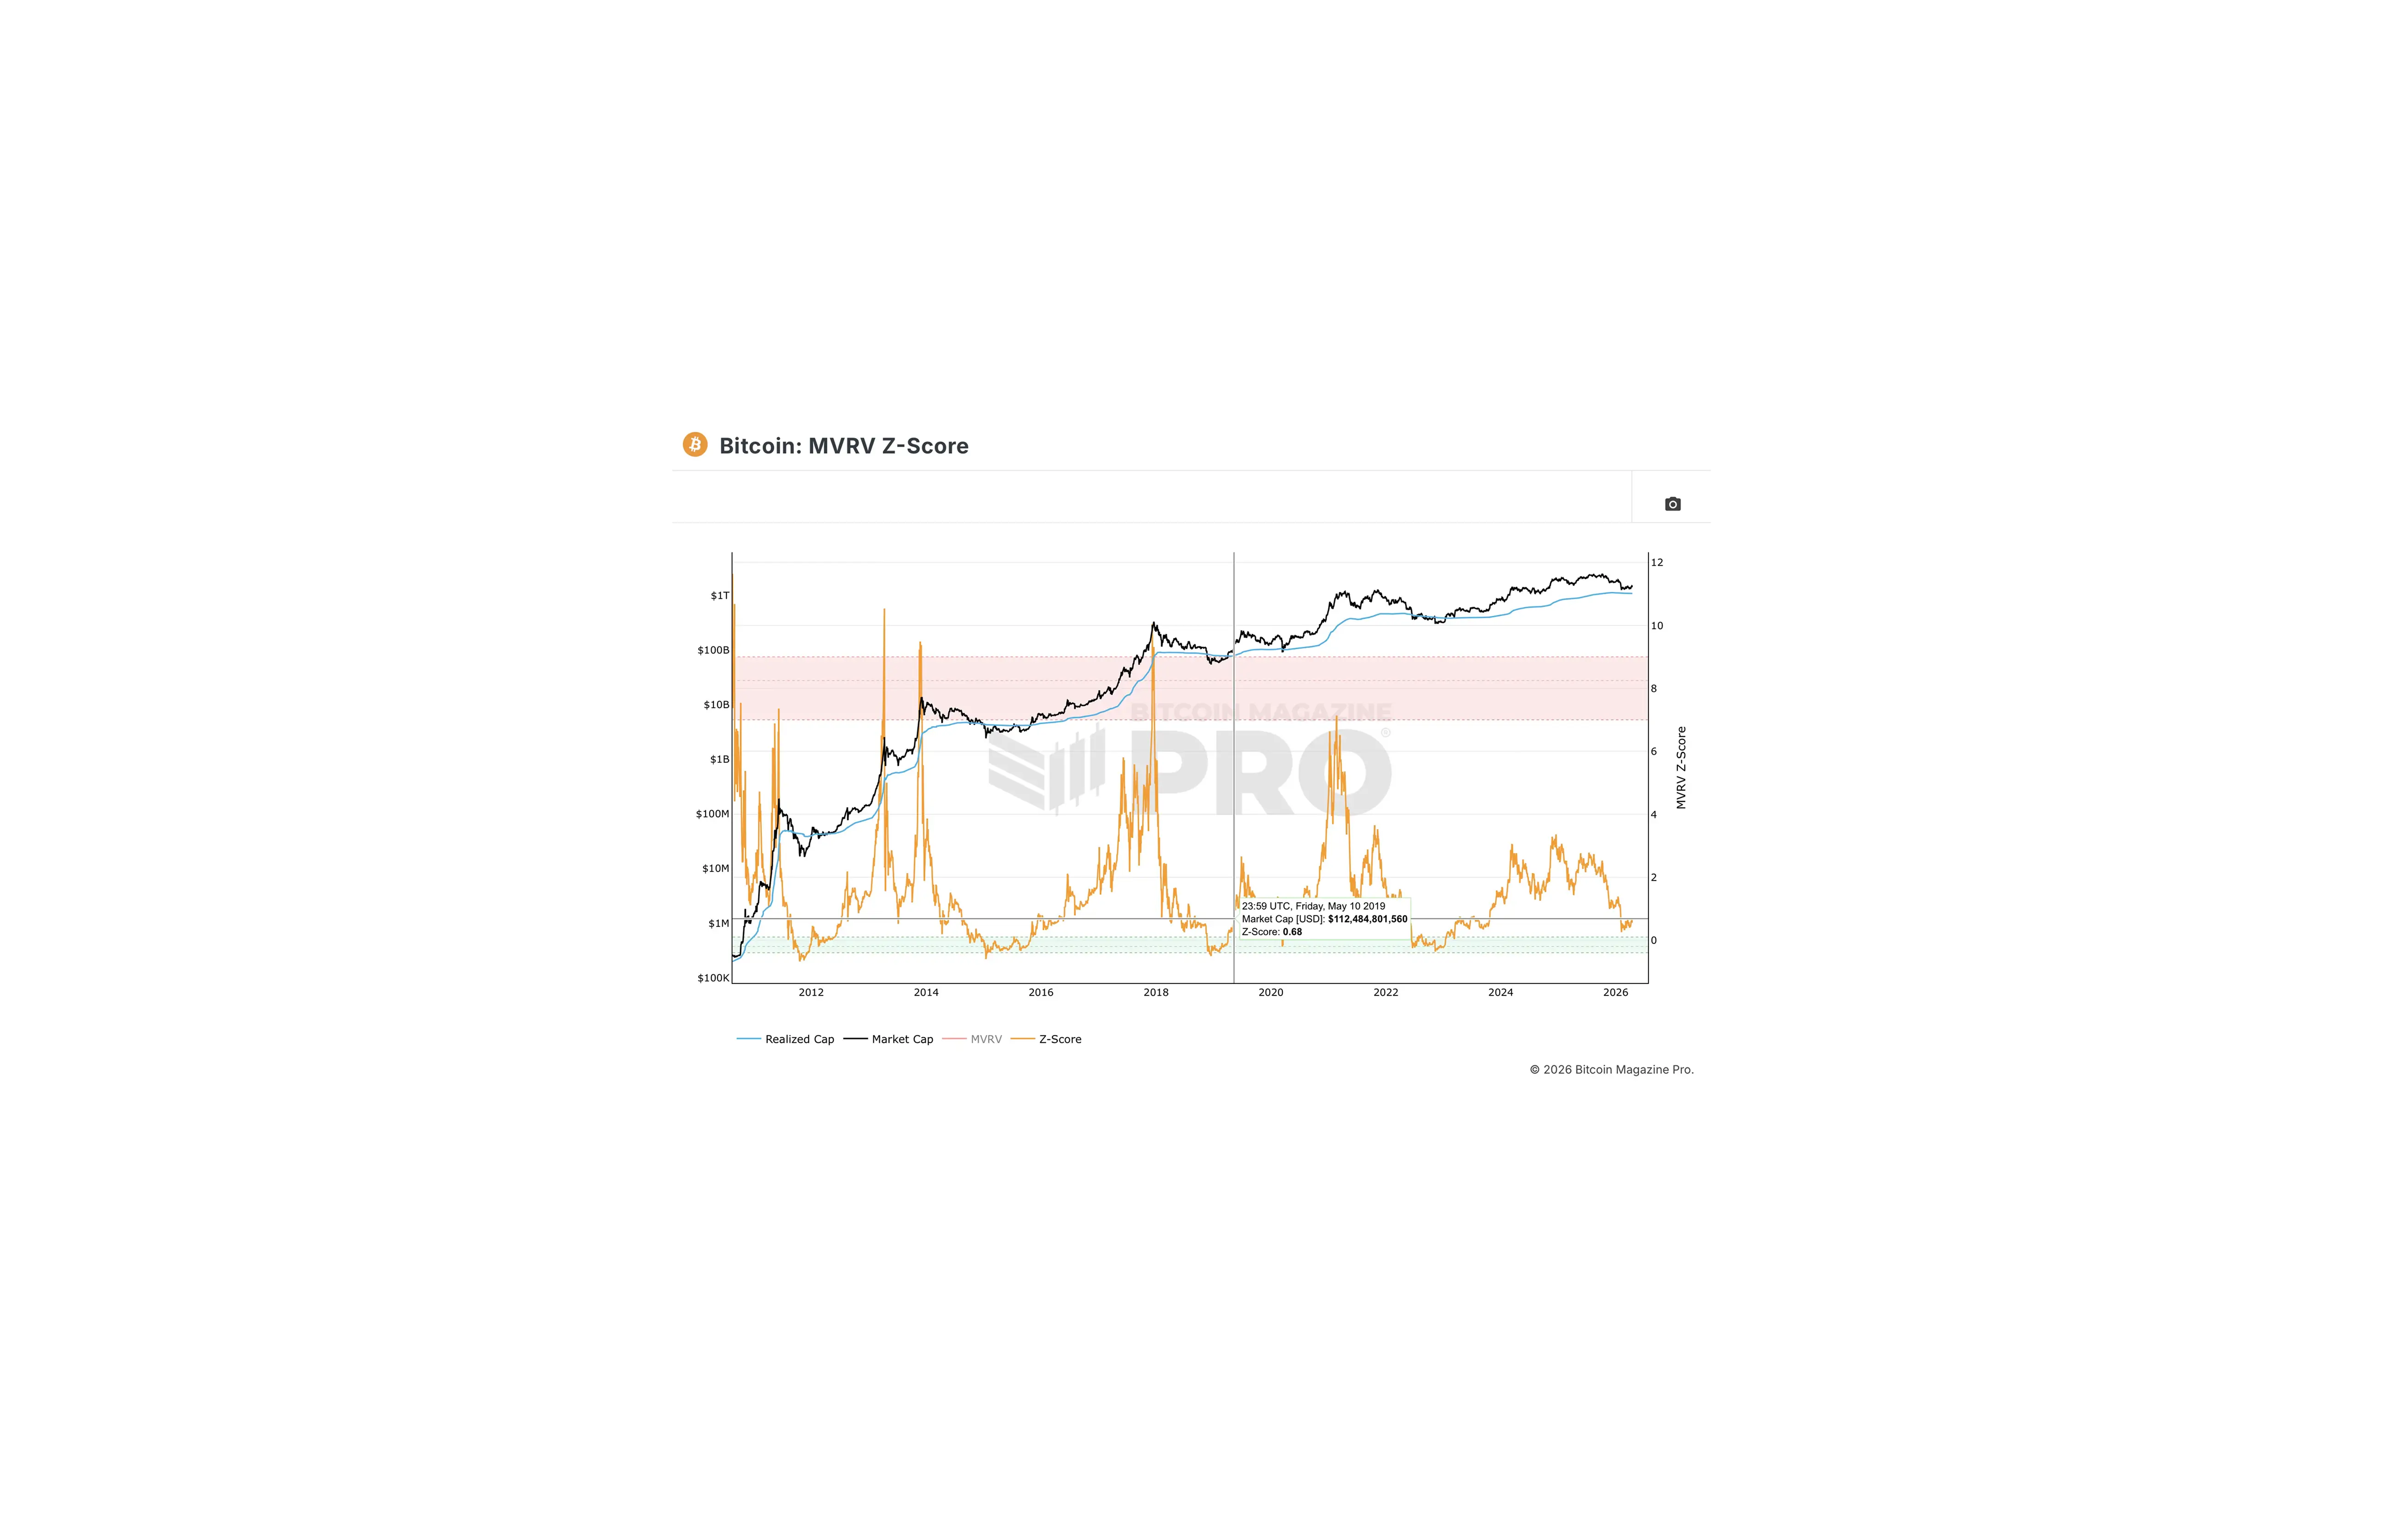
May 10, 2019 | 0.68 | ~$6,200 | Rising | +32% |
Aug 28, 2018 | 0.69 | ~$7,100 | Falling | −8% |
May 10, 2016 | 0.68 | ~$455 | Rising | +8% |
Aug 21, 2014 | 0.68 | ~$520 | Falling | −27% |
Apr 1, 2014 | 0.69 | ~$450 | Falling | Flat → −55% |
Jul 11, 2012 | 0.66 | ~$6.50 | Stabilising | +31% |
Aug 24, 2011 | 0.70 | ~$9 | Falling | −44% |
April 2026 ~$75,000 — Score: 0.69
The score is currently declining. As the instances below show, every bearish resolution in this dataset shared that same fingerprint, a score falling into the zone with no catalyst in sight. But the structural context in April 2026 differs materially.
The structural backdrop in April 2026, differs from every prior bearish reading at this level:
Exchange health: No catastrophic failure
Drawdown: 52% from October 2025 peak — shallower than the 70–80% corrections that preceded prior bearish MVRV Z-Score readings, though a deeper correction remains possible if 2026 follows a full bear market cycle
Funding rates: 46 consecutive days negative the longest streak since the November 2022 FTX bottom
LTH accumulation: Long-term holders absorbed $49 billion in supply during the drawdown buying from sellers and not moving it
Supply: Fewer than 1 million Bitcoin remain to be mined.
The direction of the score in the coming two to three weeks is the variable that matters. Every instance where it stabilised or turned upward from this zone resolved with a positive 30-day outcome. Every instance where it kept falling continued lower in the near term regardless of the long-term setup.
The data does not call the bottom. It confirms where Bitcoin stands relative to its own history and in six of nine prior cases, holding here delivered a materially better price within one month.
October 2023 ~$29,800 — Score: 0.67
Price gained 23% in 30 days and reached $73,000 by March 2024.
During October 2023 the FTX criminal trial was running in New York, Binance was under DOJ investigation, the 10-year Treasury yield was approaching 5%, and spot ETF applications from BlackRock and Fidelity were pending, the market did not believe approval was coming. The ETFs launched in January 2024.
April 2020 ~$7,800 — Score: 0.66
Six weeks earlier Bitcoin had crashed 39% in a single day on COVID panic. The score was rising after the capitulation, with the halving 17 days out. Strategy (or MicroStrategy at the time) had not yet made its first purchase.
Price gained 24% in 30 days and reached $29,000 by year-end. Four months after this reading, Strategy made its first Bitcoin purchase, $250 million at an average of $11,111 per coin marking the moment institutional accumulation became a public, on-record strategy.
May 2019 ~$6,200 — Score: 0.68
Price reached ~$8,500 within 30 days and continued to $13,000 by late June.
At the time the dominant narrative was dead-cat bounce, the New York AG had opened a Tether investigation, the score was crossing 0.68 from below, rising out of the December 2018 bottom where it had briefly gone negative.
Long-term holders had accumulated hard through the winter. Nobody believed it.
August 2018 ~$7,100 — Score: 0.69
Bitcoin had shed 63% from its $19,000 December 2017 peak.
The SEC had rejected the Winklevoss ETF. Google, Facebook, and Twitter had banned crypto ads. The score was falling through 0.69 toward lower levels. Price dropped another 8% within 30 days and bottomed at $3,200 in December 2018.
May 2016 ~$455 — Score: 0.68
The block size war had the developer community fractured.
Ethereum was pulling capital. The score was crossing 0.68 on its way up from the 2015 bottom, 16 months into a recovery grind, 60 days from the halving. No mainstream investor cared. Price gained 8% in 30 days. The halving and the 2017 bull run followed.
August 2014 ~$520 — Score: 0.68
Five months after the April reading, the score was still in the same band. The 2014 bear was ongoing. The Mt. Gox bankruptcy proceedings were grinding through Japanese courts with no resolution in sight. Silk Road 2.0 had launched and been seized.
The US government was auctioning seized Bitcoin, 30,000 BTC sold in June, another 50,000 scheduled creating consistent visible sell pressure from an unlikely source. Mining difficulty was rising while price was falling, squeezing miner margins and forcing capitulation selling.
A brief recovery to $650 in June had failed. The price fell another 27% within 30 days. The zone offered no automatic floor when macro conviction is absent.
April 2014 ~$450 — Score: 0.69
Mt. Gox had filed for bankruptcy in February with 850,000 BTC missing. China had censored financial institutions from handling Bitcoin. The Silk Road had been seized. Analysts were targeting $200–$300. The score was falling hard into the zone.
Price drifted flat then ground lower for ten months, bottoming at ~$200 in January 2015.
July 2012 ~$6.50 — Score: 0.66
The Bitcoin Savings and Trust Ponzi was under suspicion on forums. It would formally collapse in August and face SEC charges in 2013. Bitfloor had been hacked.
The mainstream tech press had written the experiment off. The first halving was four months away. The score was stabilising, not falling. Price ground up 31% within 30 days and closed 2012 at $13.45.
August 2011 ~$9 — Score: 0.70
Bitcoin had collapsed 70% from its $29.60 June peak.
MyBitcoin had just shut down with 78,000 BTC unaccounted for. Mt. Gox had been compromised. Forums debated whether Bitcoin could survive as a custody system at all. Price continued falling, hitting ~$2 by November before recovering to $13 by end of 2012.
Conclusion
Six of nine prior instances at this Z-Score level resolved with a better price within 30 days. Three did not. The structural backdrop — institutional accumulation at scale, a historically compressed short position, and a drawdown half the depth of prior bearish analogues make a direct comparison to 2014 or 2018 analytically thin.
Watch the score direction over the next two to three weeks. A stabilisation or turn upward from this level has, without exception across this dataset, preceded a positive 30-day outcome. That is not a guarantee. It is a pattern with a sample size of six.
Some readings clustered within the same bear market cycle are grouped as single instances.
FAQ
What does the Bitcoin MVRV Z-Score measure and why does a value near zero matter?
The MVRV Z-Score compares what the market says Bitcoin is worth today to what everyone actually paid for it. When it drops near zero, the market is pricing Bitcoin at roughly what holders paid, a level where buyers with conviction have historically appeared.
How often has Bitcoin’s MVRV Z-Score been around 0.69, and what were the typical outcomes?
A Z-Score around 0.69 has occurred about nine times since 2011. Six of those instances resolved with a higher price within 30 days, while three continued lower. The level itself did not determine the outcome; the direction of the score did.
Why is the direction of the MVRV Z-Score from this zone important?
In this dataset, every time the score stabilised or turned upward from this zone, Bitcoin’s price was higher 30 days later. Every time the score kept falling from this zone, price continued lower in the near term, regardless of the long-term setup.
How does the April 2026 setup differ from earlier bearish readings near a 0.69 Z-Score?
In April 2026, exchange health shows no catastrophic failure, the drawdown from the October 2025 peak is 52% instead of the 70–80% seen before prior bearish readings, funding rates have been negative for 46 consecutive days, long-term holders absorbed $49 billion in supply during the drawdown, and fewer than 1 million Bitcoin remain to be mined.
Disclaimer
The information provided in this article is for informational purposes only. It is not intended to be, nor should it be construed as, financial advice. We do not make any warranties regarding the completeness, reliability, or accuracy of this information. All investments involve risk, and past performance does not guarantee future results. We recommend consulting a financial advisor before making any investment decisions.


