











Quick summary
Bitcoin’s July 1 2026 low near $58,000 is a leading bear‑market bottom candidate
Price has bounced about 41 percent, reclaiming short‑term holder cost basis and 200‑week average
Confirmation needs price above 50‑week average near $81,200 and weekly RSI holding over 56
Breaks below $65,800 or especially $57,900 would weaken or invalidate the current bottom thesis
Bitcoin may have established its bear-market low near $58,000 on July 1, 2026. The low arrived almost nine months after Bitcoin reached approximately $126,000 in early October 2025 and represented a drawdown of roughly 54%.
July cannot yet be declared the final low. However, the recovery now resembles several previous Bitcoin bottoms across price structure, momentum, holder cost basis and relative value against gold. This article provides evidence to support a cautiously bullish position while leaving clear conditions for confirmation and failure.
The Bottom Thesis at a Glance
The analysis below examines the evidence supporting July’s low, the confirmation still required and the conditions that would prove the thesis wrong.
Closest comparison: From its July 1, 2026 low, Bitcoin produced an initial 8% reversal and gained approximately 41% within 54 days. Following the November 22, 2022 low, Bitcoin began with a 7% reversal and advanced roughly 38% within 53 days.
Early support: Bitcoin is trading near $79,700 above:
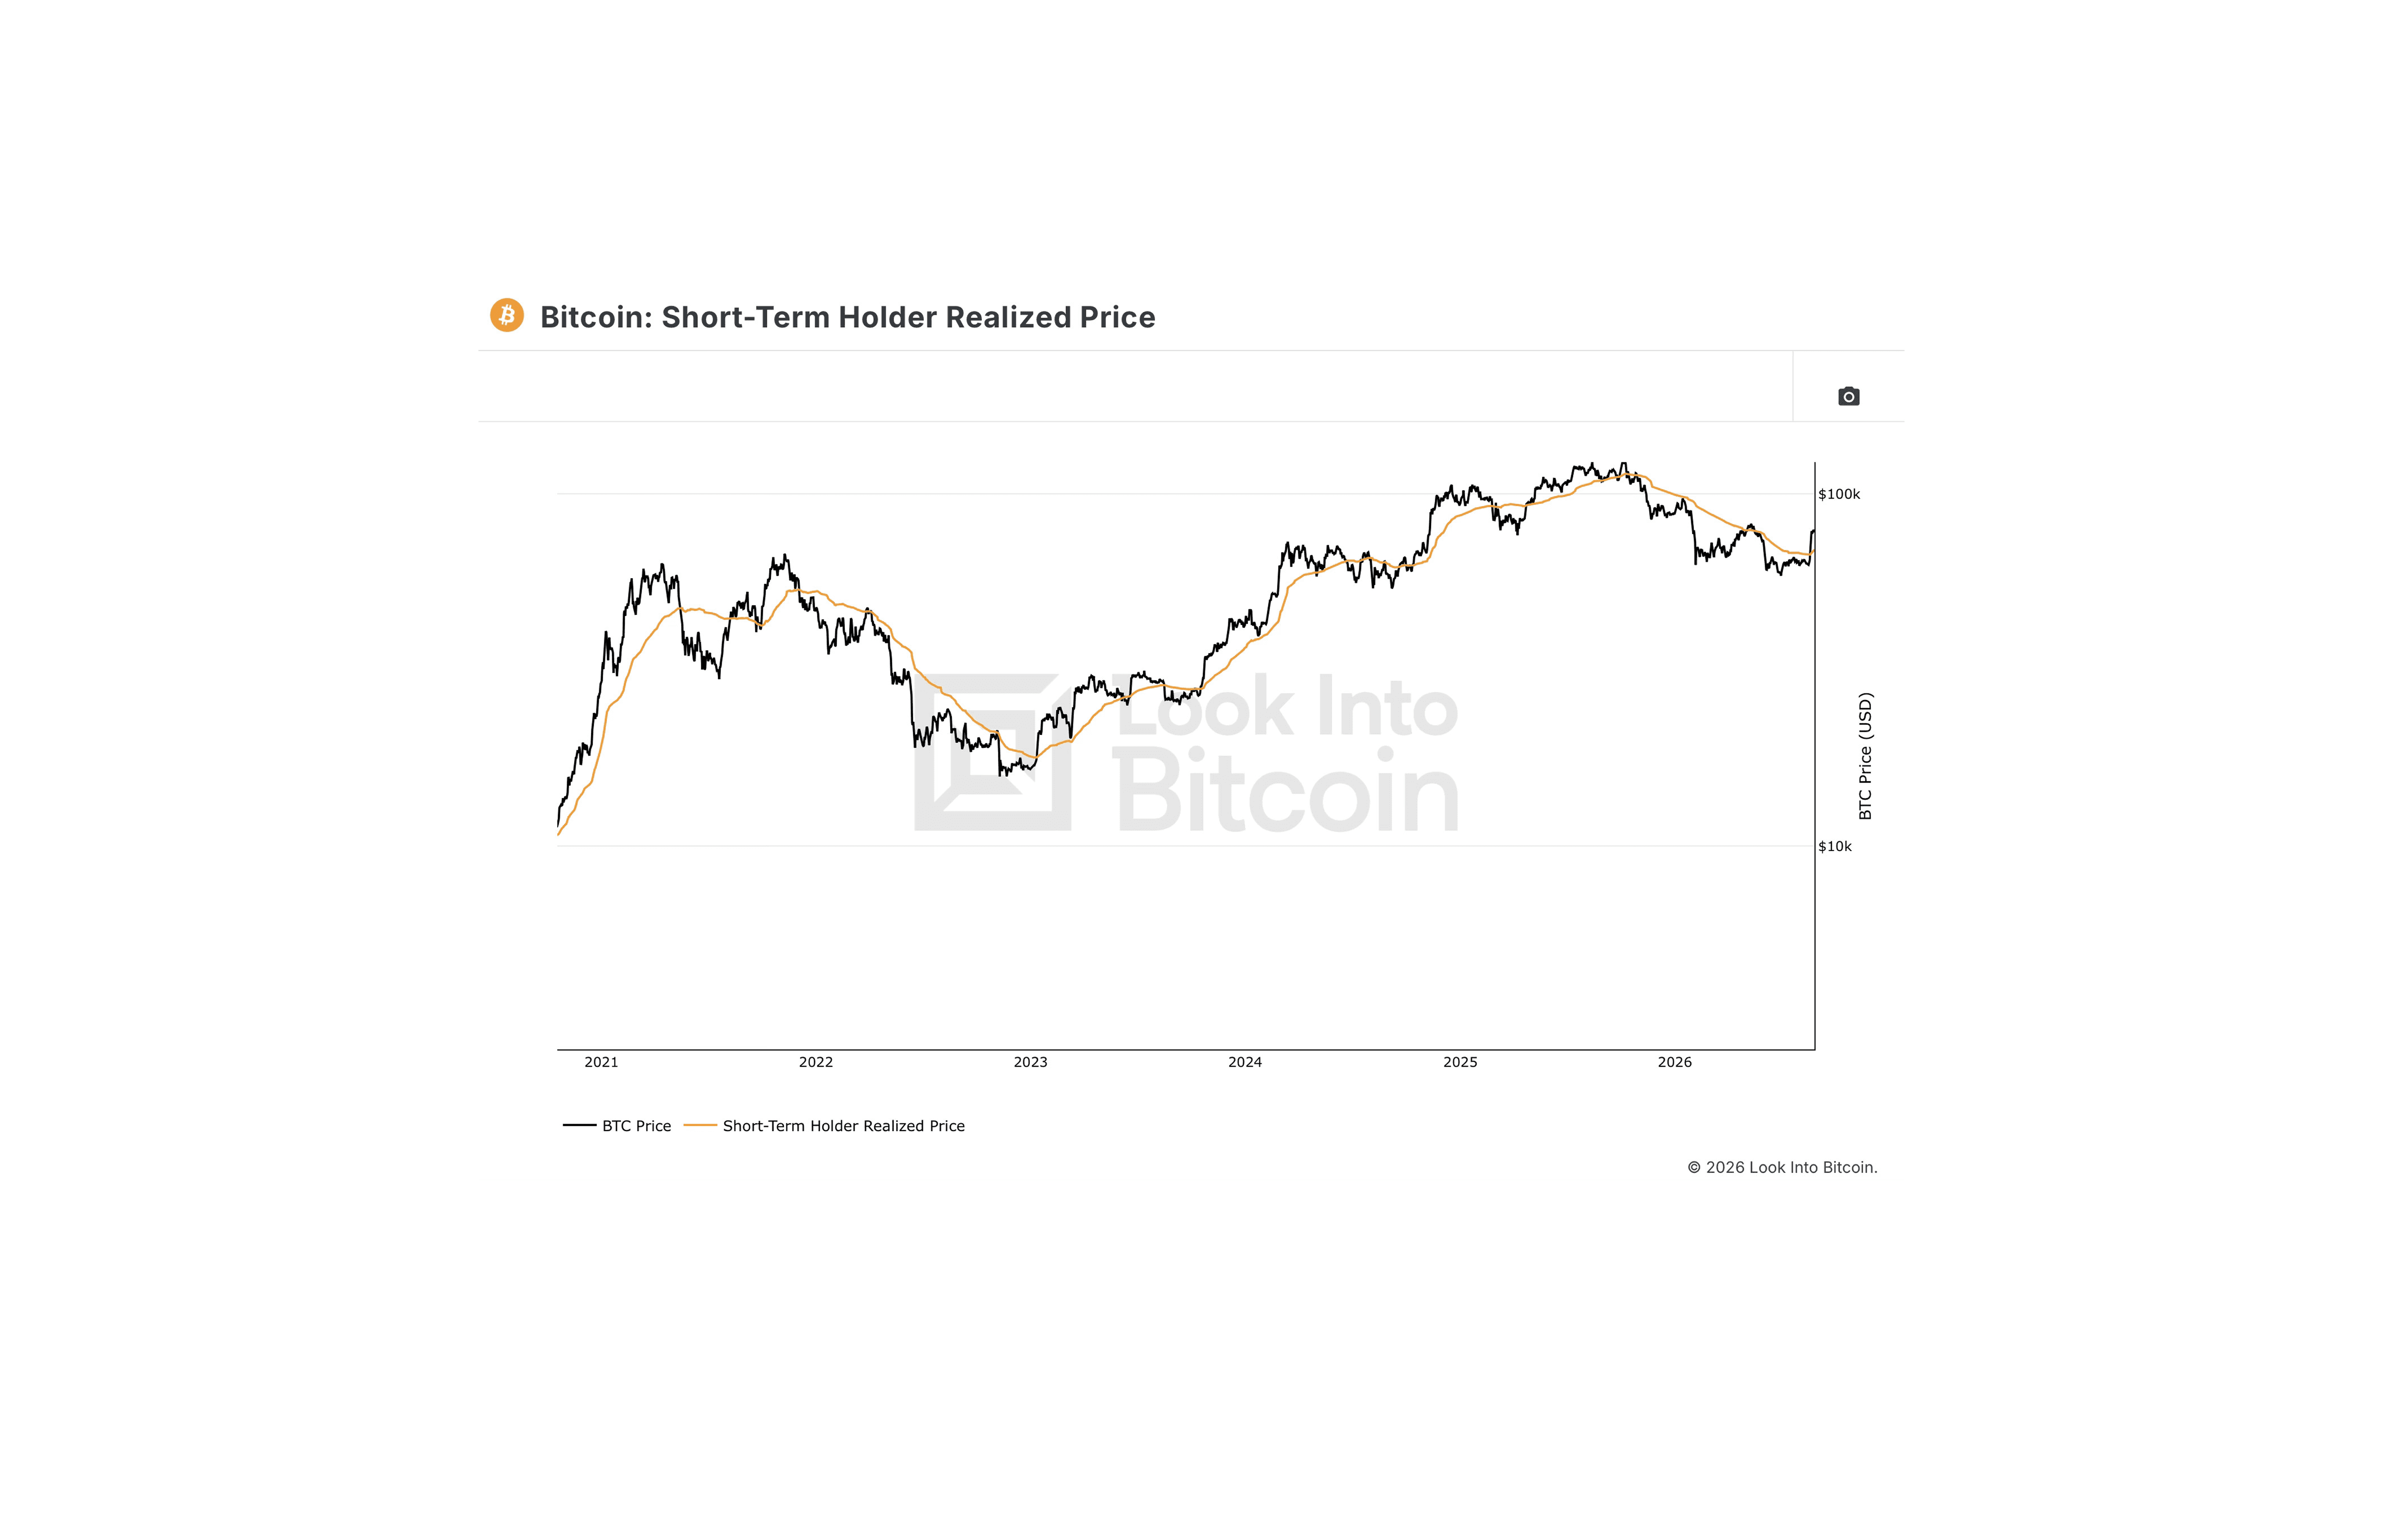
Short-term holder realised price: sits between approximately $71,000 and $73,800. Trading above it places the average recent buyer back into profit.
The 200-week moving average: sits near $64,800. Reclaiming it returns Bitcoin above an area associated with previous bear-market lows.
Together, these early readings support the bottom thesis, but the market still needs to clear two important confirmation tests.
Confirmation pending: Bitcoin must reclaim and hold above its 50-week moving average near $81,200. Weekly RSI must close above past resistance around 56-57 and remain above 57 during subsequent weekly candles.
Possible retest: A return toward $71,000-$73,800 would remain consistent with the recovery if buyers defend the area.
Below the retest area, the focus shifts from confirmation to downside risk.
Reassessment level: A confirmed close below $65,800 would materially weaken the recovery structure and increase the probability of another test of the July low.
Invalidation level: A decisive move below the July low near $58,000 would establish a new low and invalidate the bottom thesis.
Before considering those downside conditions, the broader evidence shows why July remains the leading candidate for Bitcoin’s bear-market low.
Bear-Market Drawdowns Are Becoming Shallower
Each major Bitcoin bear market has ended at a smaller discount to its preceding peak.
July continued that tendency:
January 2015: Approximately 85% below the preceding cycle high.
December 2018: Approximately 84% below the preceding cycle high.
November 2022: Approximately 77% below the preceding cycle high.
July 2026: Approximately 54% below the October 2025 high.
The pattern does not mean every future decline will be smaller. It does, however, suggest that Bitcoin’s major bear-market drawdowns may be moderating as the market matures.
Moving Averages Show Improvement, but Confirmation Is Incomplete
Moving averages help separate an early buying opportunity from later confirmation. Bitcoin’s 200-week average has historically marked and traded near major bear-market lows, making it useful for identifying where long-term value may be forming.
Earlier opportunity: Buying near the 200-week average captures more of the recovery if the low holds.
Higher risk: Price can remain below the average or return to it before recovering.
Current position: Bitcoin is now above the 200-week average, supporting the bottoming case.
The 200-Week Average Marks the Earlier Buying Zone
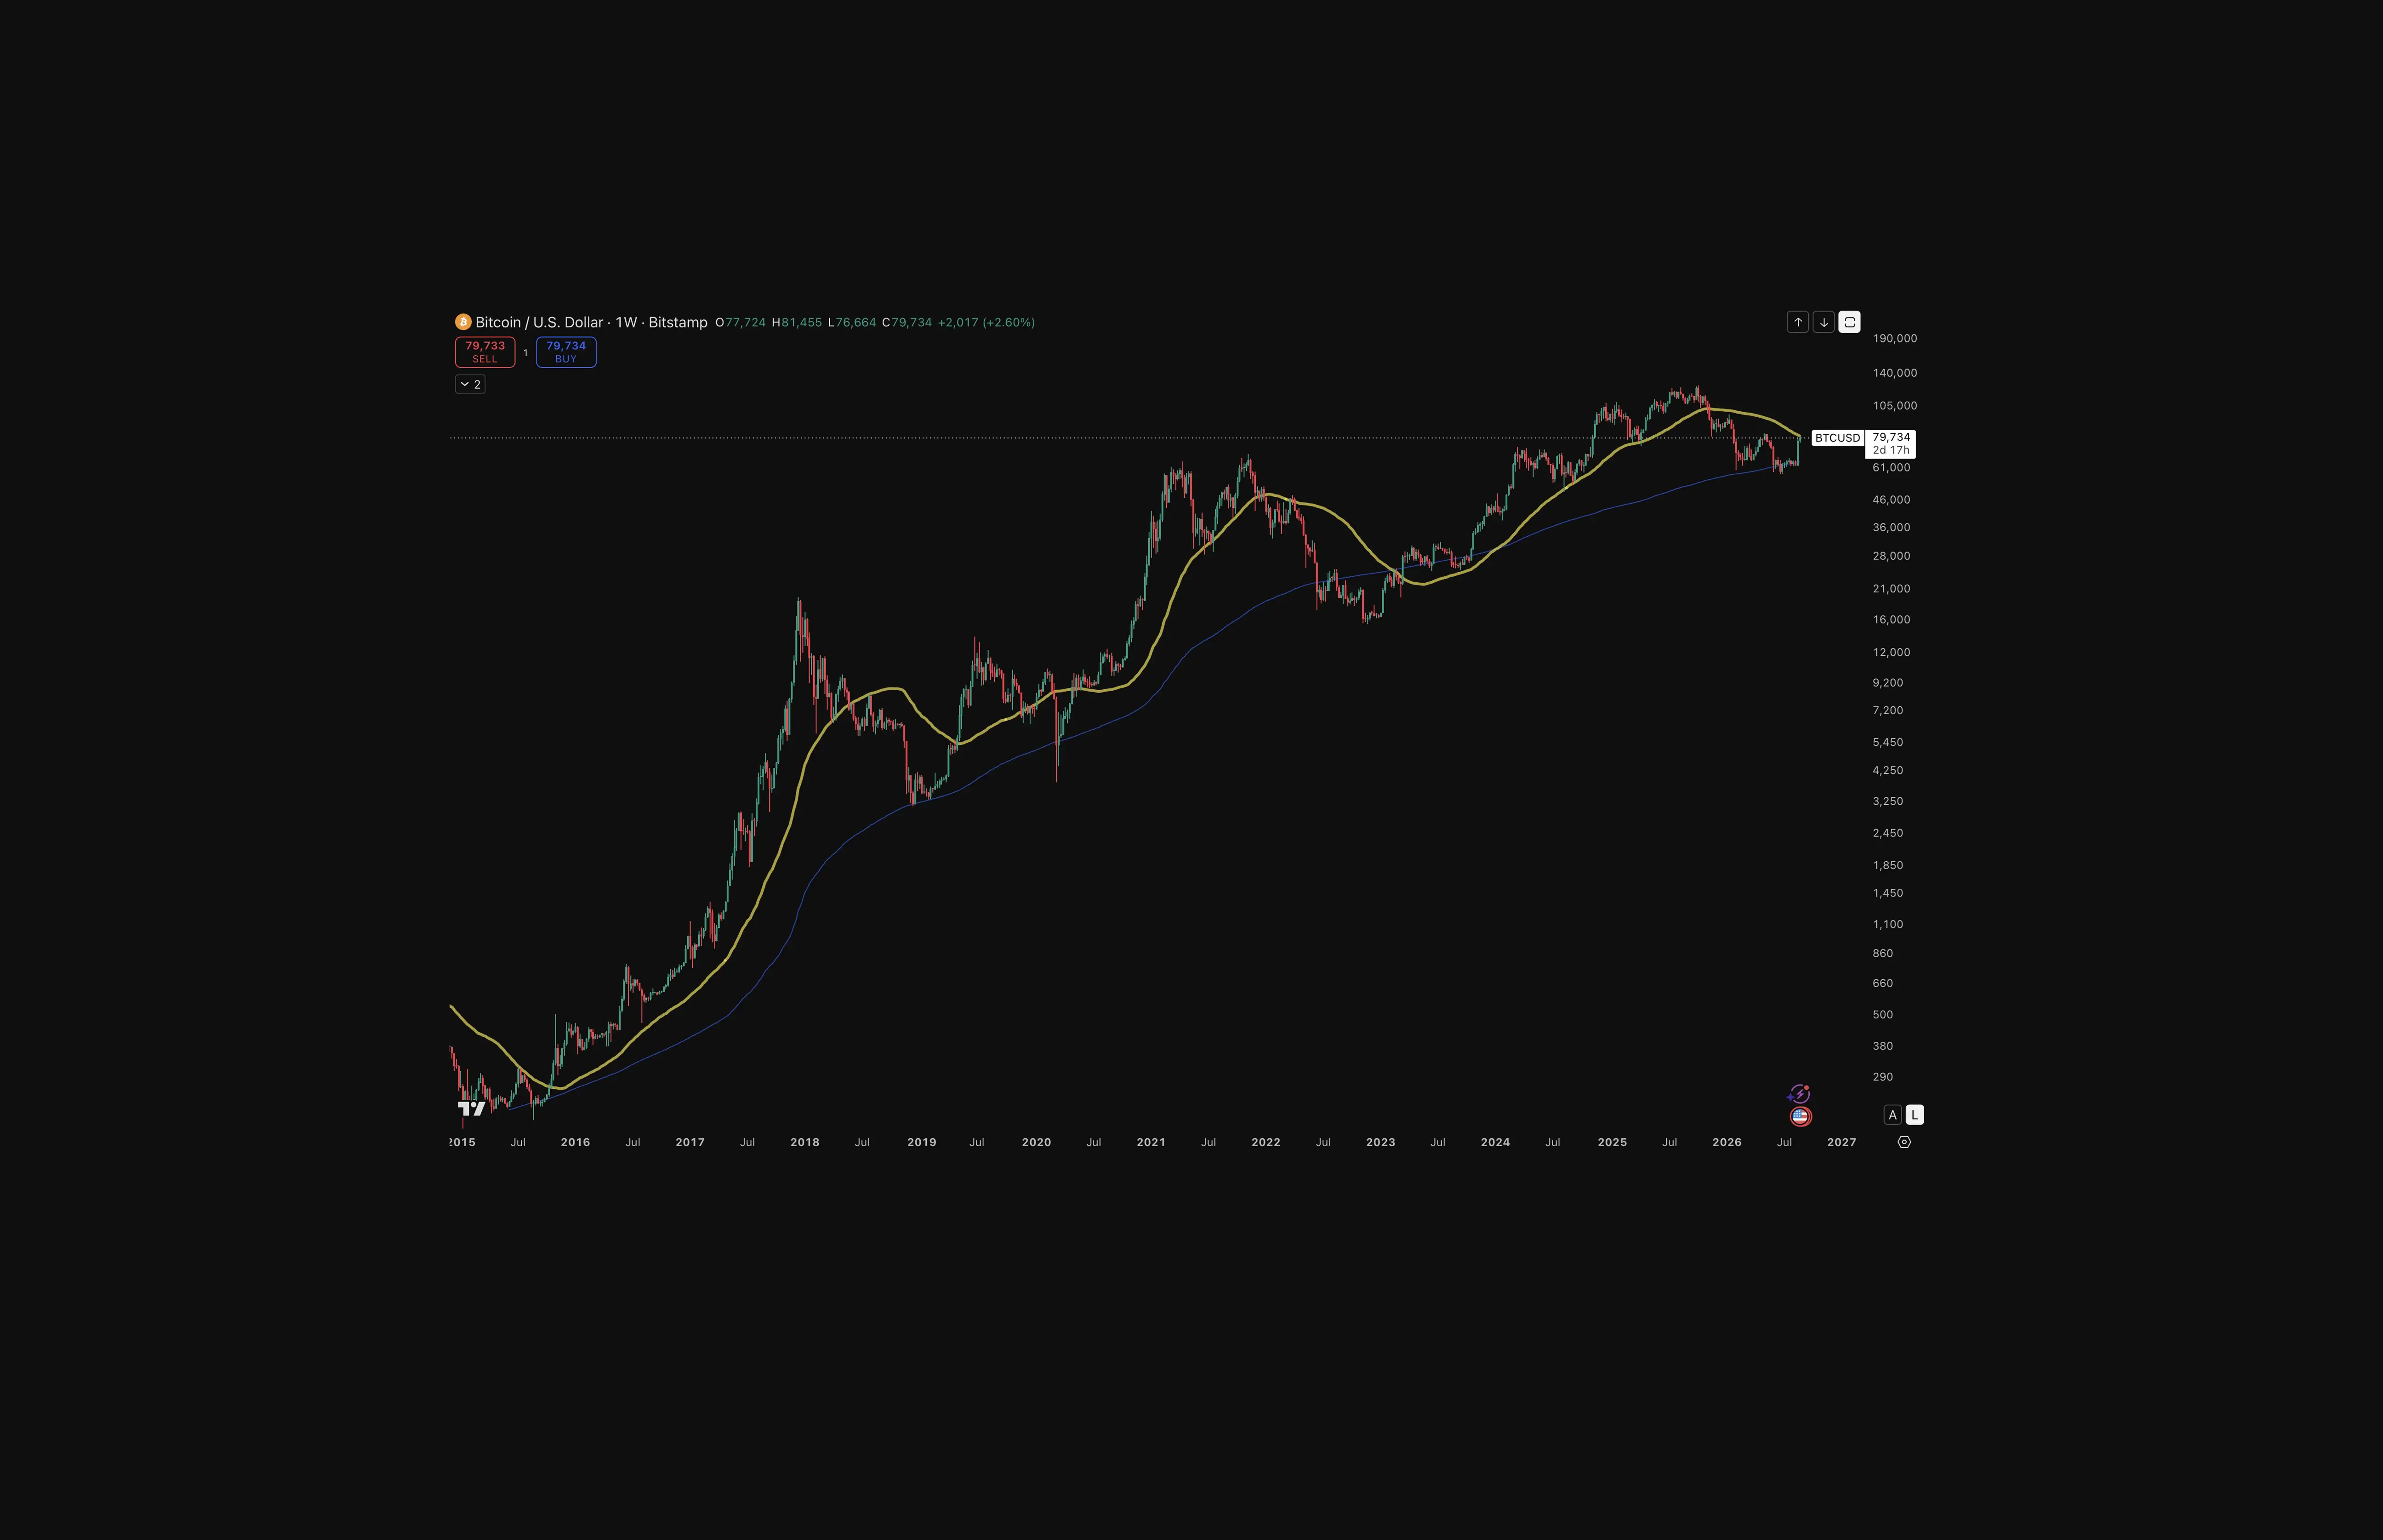
2015 bottom: Bitcoin fell below the 200-week average before beginning its recovery.
2018 bottom: Price bottomed almost directly on the average.
March 2020 crash: Bitcoin briefly moved below it before quickly recovering.
2022 bottom: Price spent an extended period below the average before reclaiming it during the 2023 recovery.
July 2026 candidate: Bitcoin again traded below the average before recovering above its current level near $64,800.
The 50-Week Average Provides Later Confirmation
The faster 50-week average reacts sooner to changing prices and can later help confirm that the trend has turned. However, historically, waiting for the 50-week average confirmation lowers some uncertainty for the buyer but means buying after part of the recovery has already occurred.
The 50-Week Average Provides Later Confirmation
The 50-week moving average reacts more slowly than price. A sustained reclaim would show that Bitcoin has recovered above the average price of the preceding year and would strengthen the case for a broader trend change.
As of August 28, 2026, Bitcoin has not conclusively completed the 50-week moving-average test.
Early evidence: Reclaiming the 200-week average supports the view that a long-term bottom may already have formed.
Later confirmation: Reclaiming and holding the 50-week average would provide stronger evidence that the broader trend has turned.
Trade-off: Waiting for the 50-week reclaim reduces uncertainty but sacrifices part of the potential recovery.
Shorter-Term Moving Averages Are Constructive but Incomplete
The same separation appears on the shorter moving average charts:
Daily Chart: Above Both the 50-Day and 200-Day Moving Averages
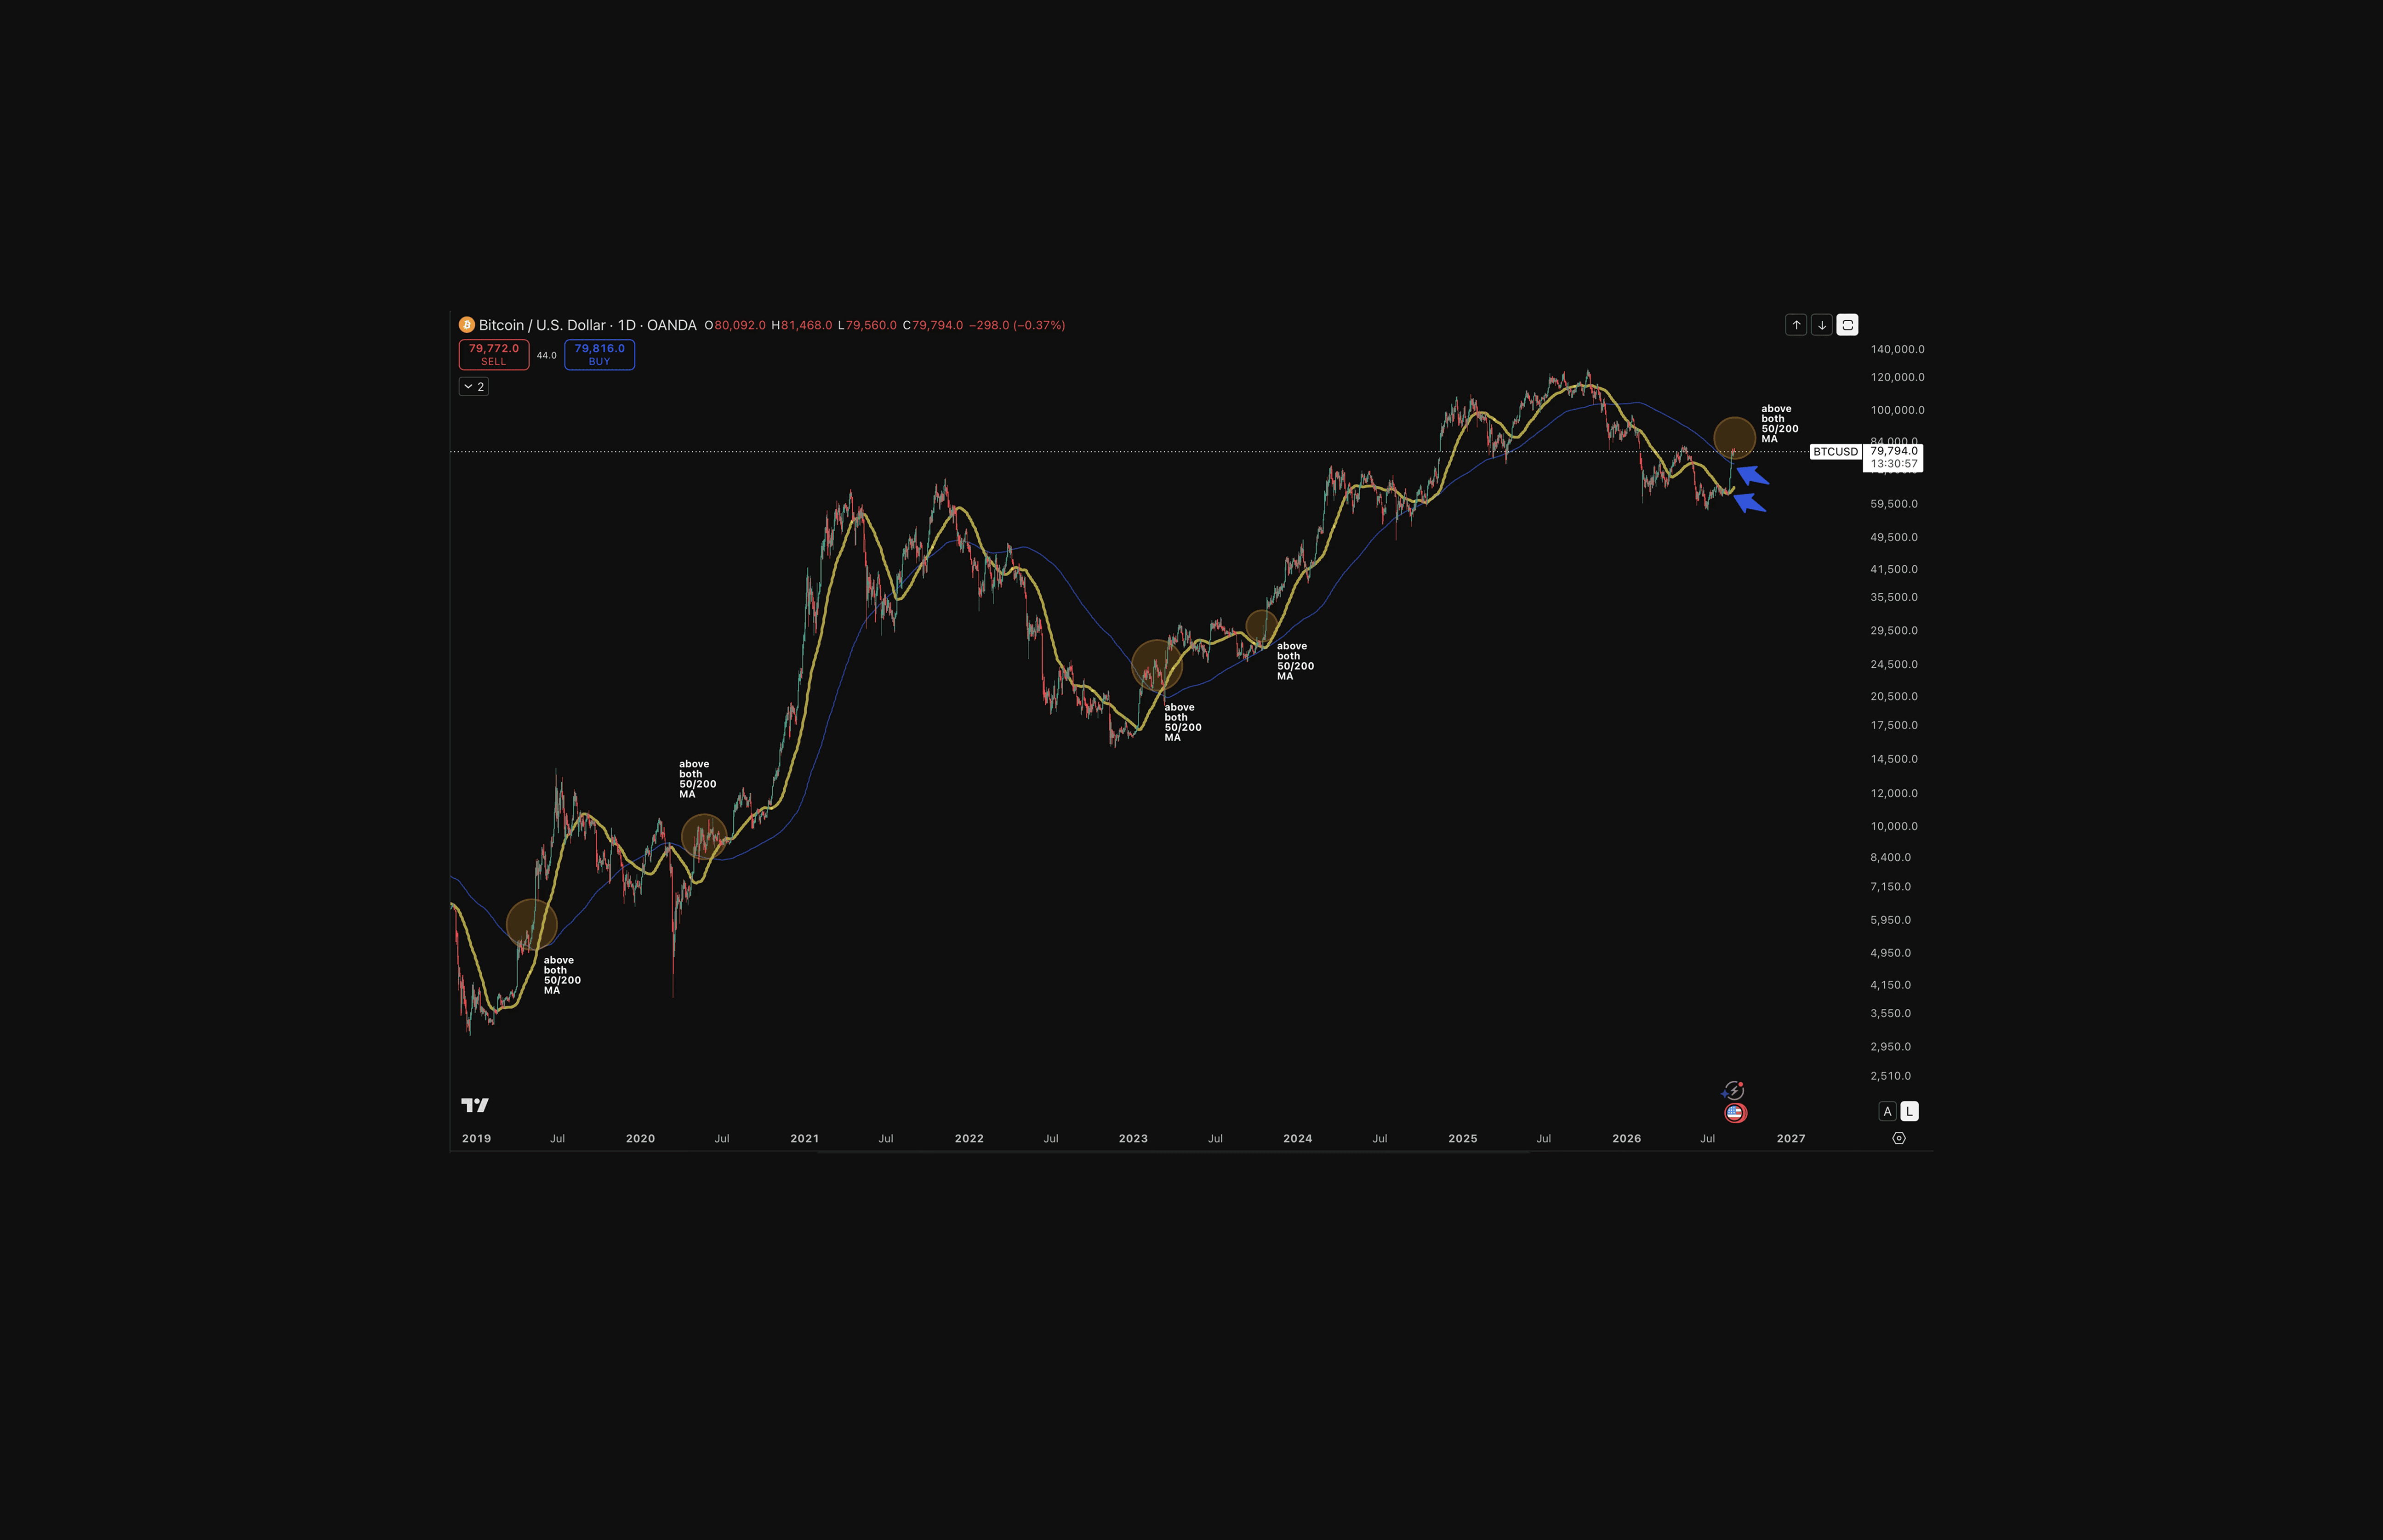
Daily chart: Bitcoin has recovered above its 50-day average and 200-day average. A continued close above the daily close and hold above both would strengthen the recovery.
Three-Day Chart: Above the 200-Bar Average, Below the 50-Bar Average
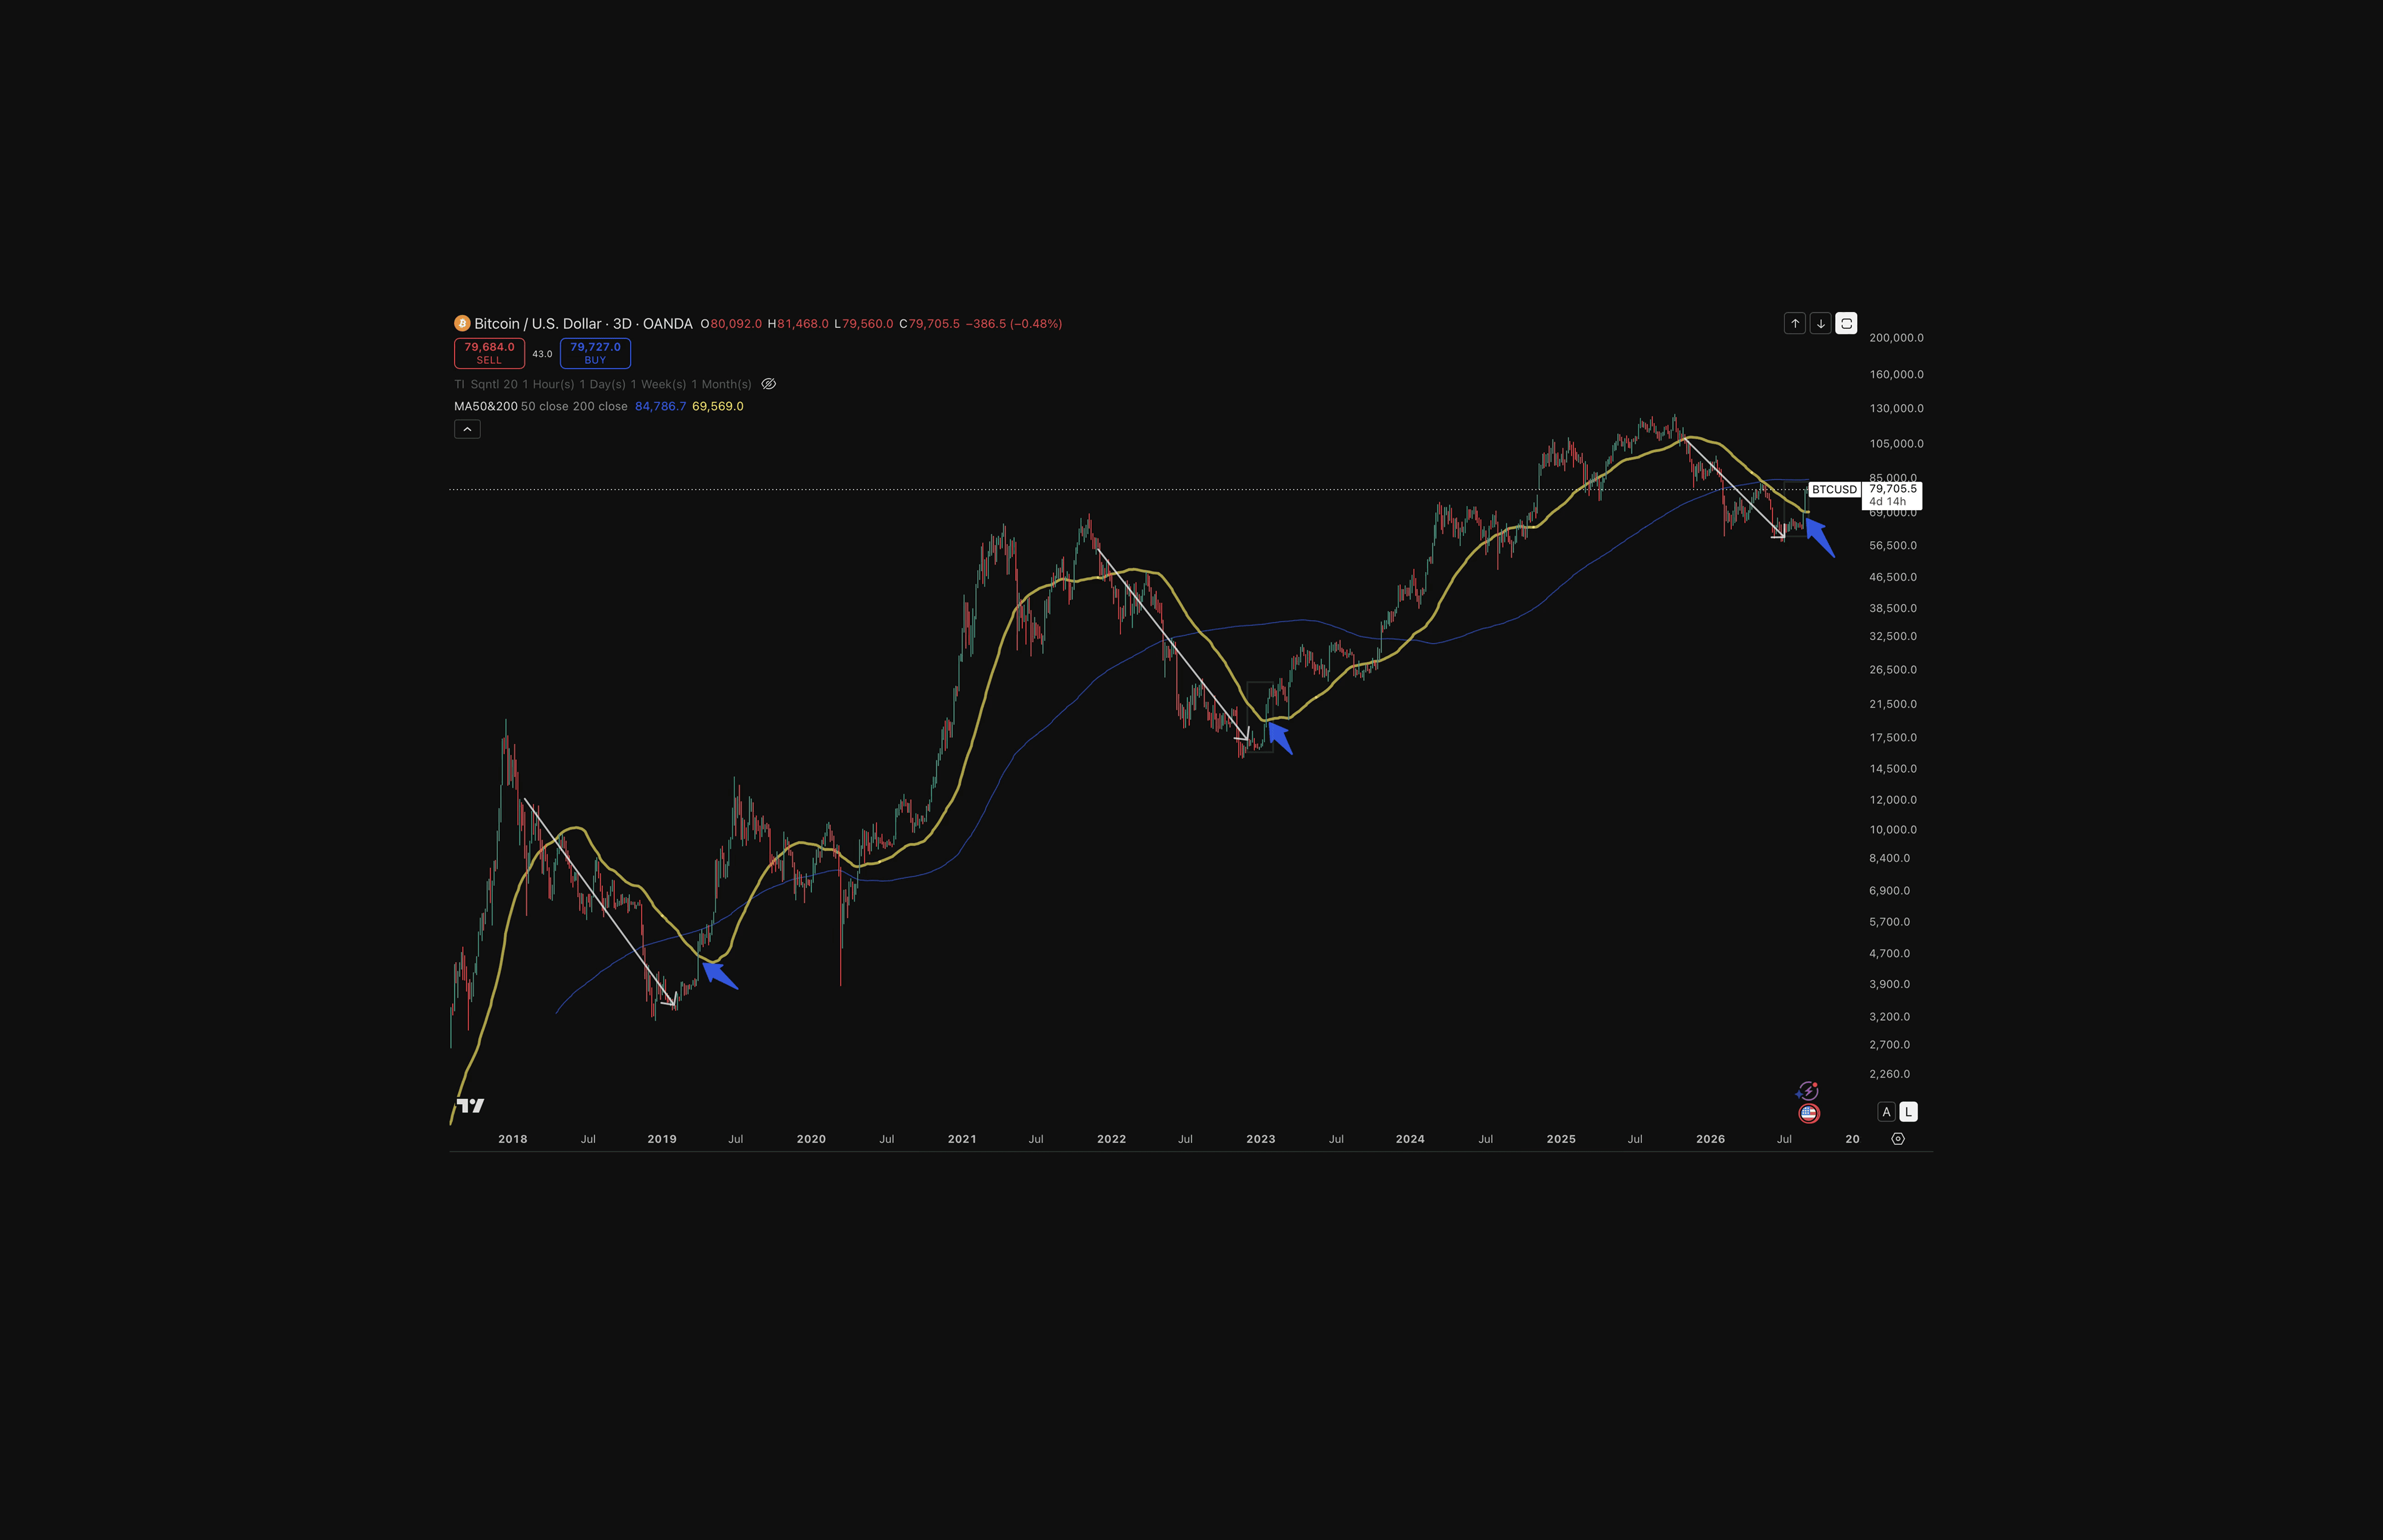
Three-day chart: Bitcoin is above the 200-bar average but below the 50-bar average. Because each candle represents three days, these are not the 50-day and 200-day averages.
Interpretation: Multiple timeframes show improvement, but the slower confirmation levels have not all been reclaimed.
Coinjuice Was Watching Momentum Before the July Low
In the June 12 Coinjuice edition, weekly RSI was near 34 and remained below resistance around 56. The edition identified this resistance as an important level Bitcoin needed to clear before a stronger recovery could develop.
Original condition: Weekly RSI needed to move above 56 before Coinjuice could consider the bearish momentum structure to be weakening.
Bearish outcome: A rejection from 56 would have preserved resistance and kept the momentum structure bearish.
August breakout: The weekly candle beginning August 17 pushed RSI above 56, with the reading now around 57-58.
Confirmation required: Weekly RSI must close and hold above resistance. A reversal below 56 would invalidate the momentum breakout, weaken the bottom thesis and require the fractal comparisons below to be reassessed.
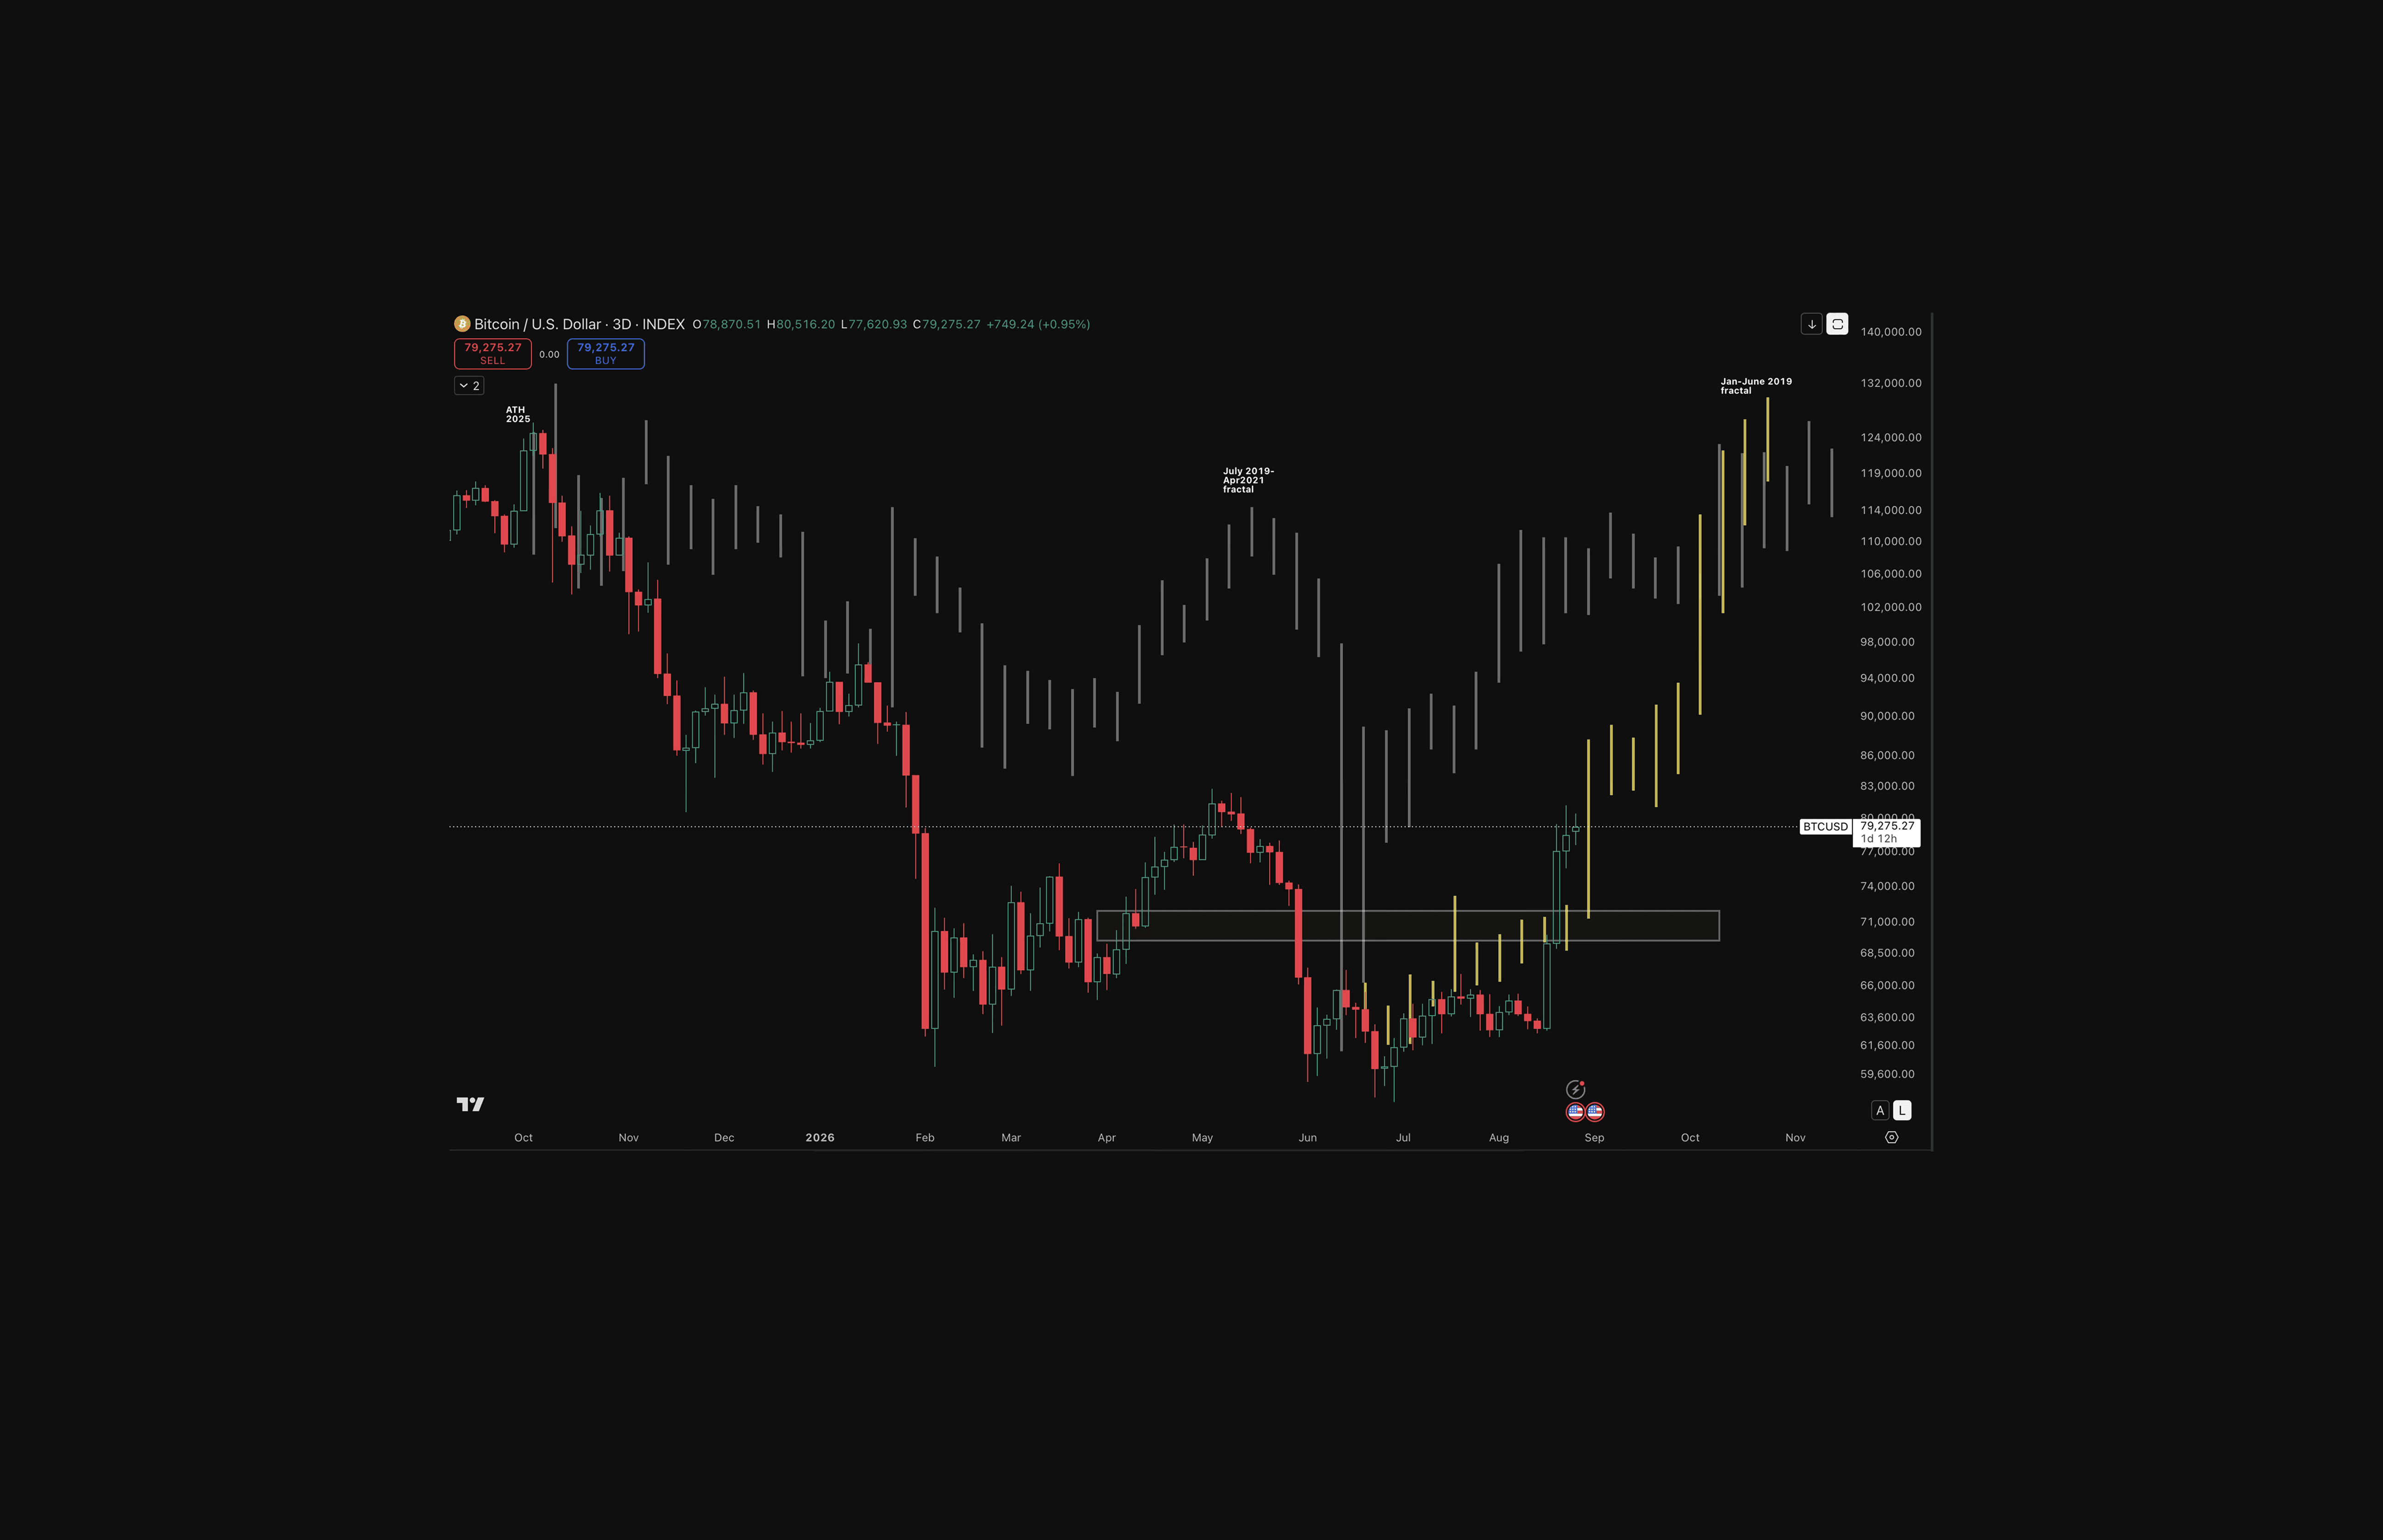
Price comparison: Bitcoin has also followed the early stages of the January-June 2019 recovery closely enough to justify updating the chart.
The historical sequence’s value comes from applying a condition recorded before the rally rather than choosing a matching pattern only after price had moved.
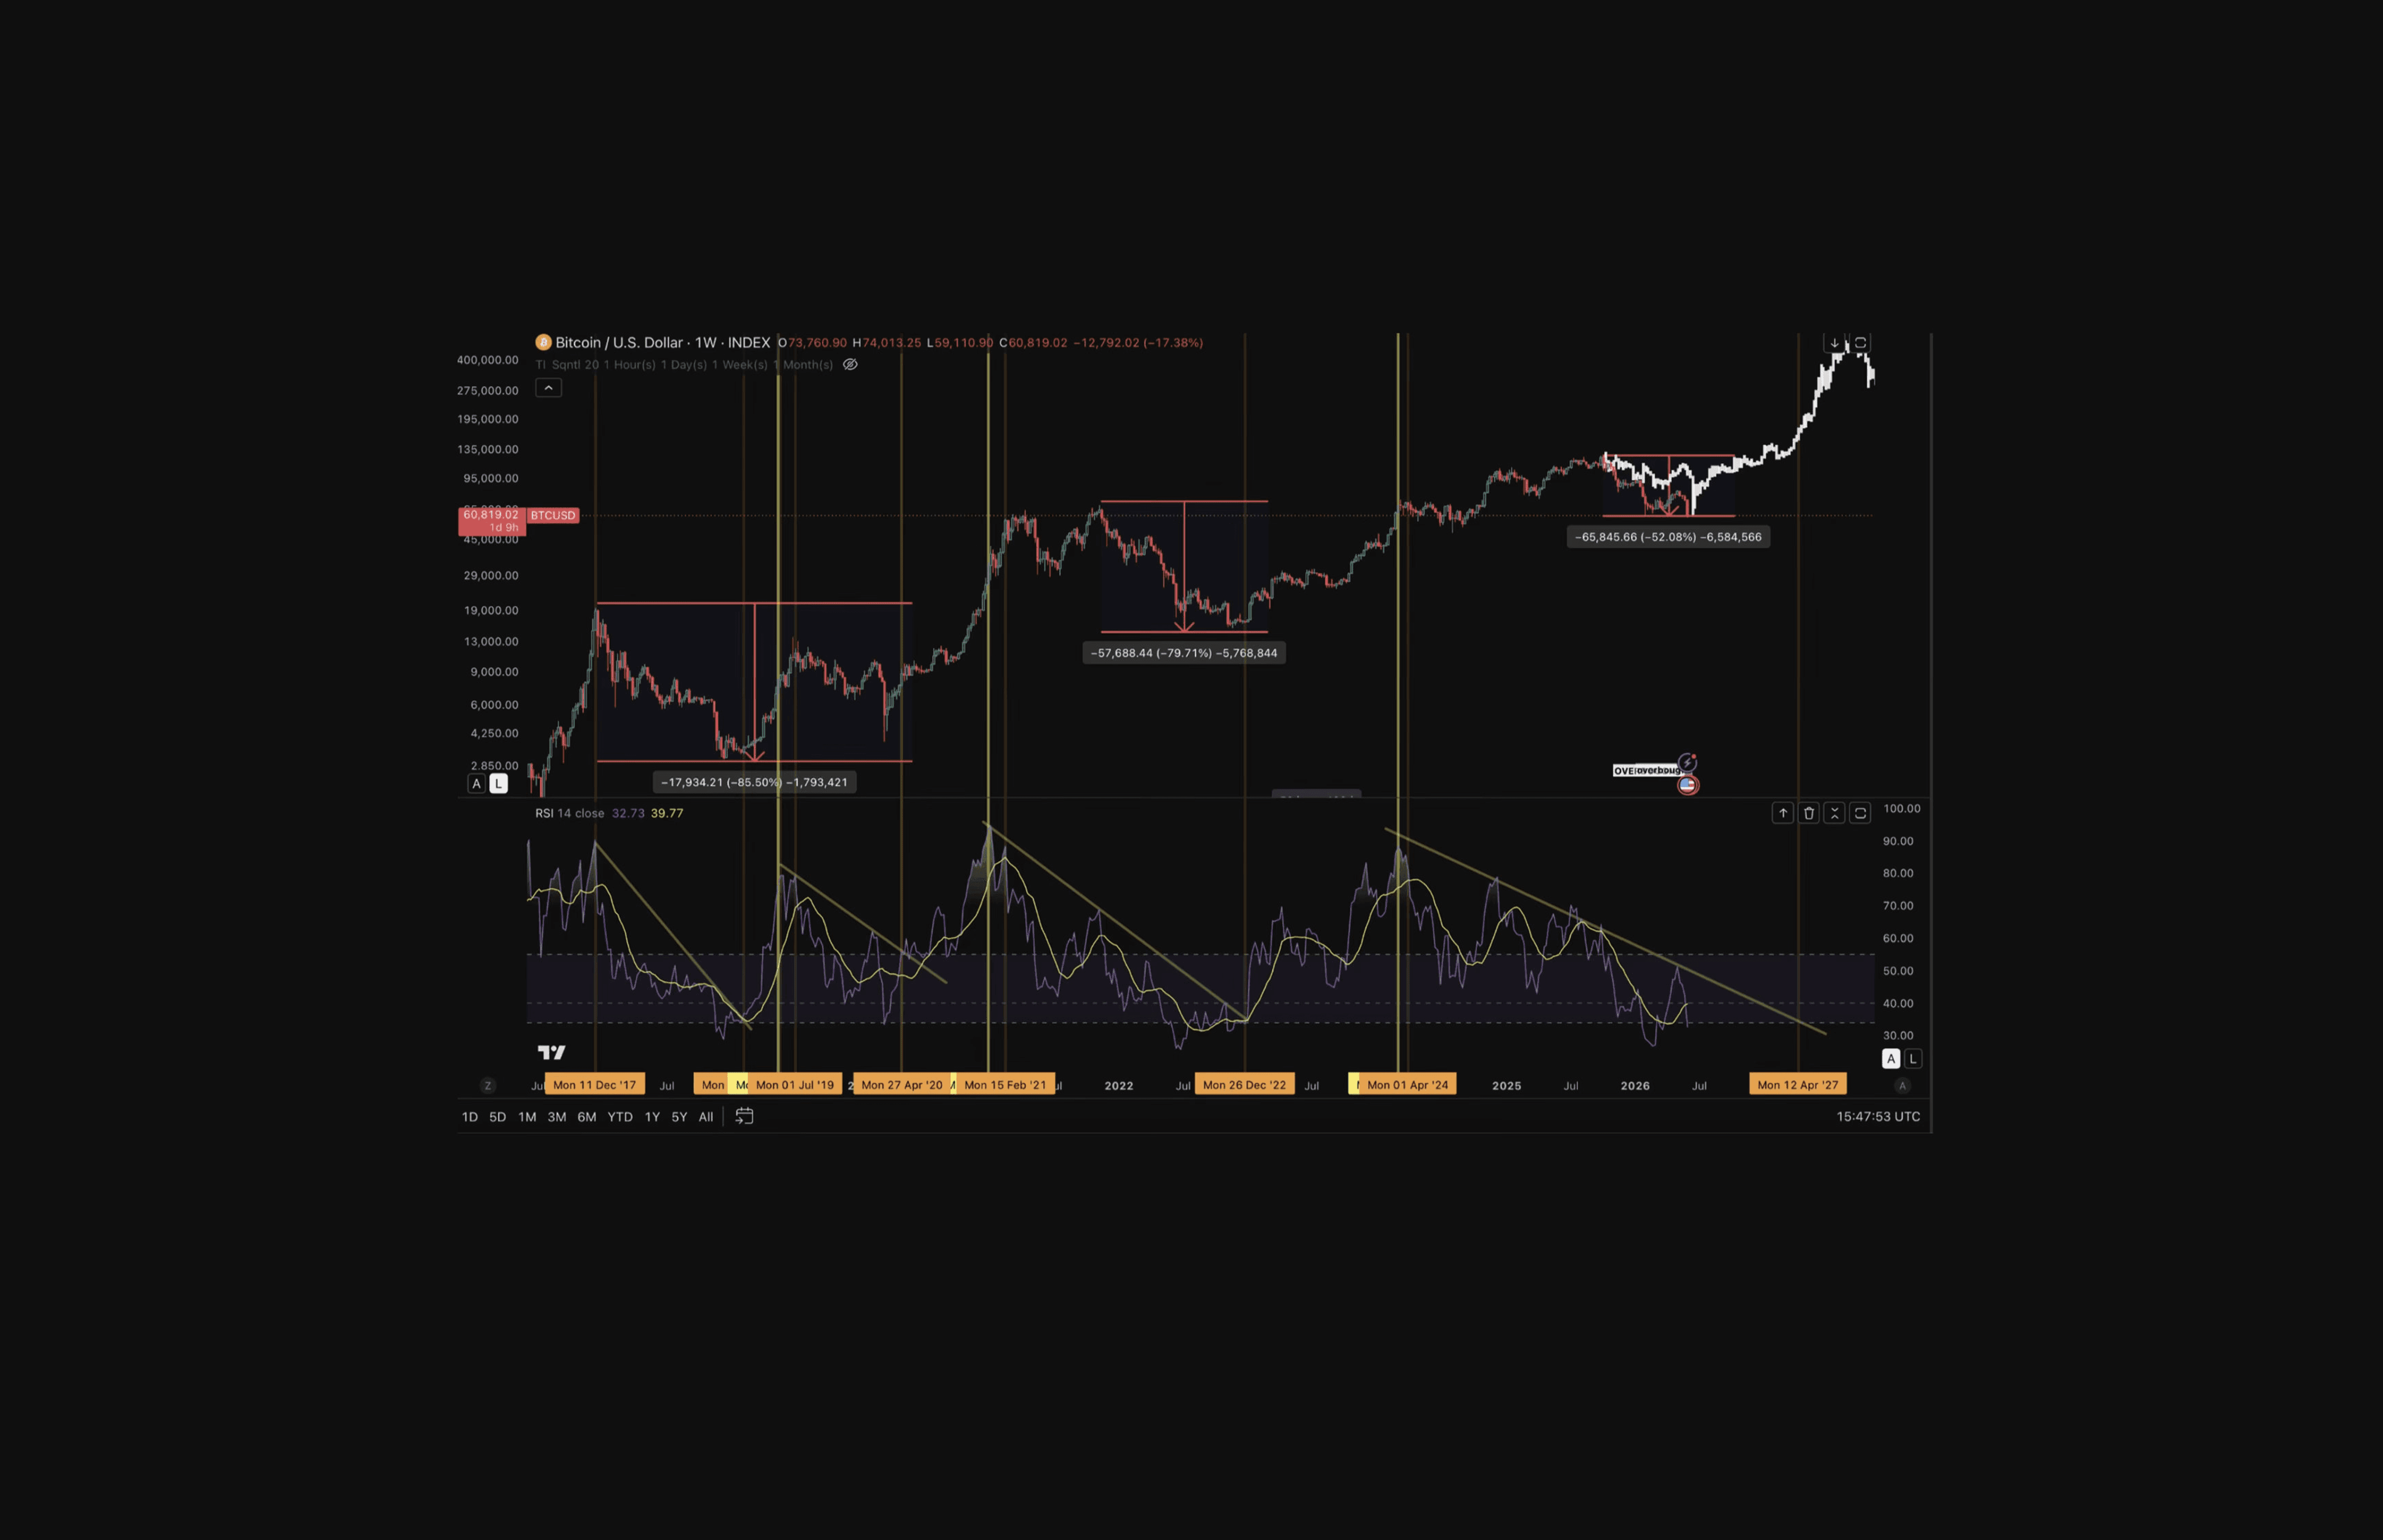
If Momentum Has Turned, History Shows Five Possible Paths
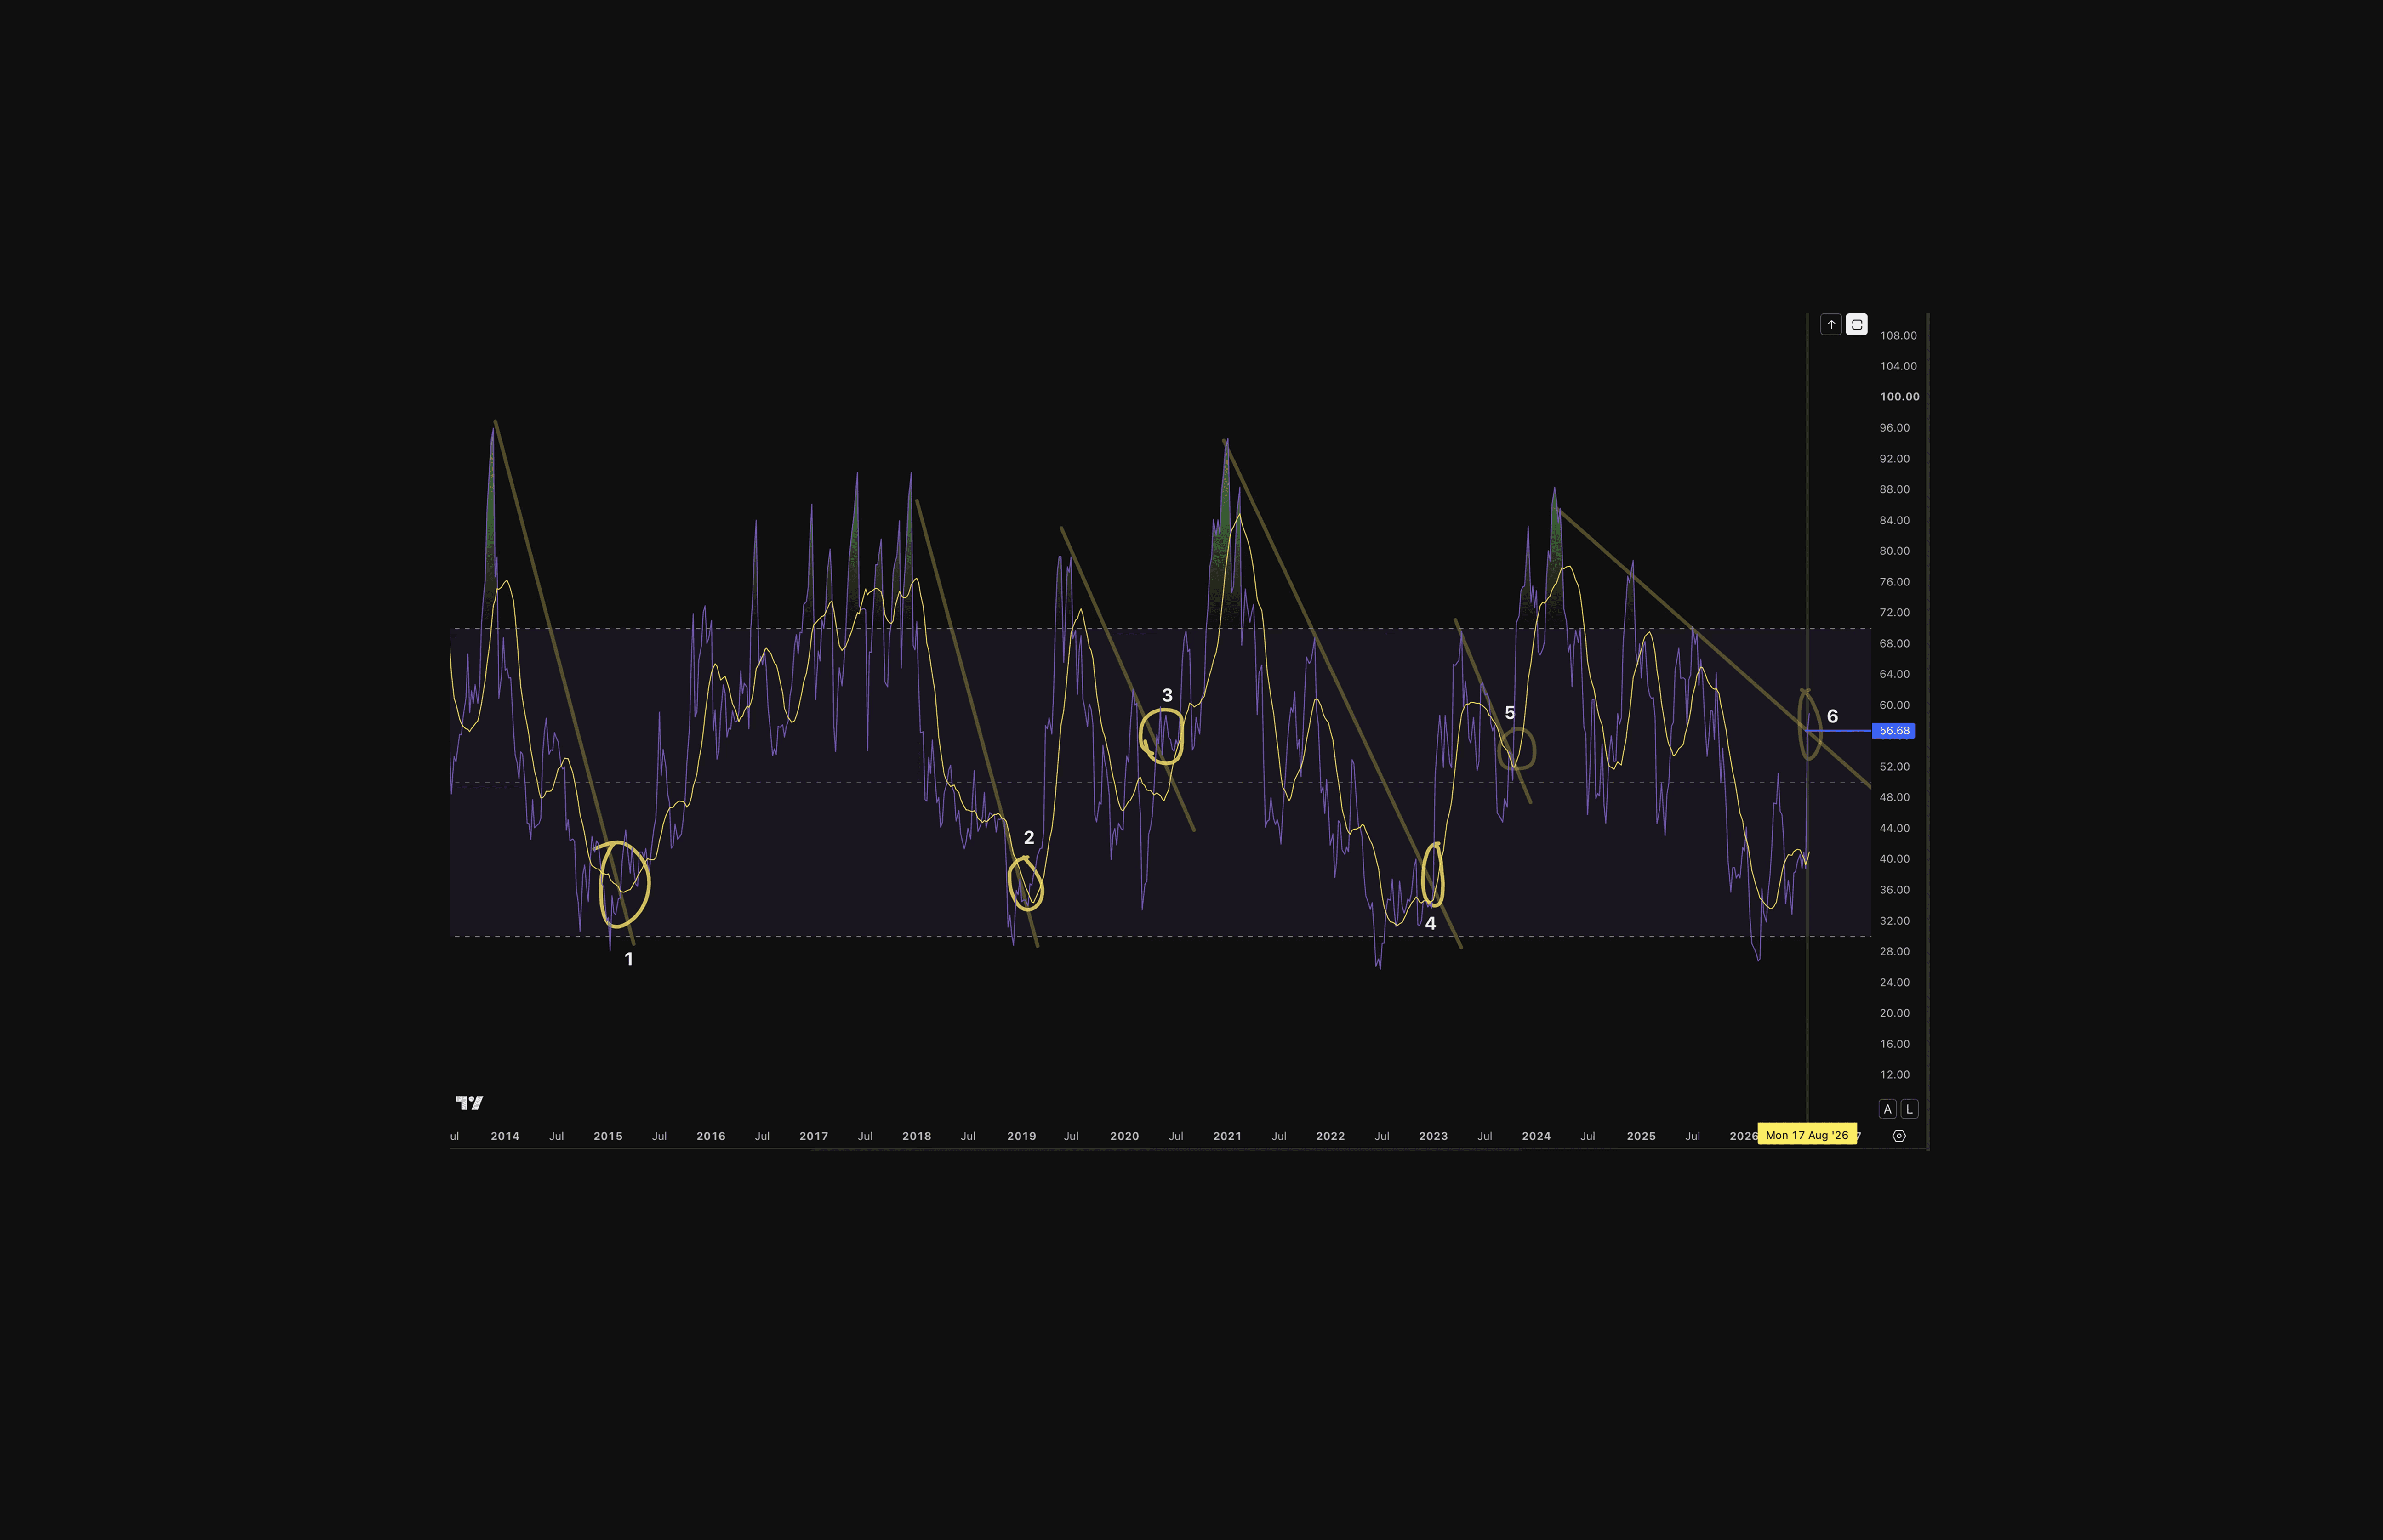
To compare historical price paths consistently, Coinjuice starts each fractal at the point where weekly RSI breaks above descending resistance. The six numbered points in the chart above mark those equivalent starting conditions.
Previous breaks: Points 1 through 5 mark earlier RSI breakouts measured using the same method and illustrated as the yellow circle in the RSI chart above.
Current attempt: Point 6 marks the weekly candle beginning August 17, with RSI near 58.
Higher momentum than prior levels: The current break is occurring at a higher RSI level than the five previous examples, consistent with a shallower correction.
Required confirmation: Weekly RSI must close and hold above resistance near 56.2. A reversal below it would weaken the breakout and the comparisons based on it.
Five Historical Routes: Four Point to New Highs One Holds a Bearish Outcome
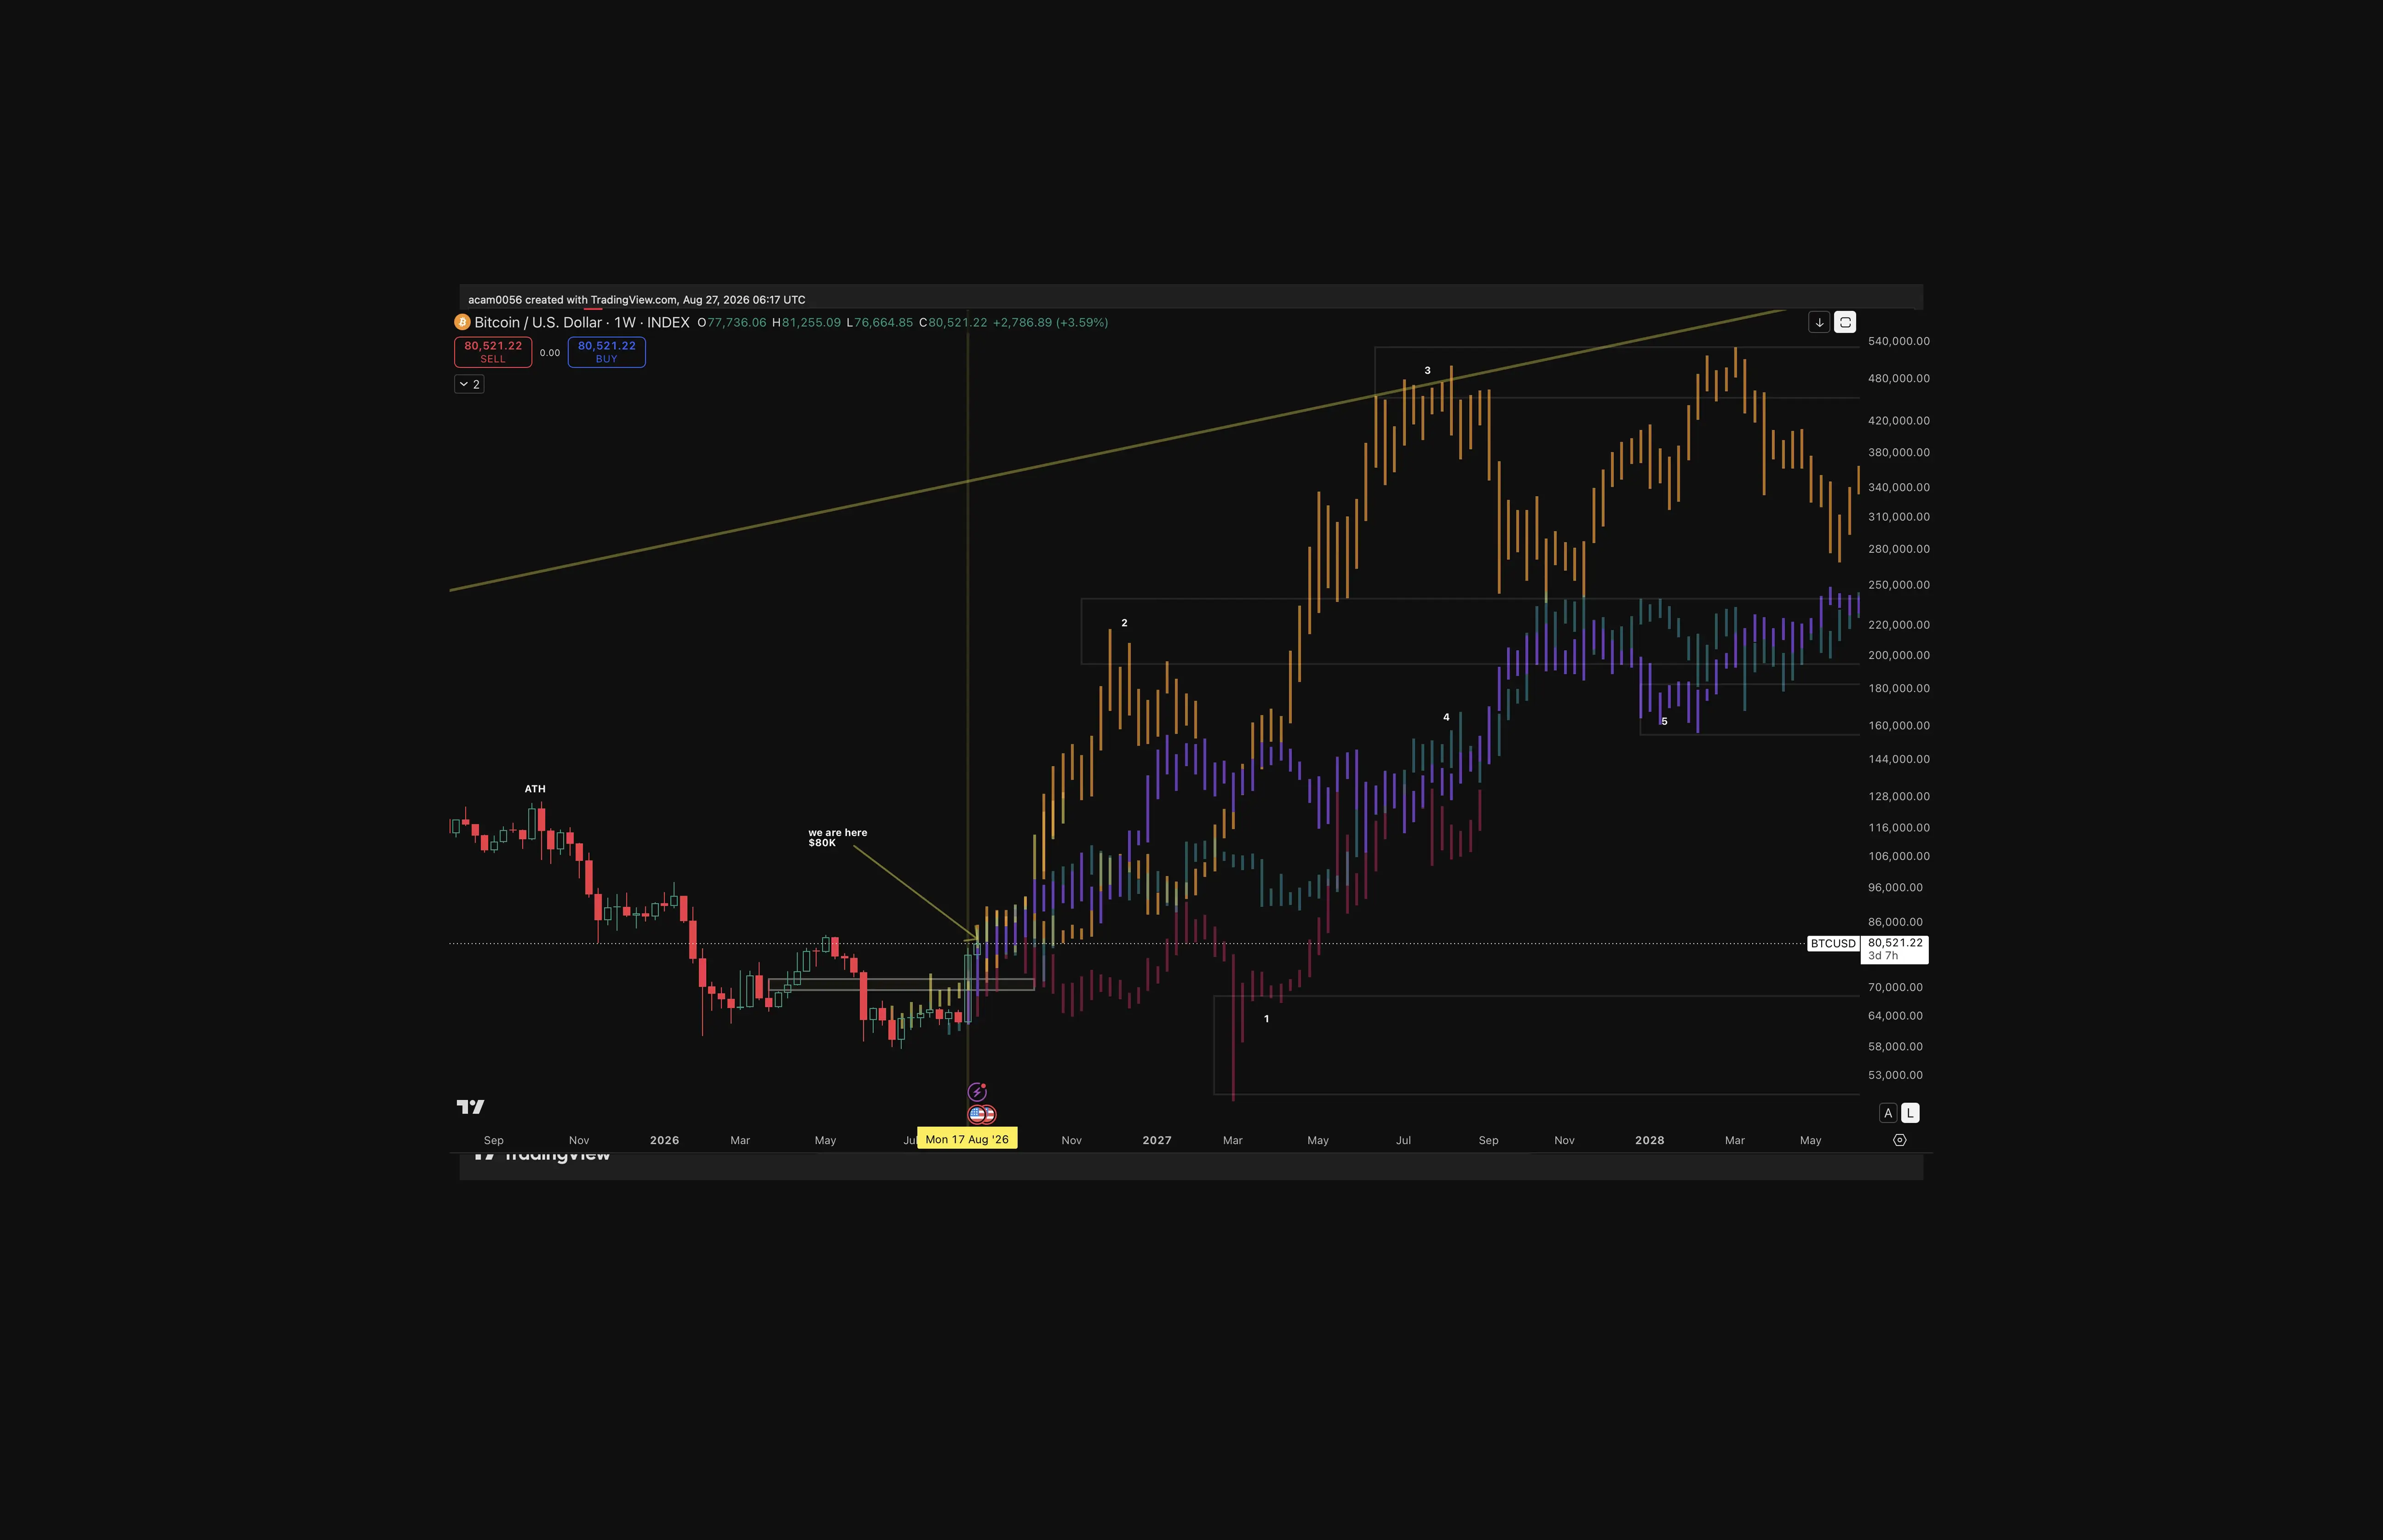
The RSI starting points can then be transferred onto price. Each coloured route shows what Bitcoin did after a comparable momentum break; none predicts what Bitcoin must do now.
Four routes moved higher: Paths 2, 3, 4 and 5 advanced without first falling below their starting lows.
One route fell first: Path 1, based on the 2014-2015 double bottom, produced a delayed lower low before recovering.
Delayed bearish outcome: If Bitcoin followed Path 1’s timing, another capitulation could emerge around March 2027. Failure to reclaim $100,000 by the first quarter would make this route more relevant, although it would not cause the decline by itself.
Recovery remained possible: Even Path 1 eventually recovered and moved above its preceding range after establishing the lower low.
Practical use: Each route provides a sequence and price area to monitor. Once Bitcoin materially stops following a route, the comparison should be removed rather than forced onto new price action.
Path 1, which produces a possible lower low around March 2027, keeps the comparison from becoming purely bullish. Paths 2, 3, 4 and 5 advanced without making another low, while Path 1 suggests Bitcoin may not yet have bottomed.
The five routes represent a small set of historical comparisons, not every possible outcome or evidence of an 80% bullish probability. Path 1 is also based on Bitcoin’s 2014-2015 market, when liquidity, infrastructure and participation were far less developed. Those differences reduce its direct comparability but do not remove the bearish outcome from consideration.
A Psychological Parallel, Not Technical Evidence
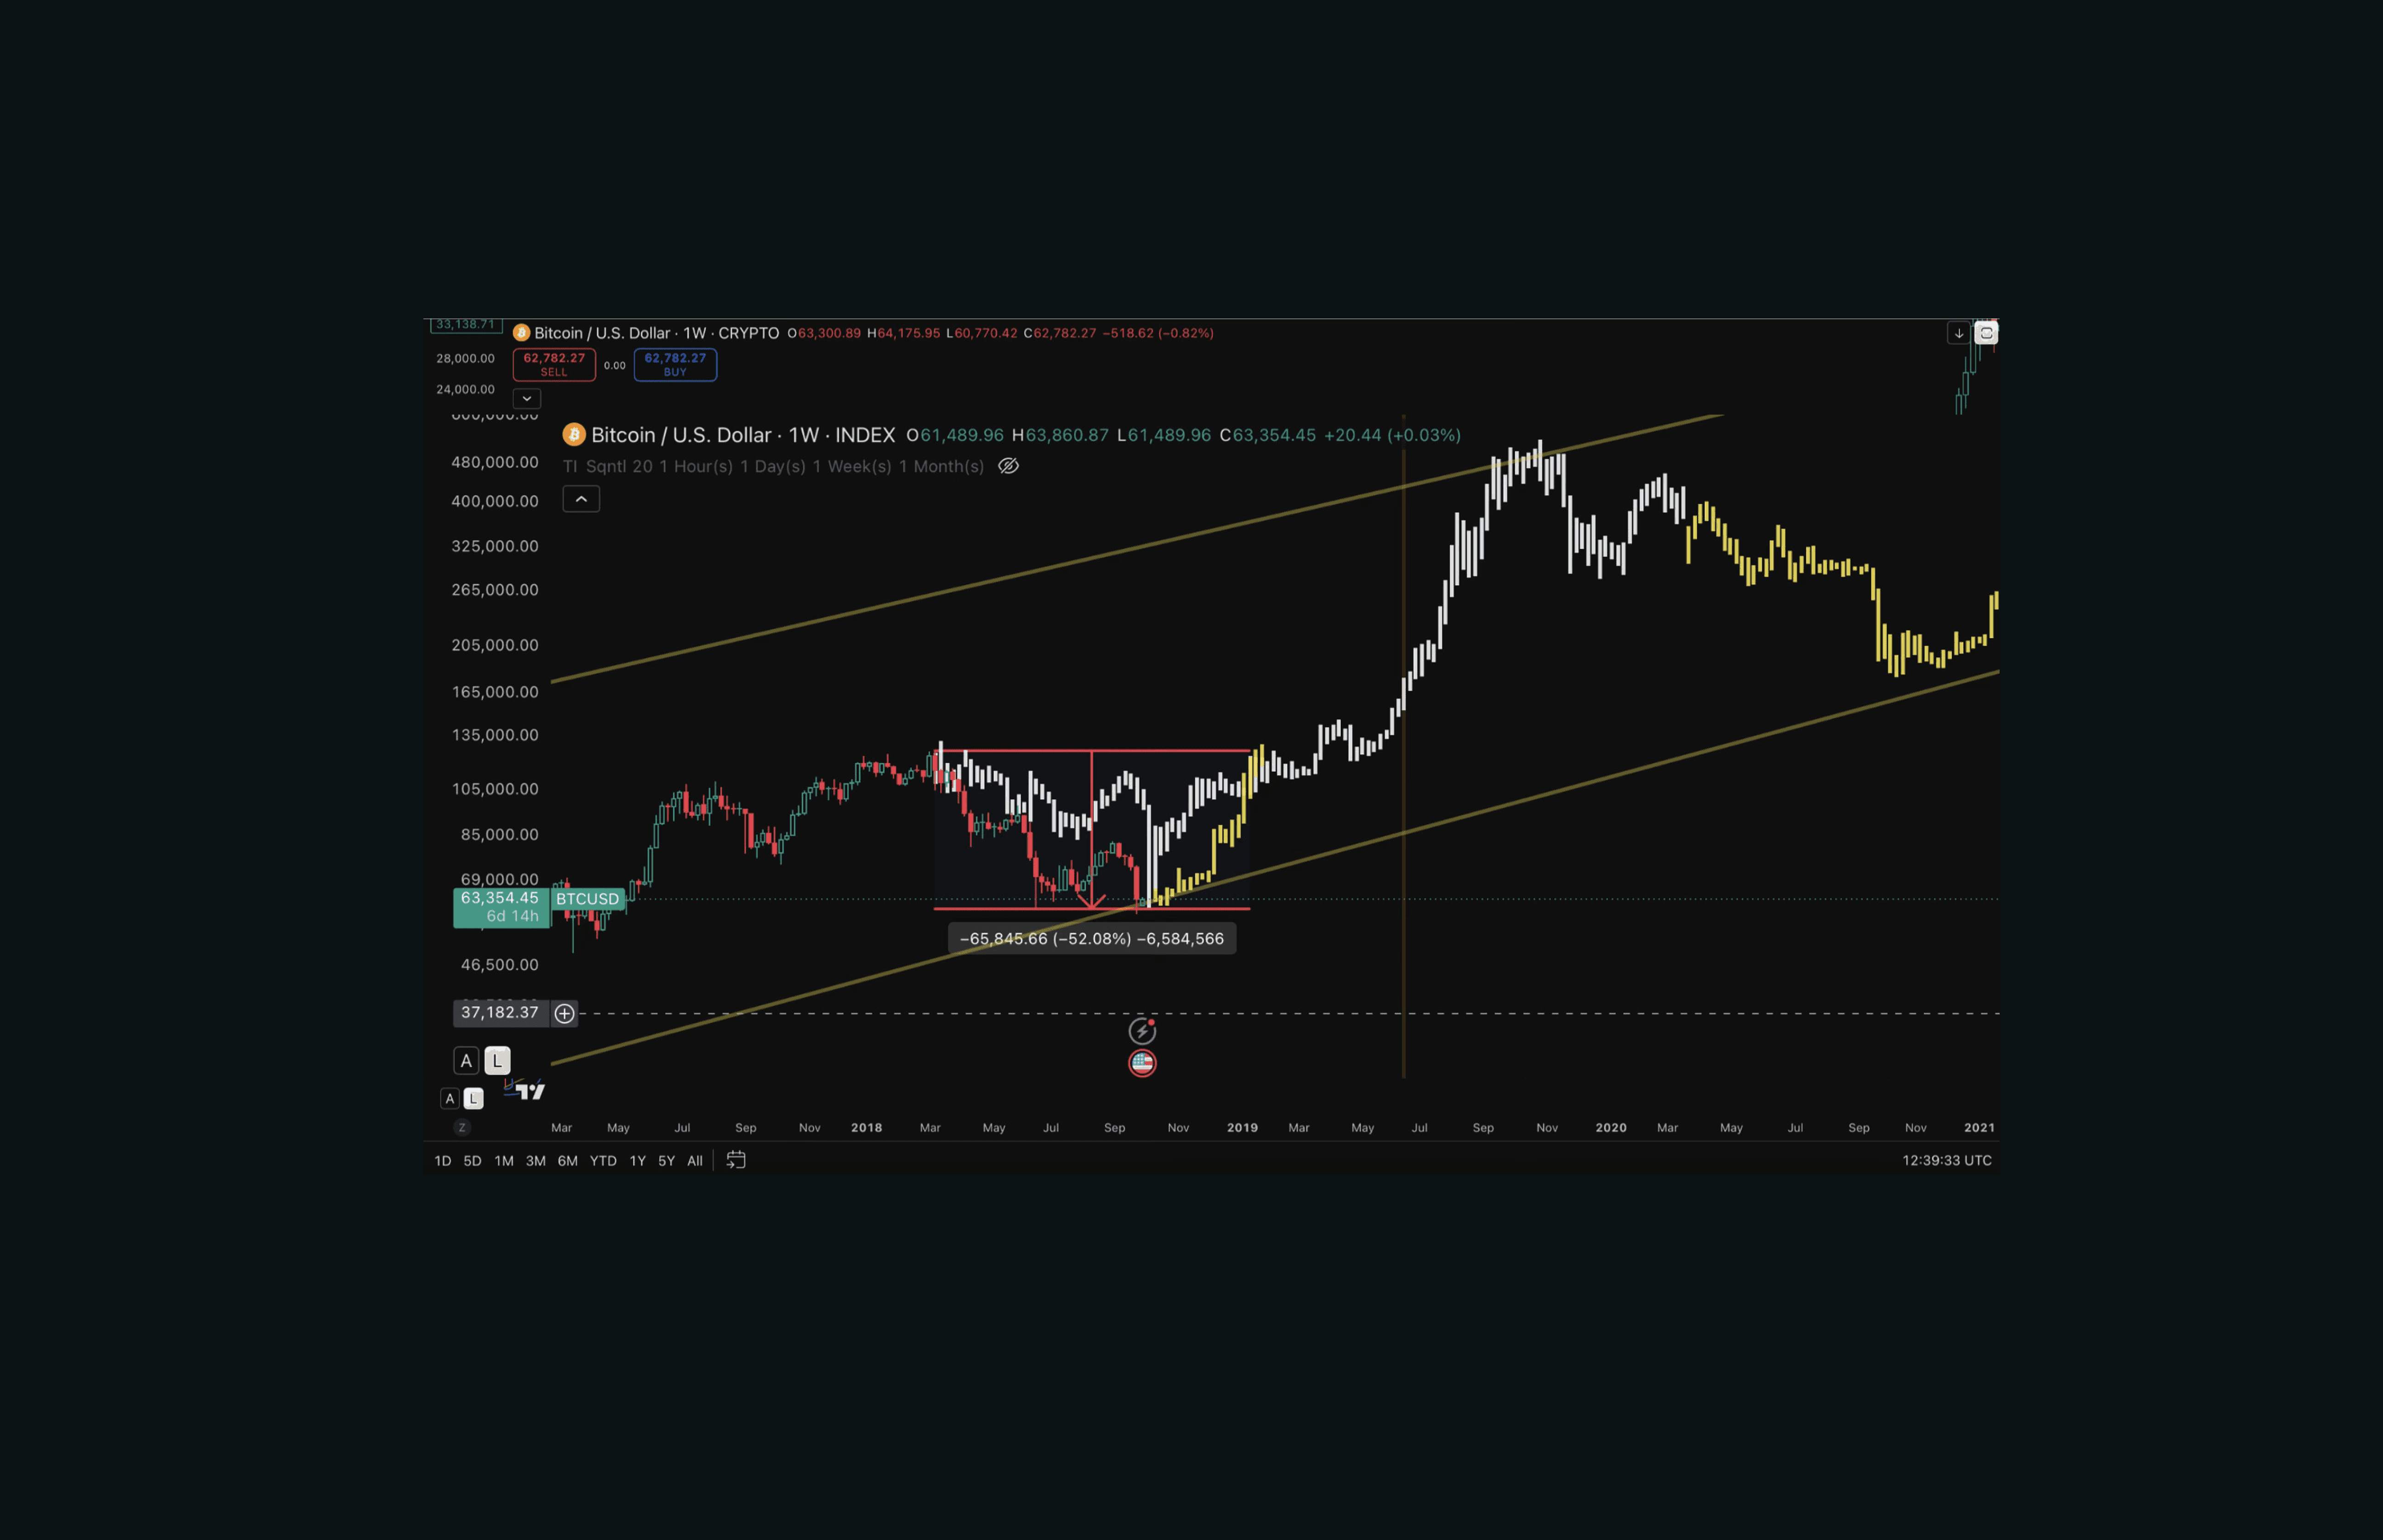
Bitcoin fell toward $0.58 after first crossing $1 in 2011. Fifteen years later, price fell toward $58,000 after first crossing $100,000. The matching number is probably a coincidence, but the investor experience may share a psychological similarity.
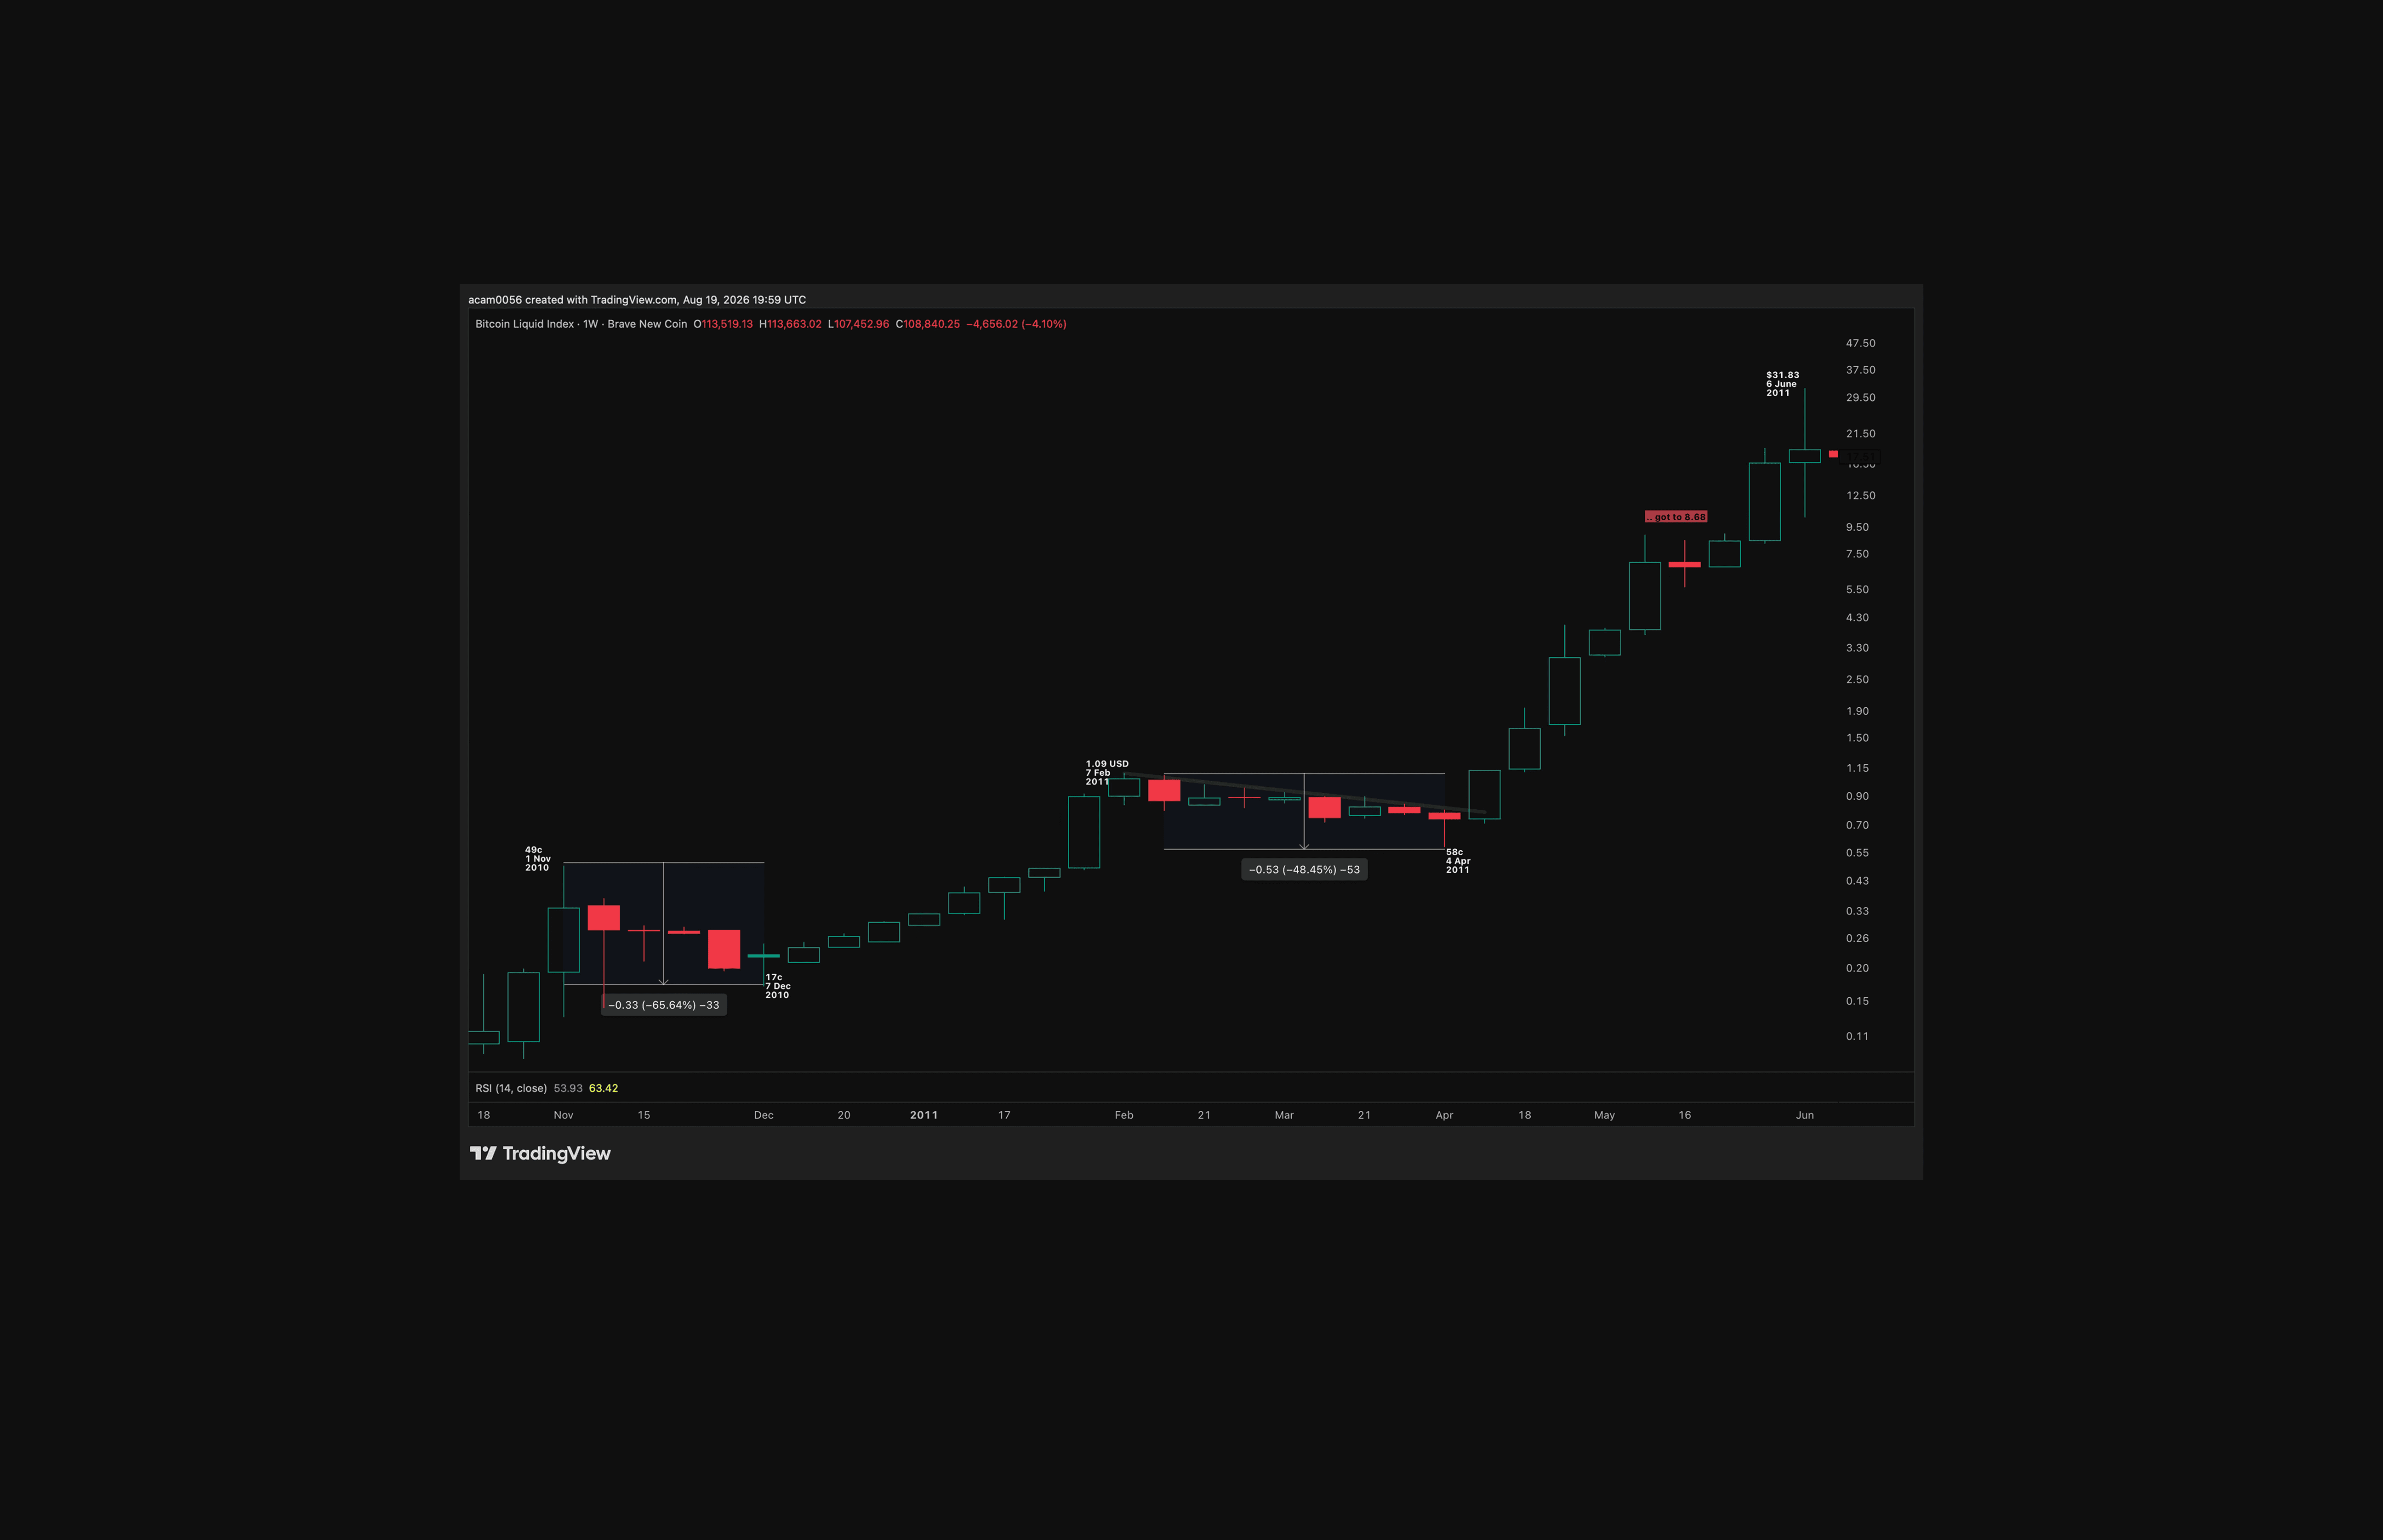
Major milestones: Both declines followed Bitcoin’s first move above a price level that had previously appeared difficult to reach.
Doubt returned: Investors in both periods questioned whether Bitcoin would recover above the milestone.
Different markets: Bitcoin’s size, liquidity and infrastructure changed substantially between 2011 and 2026.
Numerical coincidence: The repeated 58 is interesting, but it does not make the number a technical support level or forecasting tool. Just a fun comparison.
Short-Term Holder Cost Basis Defines a Retest Area
Short-term holder realised price estimates the average acquisition price of recently active Bitcoin supply. When market price moves above it, the average recent buyer returns to profit.
Cost basis reclaimed: Bitcoin is trading above the short-term holder realised price.
Reduced pressure: Recent buyers in aggregate have less incentive to sell simply to escape a loss.
Potential retest: A pullback toward approximately $71,000-$73,800 could test this cost basis, although price does not need to revisit it.
Structure to watch: A rebound from the area above the preceding swing low would establish another higher low.
Weakness: Sustained trading below realised price would show that recent buyers had returned to an aggregate loss and would weaken the recovery.
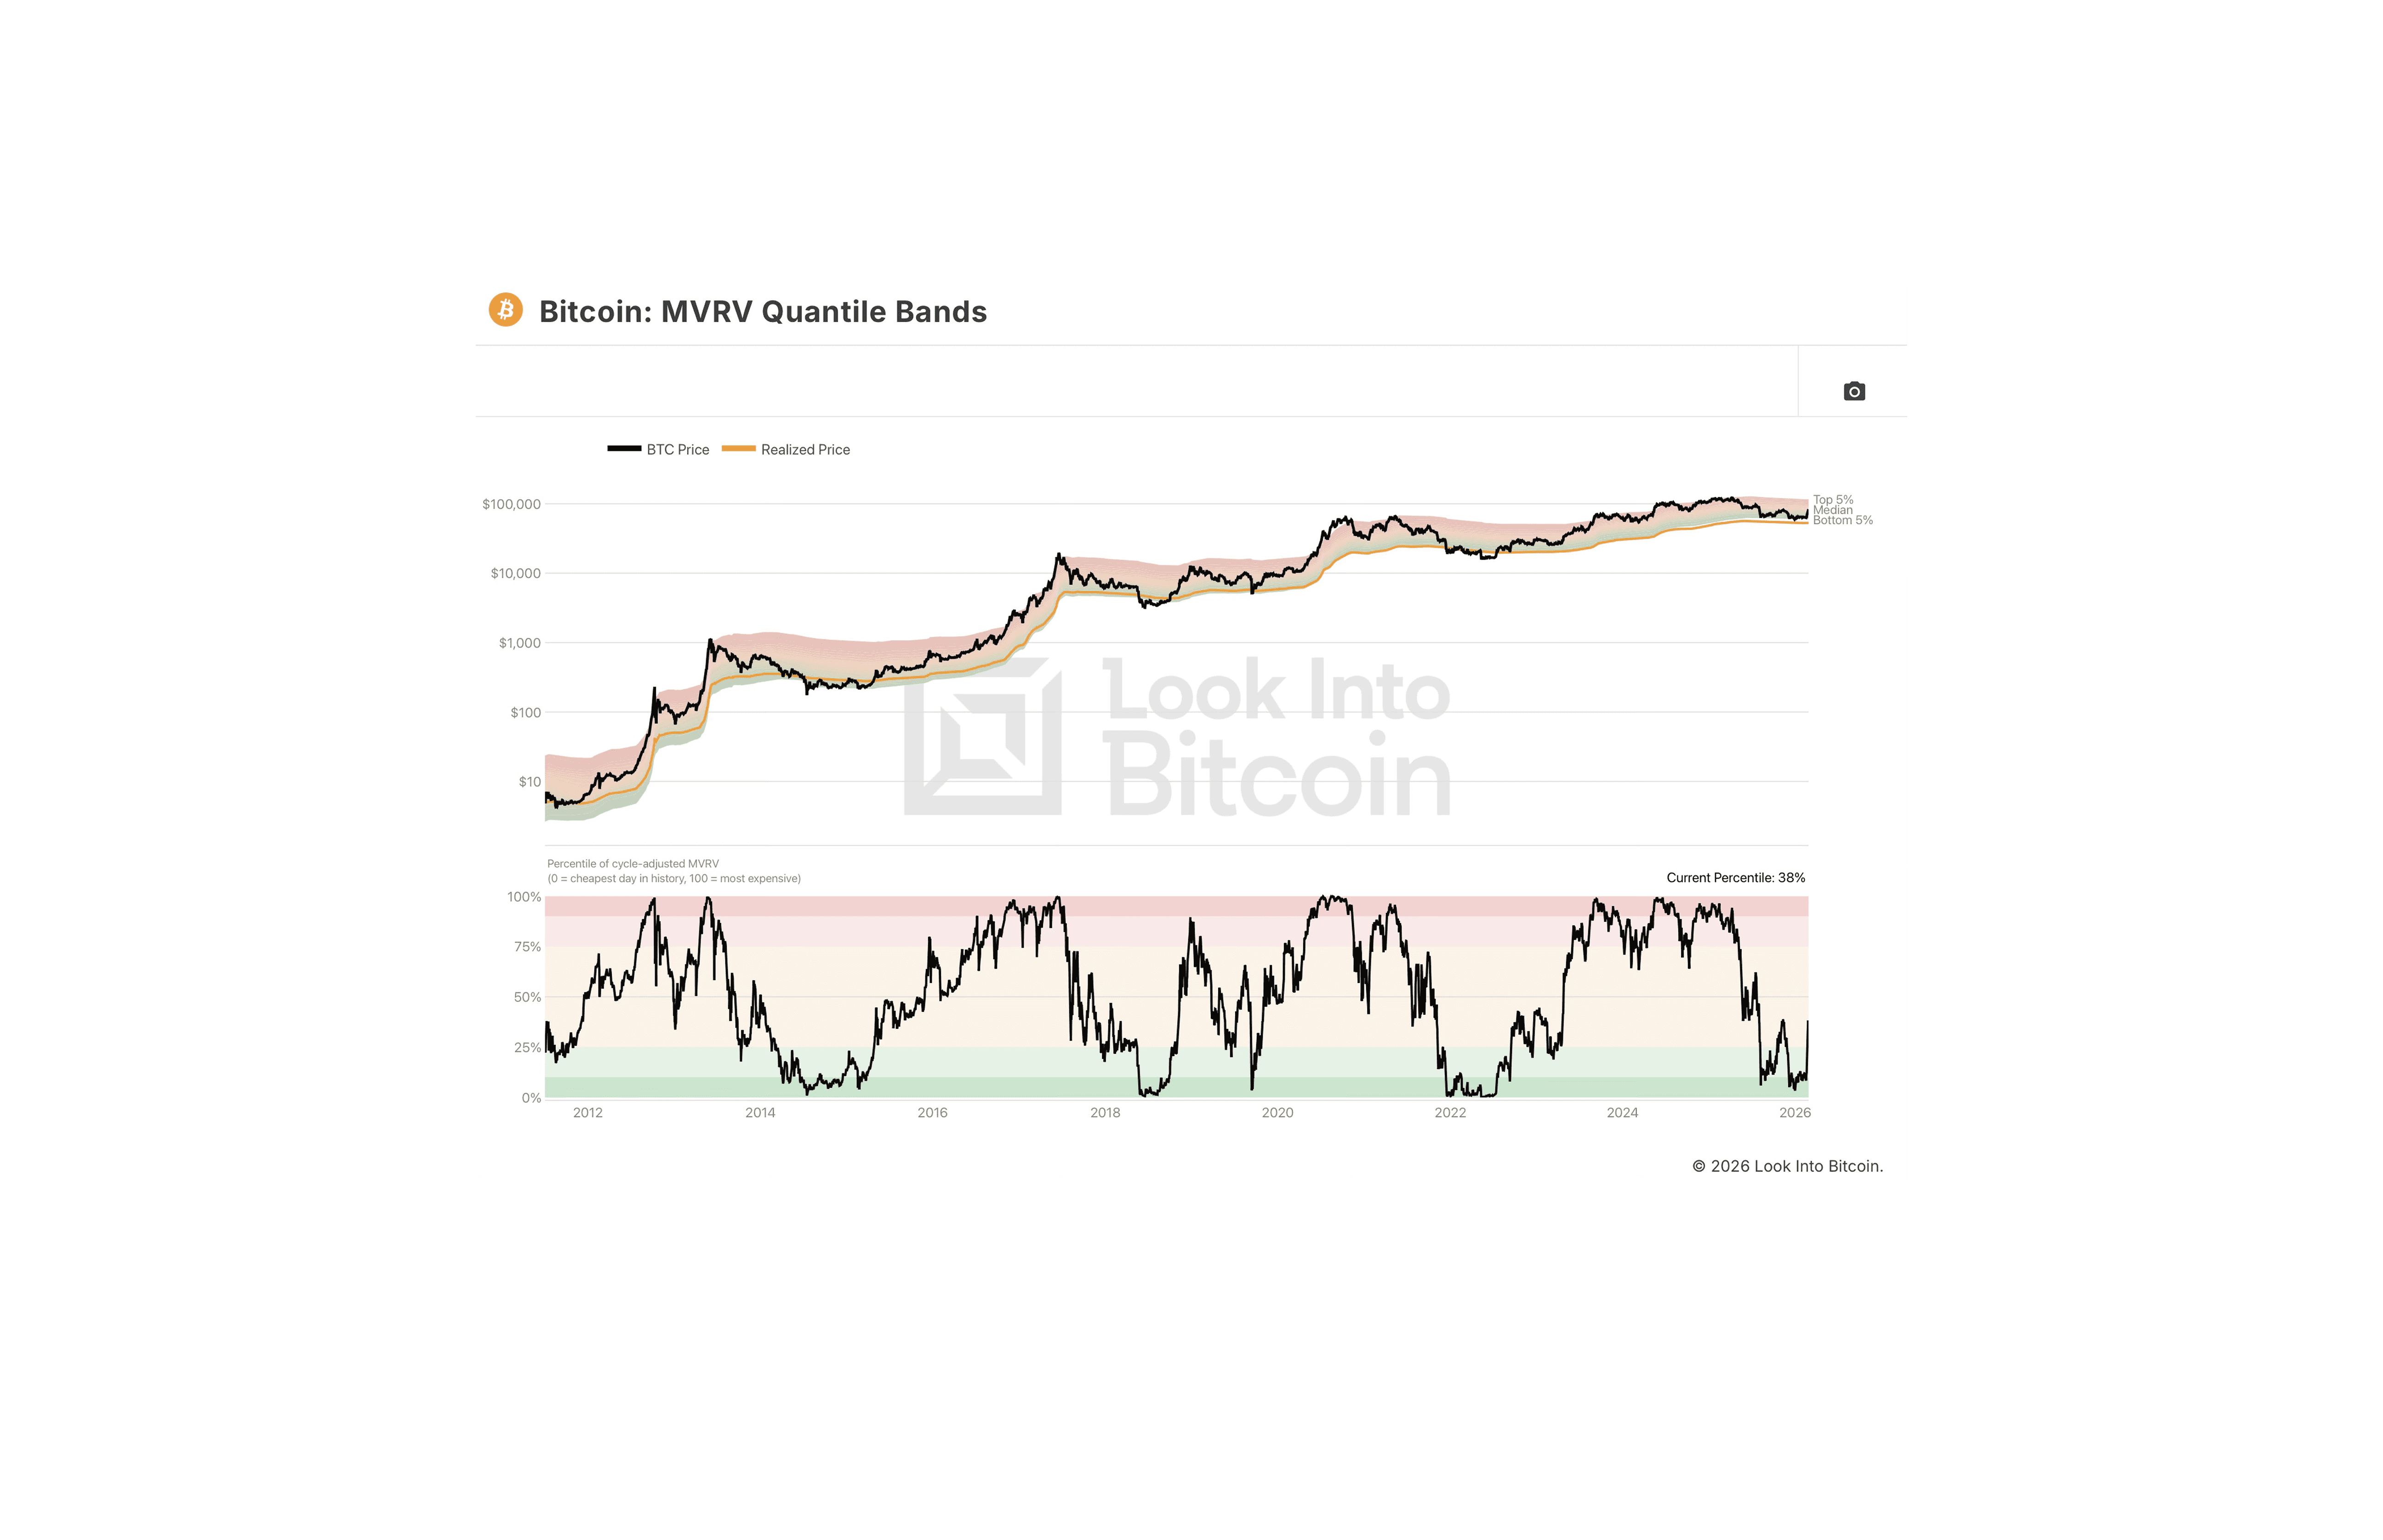
MVRV Shows a Reset, Not an Extreme Discount
Bitcoin's cycle-adjusted MVRV percentile fell into its lower historical bands during the decline and has since recovered to approximately 38%.
Below the midpoint: The current reading remains in the lower half of Bitcoin's historical cycle-adjusted valuation range.
Pressure easing: The rebound from the cheapest bands suggests that the most severe valuation compression may have passed.
Limitation: Bitcoin is no longer in its lowest historical zone, so MVRV supports a valuation reset rather than proving the final low.
Bitcoin Priced in Gold Supports Relative Strength
Bitcoin currently buys approximately 17 ounces of gold. Pricing Bitcoin in gold helps distinguish an increase in purchasing power from a rise that may partly reflect weakness in the US dollar.
Symmetrical formation: The BTC/gold ratio has moved above descending resistance, carrying a measured objective near 27 ounces.
Ascending formation: A wider structure produces a second objective near 24 ounces.
Dollar equivalents and timing: At gold’s stated chart price of $4,616, the symmetrical-triangle objective of 27 ounces would value Bitcoin near $124,632, with the chart pointing toward October 2026. The wider ascending-triangle objective of 24 ounces would value Bitcoin near $110,784, with timing extending into March 2027. These dates are chart estimates, not fixed deadlines.
Confirmation: The weekly ratio must close and hold above the breakout area near 17 ounces.
Failure: A return inside the formation would weaken the projections. A crack below the ascending support line followed by a failed recovery from underneath would invalidate the chart pattern.
The October 2026 and March 2027 markers estimate when each measured path could develop. They are not deadlines, and the 24-27-ounce range remains a chart projection.

How Bitcoin Has Marked Previous Bear-Market Lows
Each example below uses a three-day chart, meaning every candle represents three days of price movement. The comparison records the initial wick-to-wick reversal, whether the low held and how long price required to leave the wider recovery range.
The chart readings illustrate market behaviour rather than a mechanical bottom formula. Earlier data may also differ slightly between exchanges.
2011: Bitcoin's First Reversal
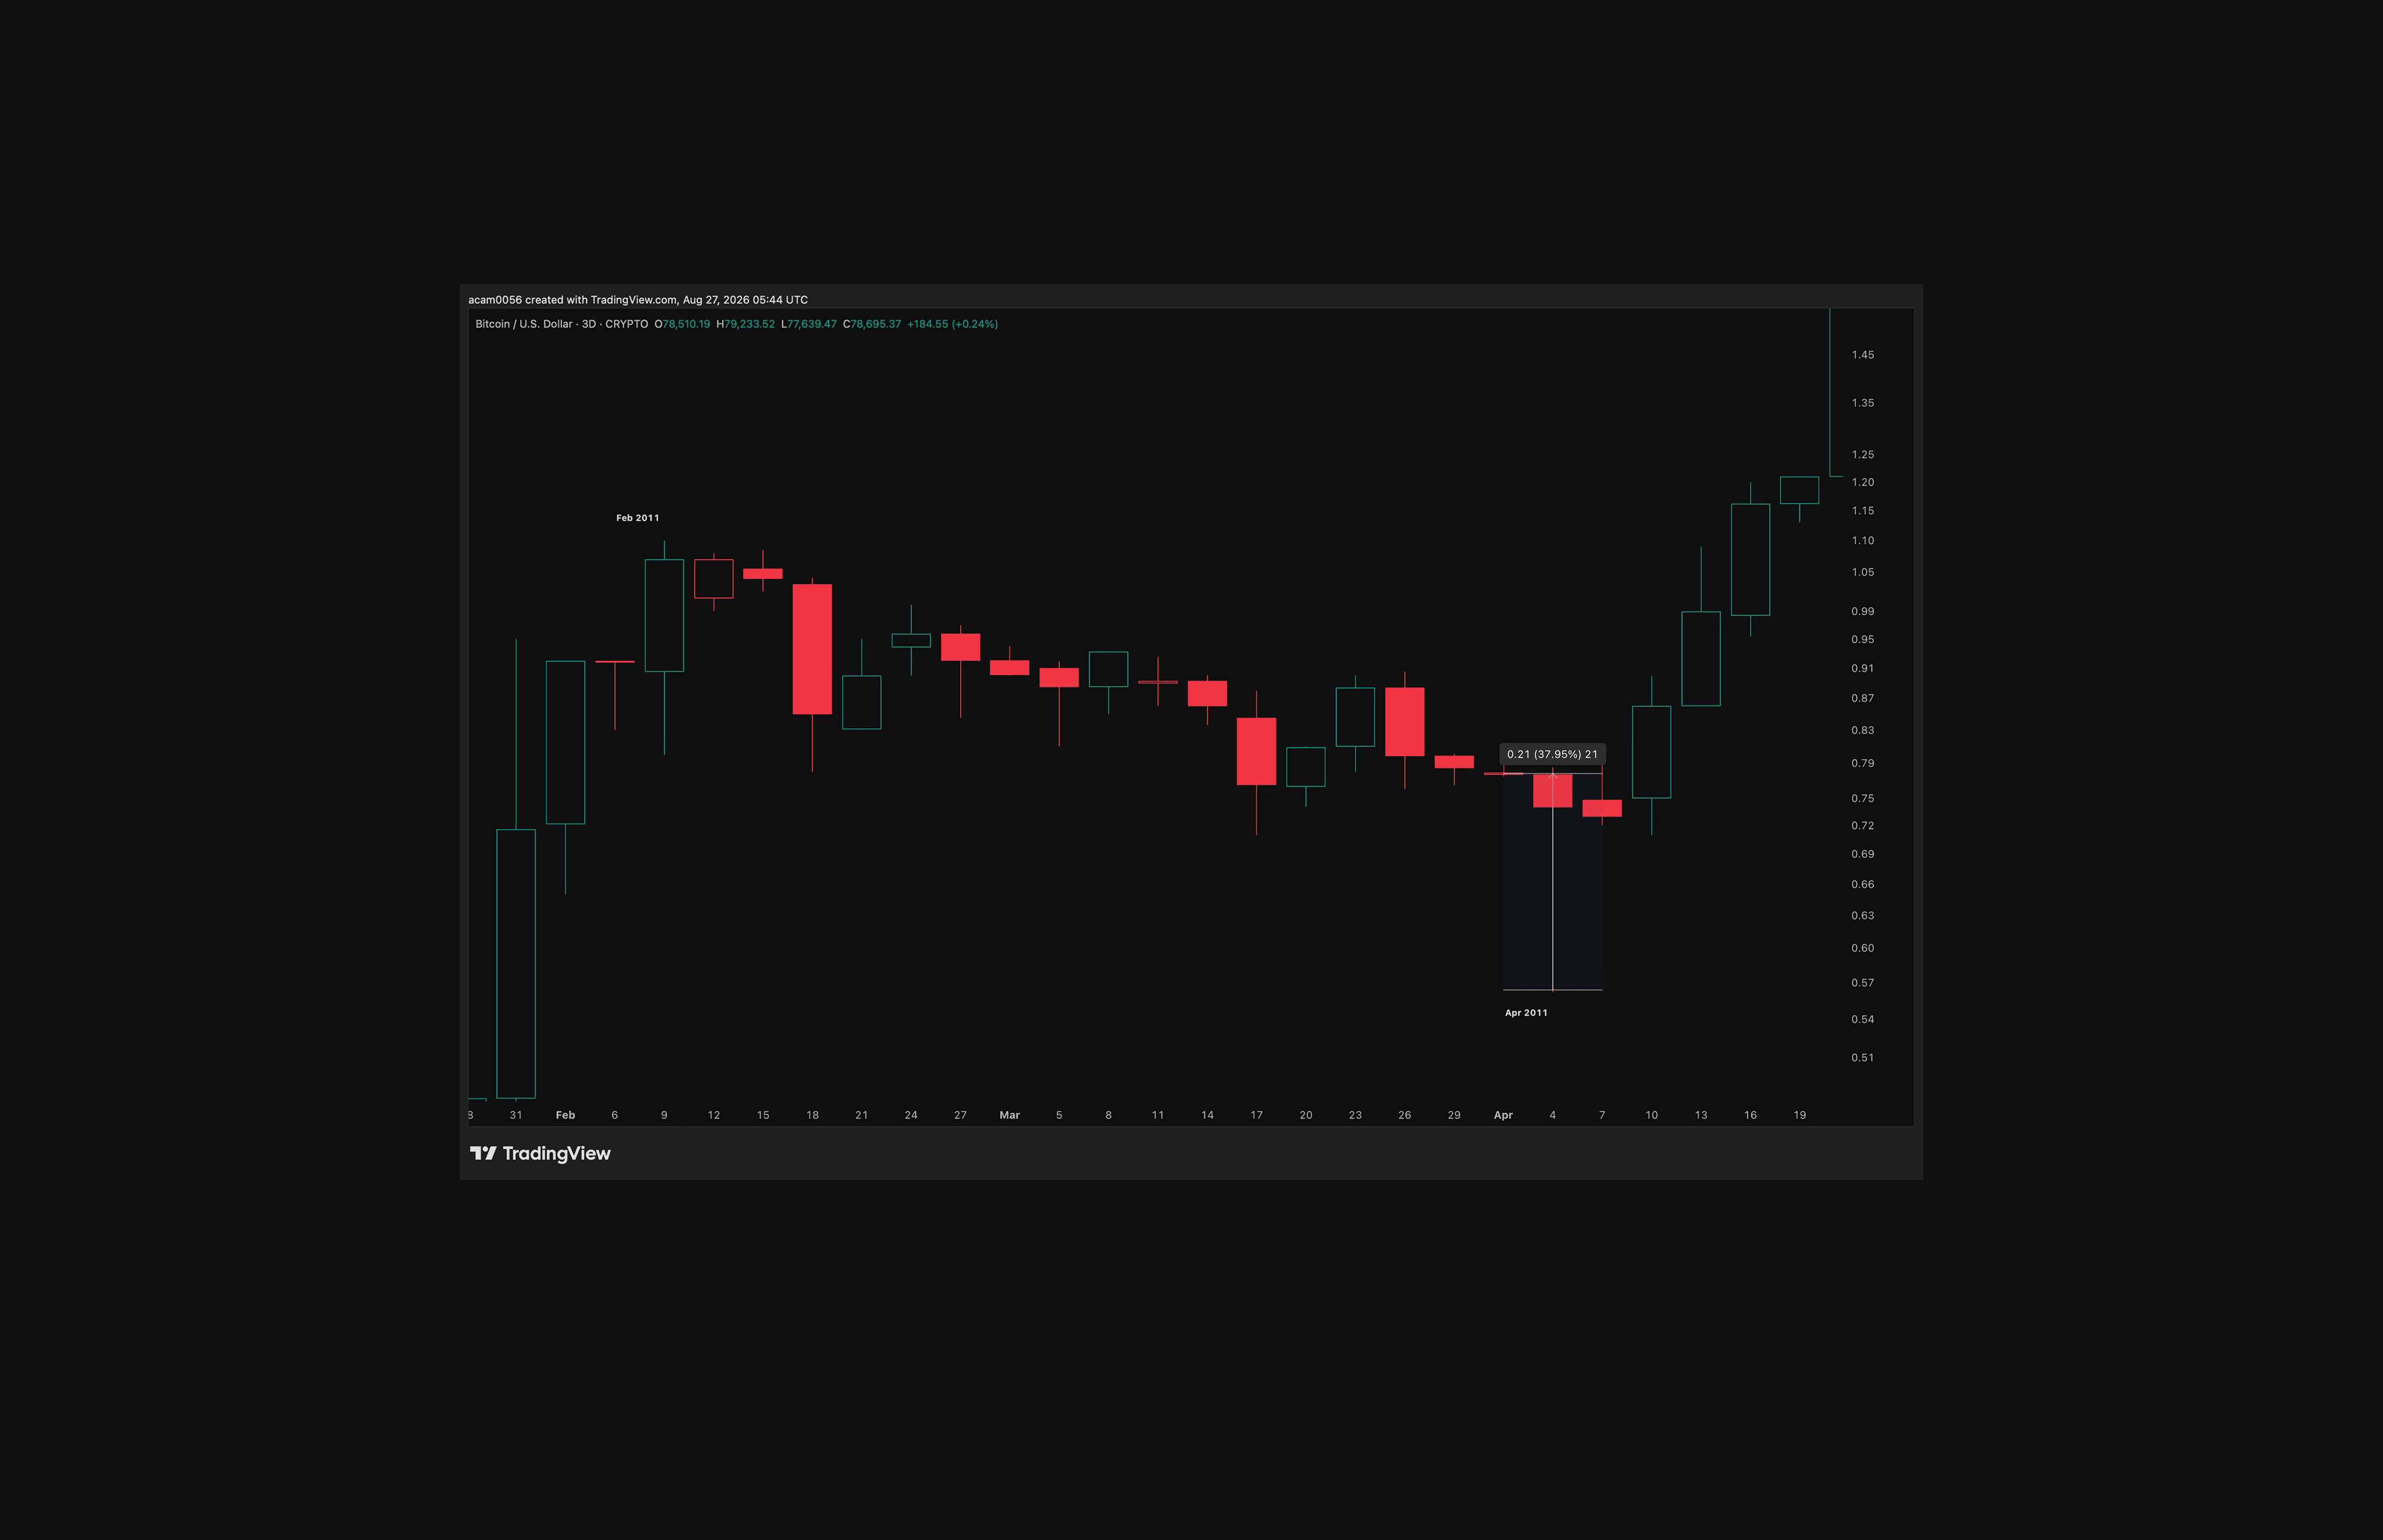
Initial rise: The April marking candle rebounded approximately 38% from its low.
Hold: The following three-day candle remained above the low.
Break: Bitcoin moved above the marking candle's high six days after the low.
Outcome: Price continued higher after the reversal range was cleared.
2011: Bitcoin's Double Bottom
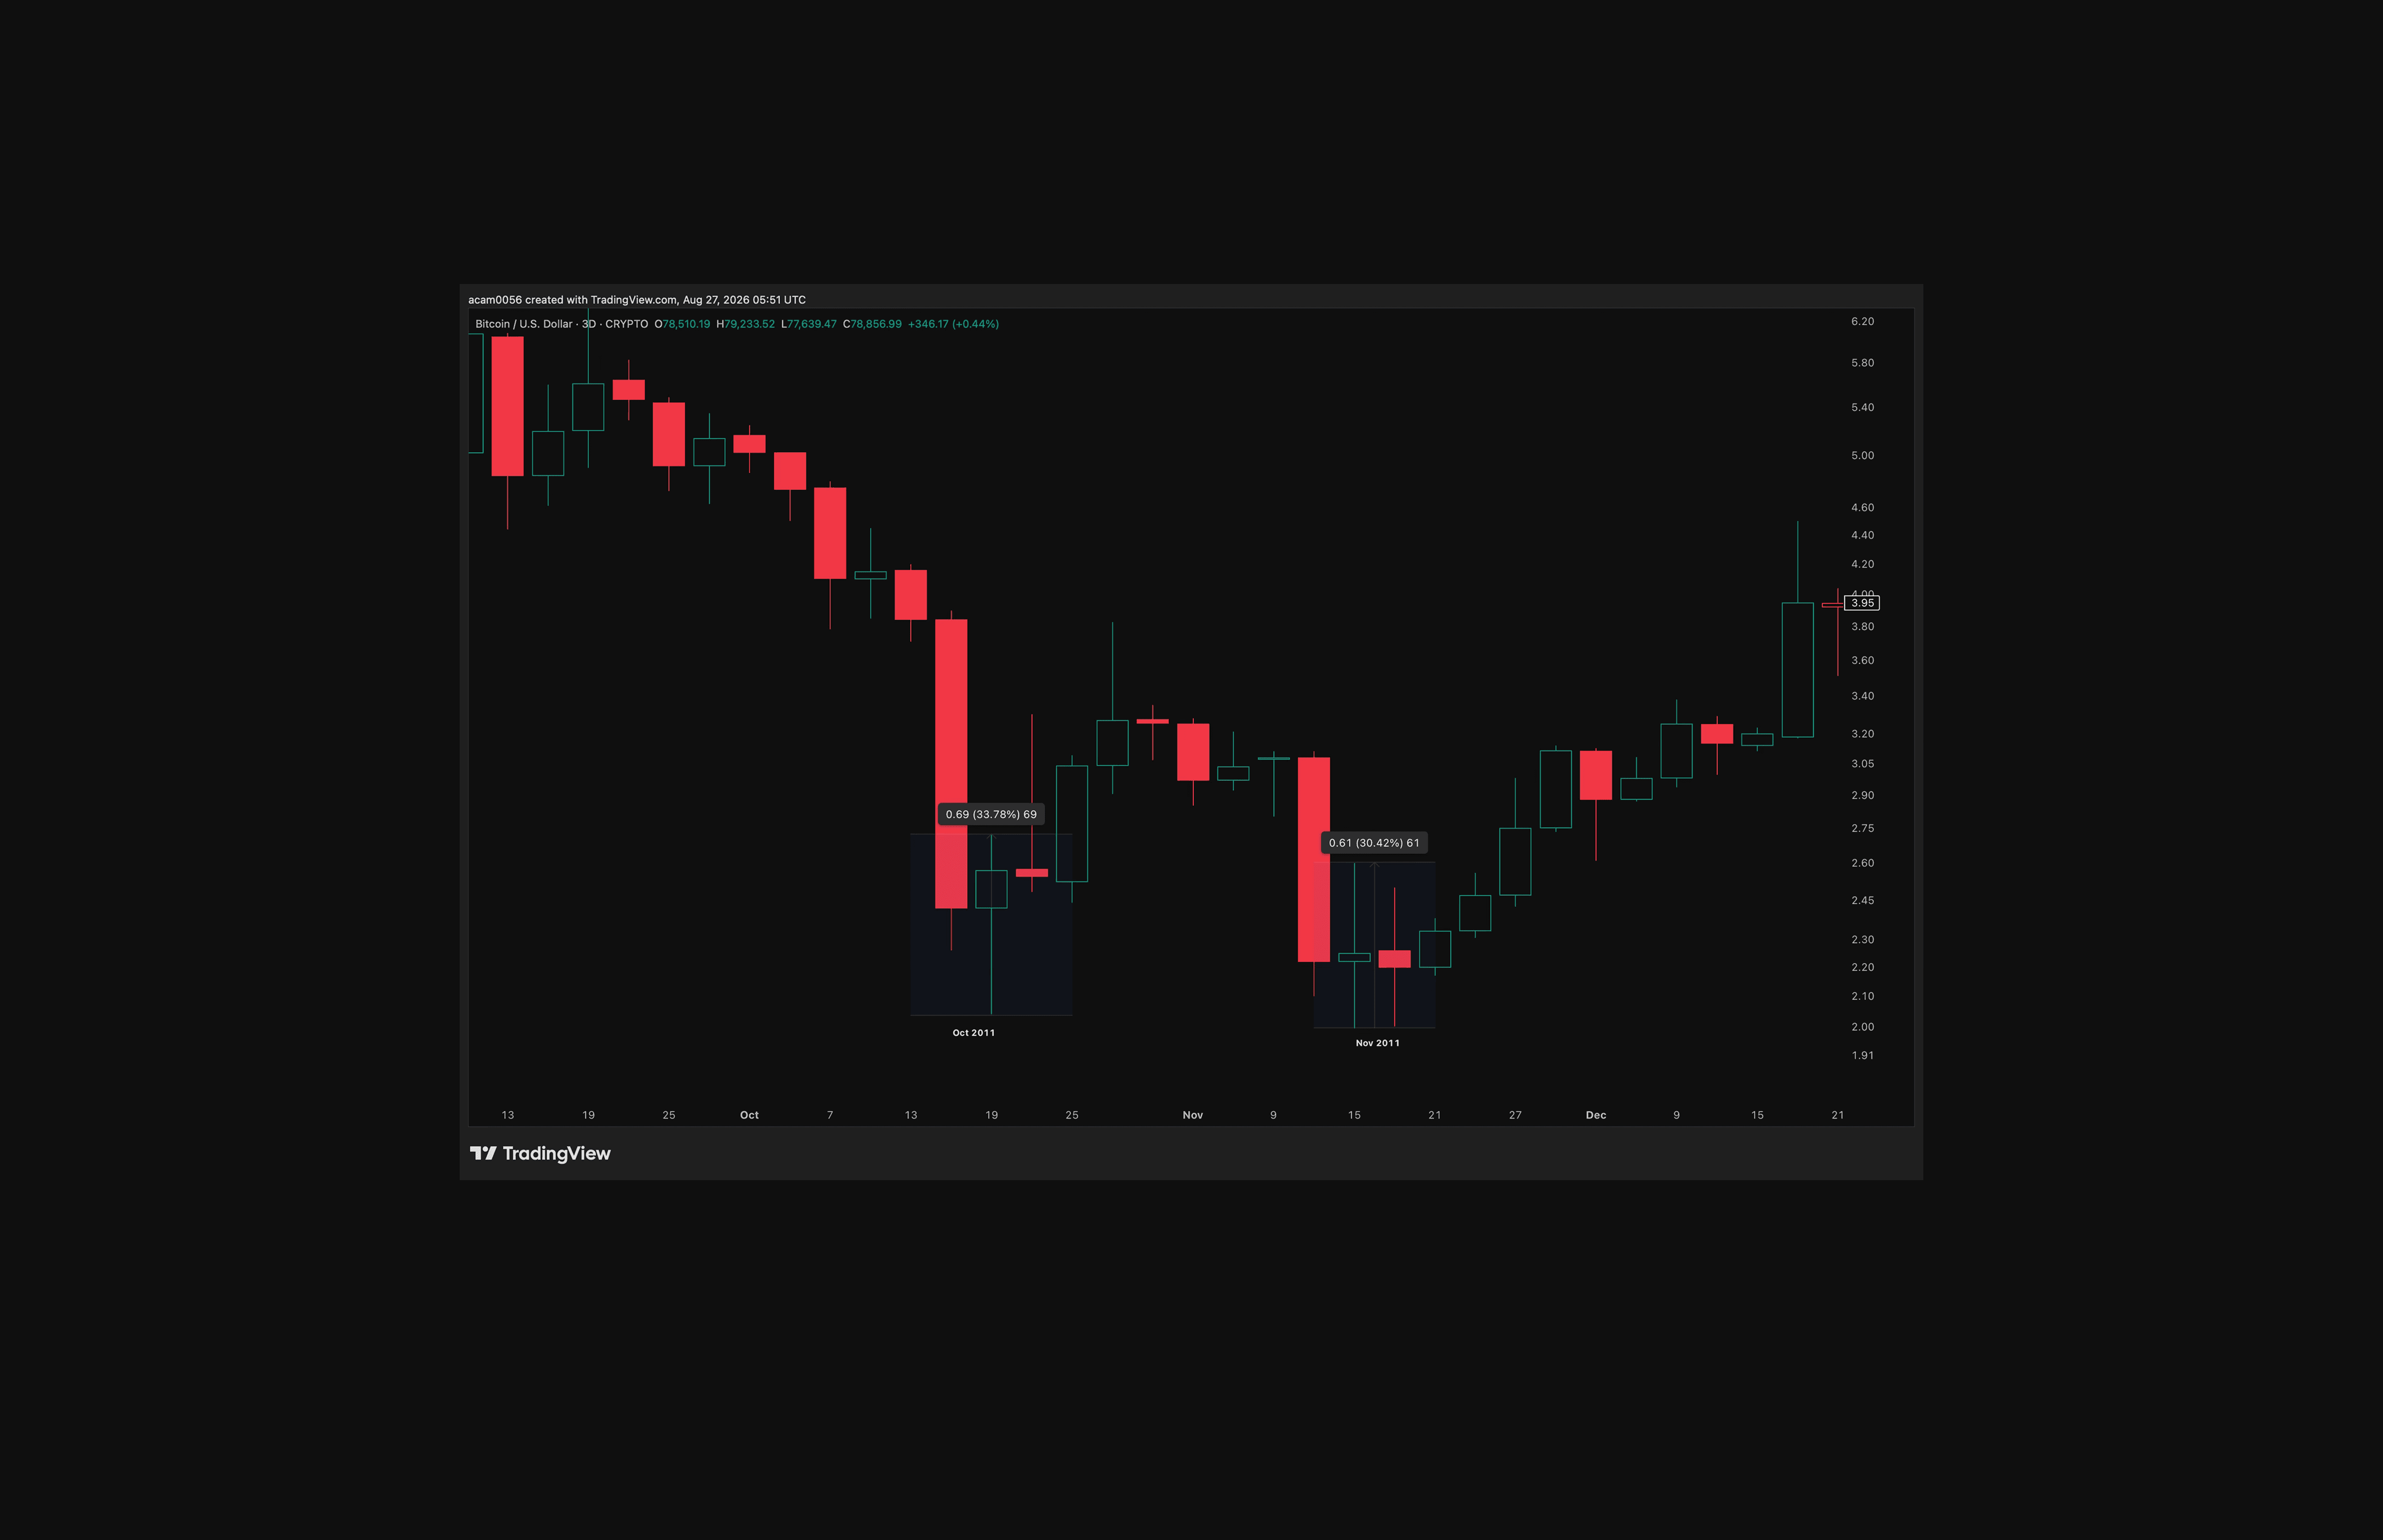
First rise: The October reversal gained approximately 34% wick to wick.
Hold: Price returned to the same area in November without decisively breaking the October low.
Second rise: The November reversal gained approximately 30%.
Break: Bitcoin cleared the second reversal range within four three-day candles.
Outcome: The defended area completed a double bottom before price advanced.
2015: Two Similar Reversals, One Lasting Low
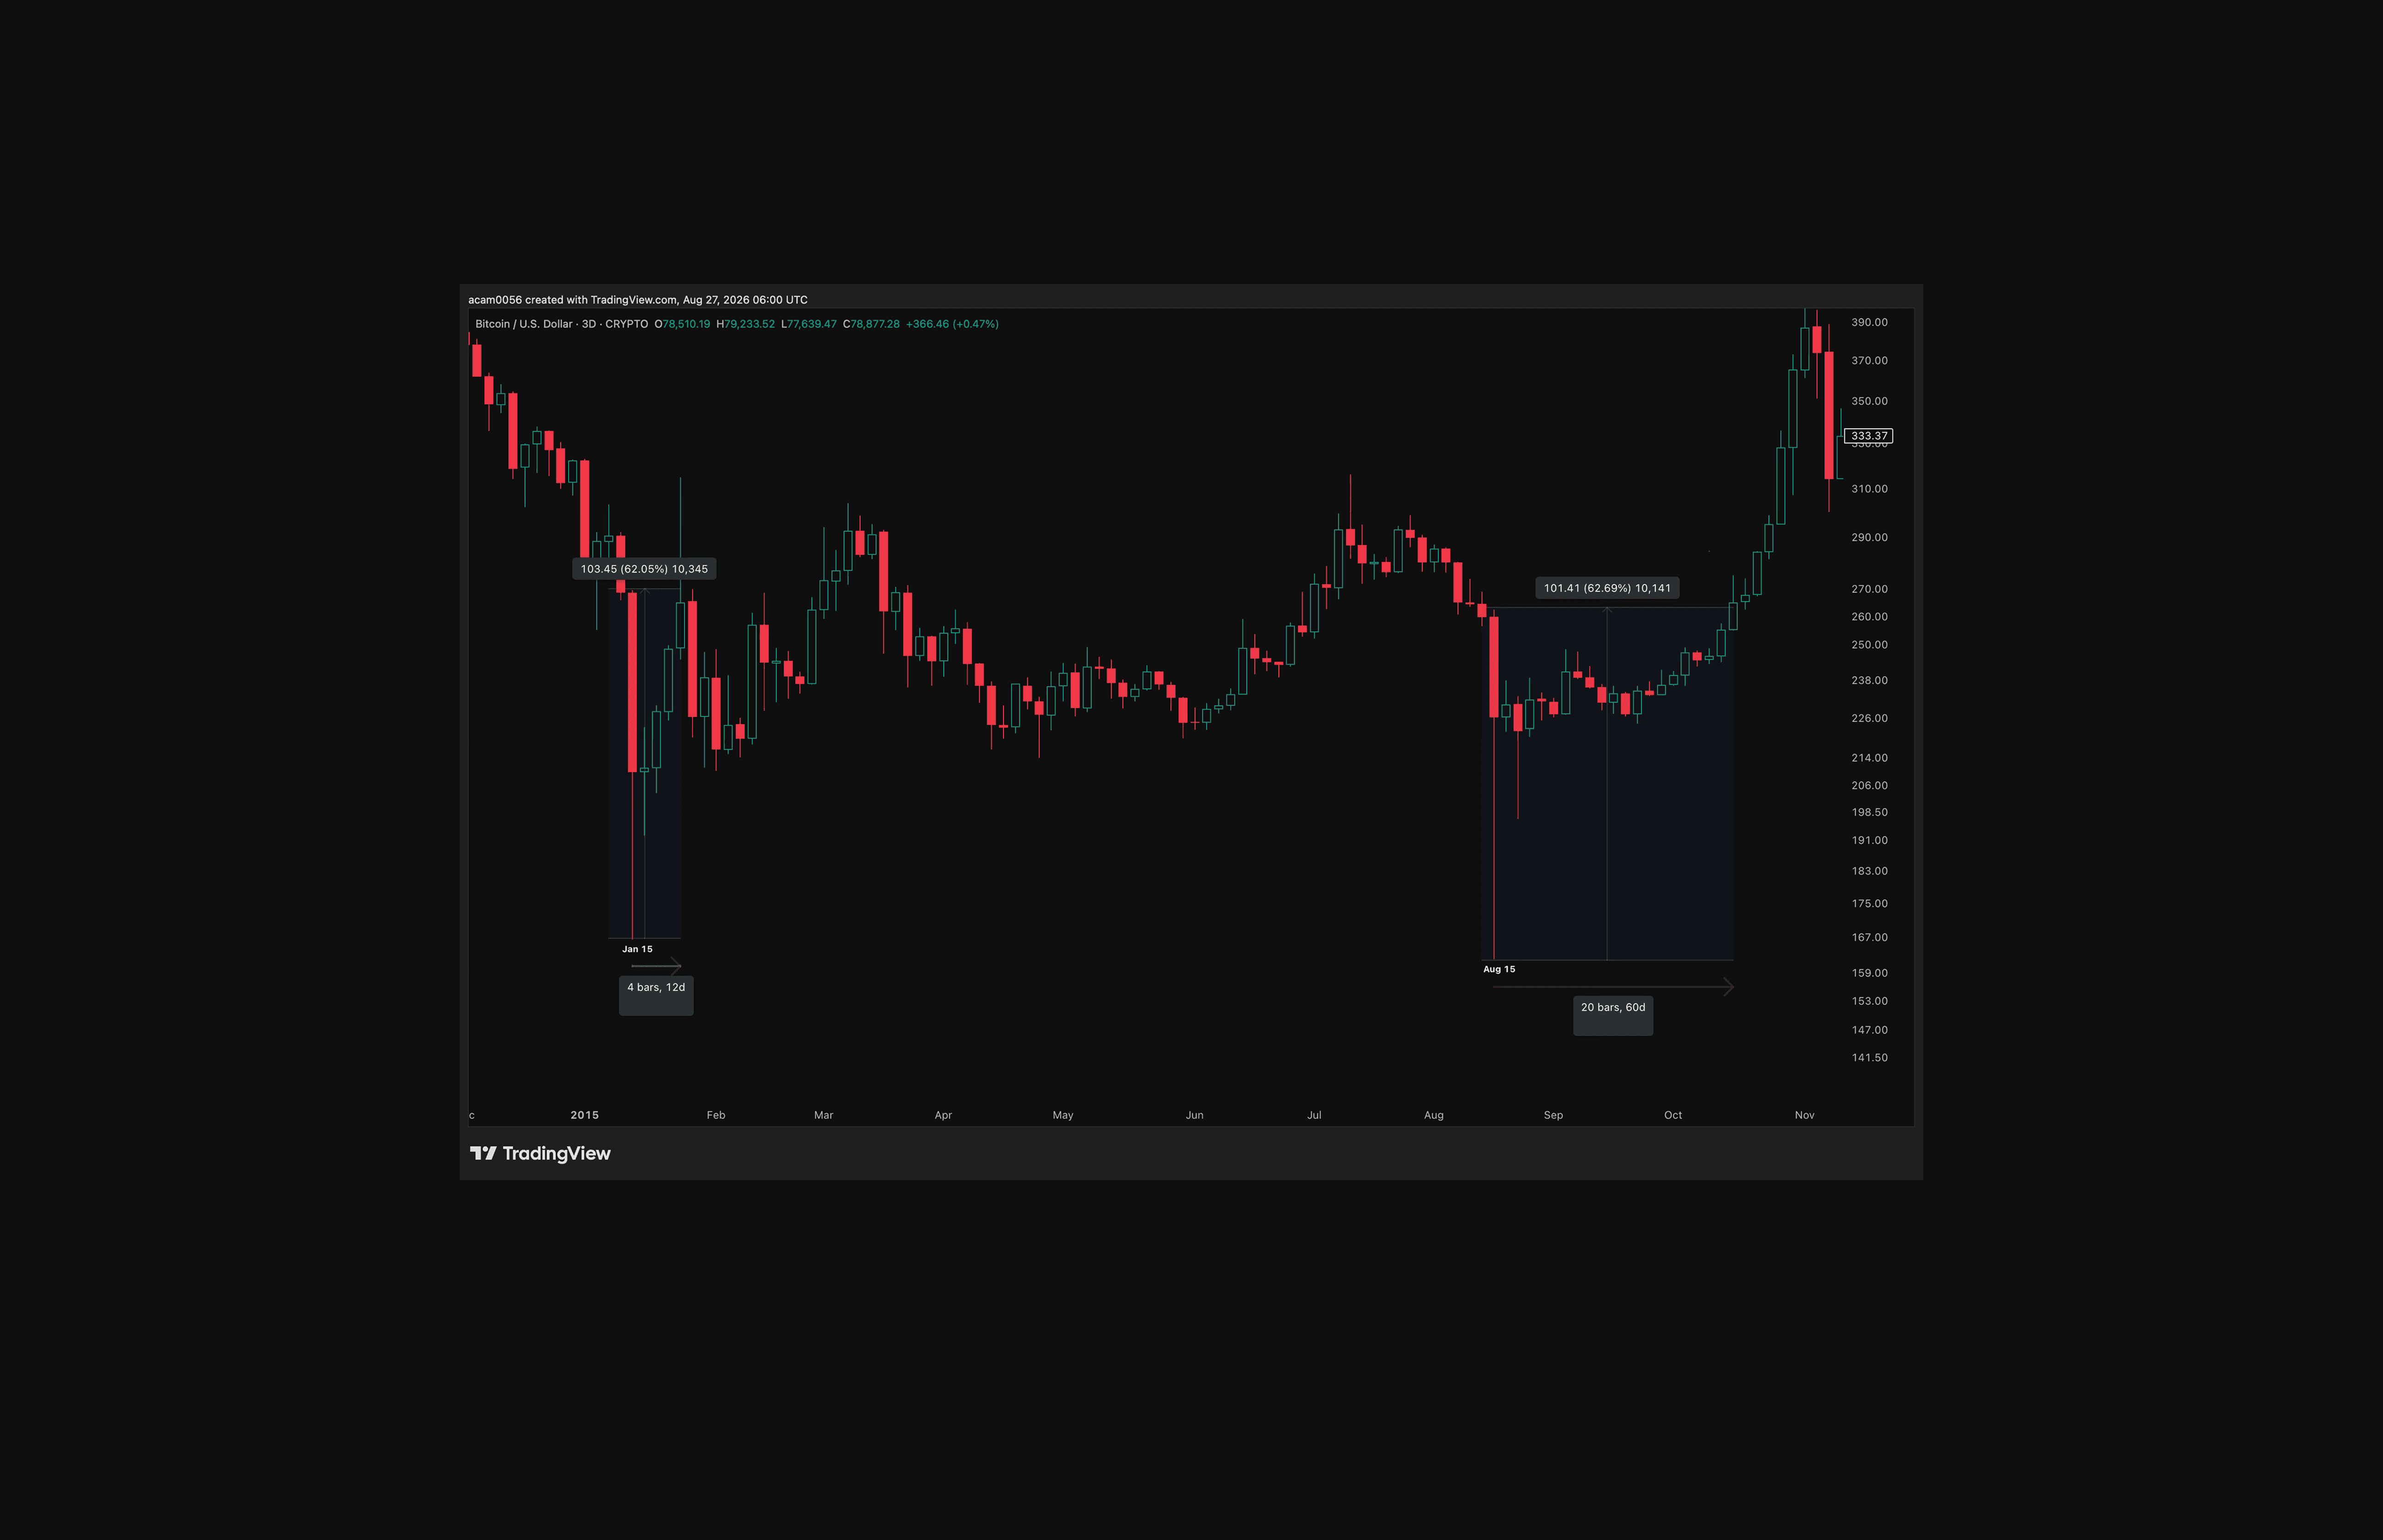
January rise: Bitcoin rebounded approximately 62% wick to wick.
January failure: Price cleared the reversal candle within 12 days but could not sustain the recovery and later made another low.
August rise: The lower low produced another rebound of approximately 63%.
August break: Bitcoin required approximately 60 days to clear the wider reversal range.
Outcome: The second structure became the lasting bottom.
The 2015 comparison is a useful warning: a large reversal and an early breakout can still fail.
2018: The Capitulation Wick
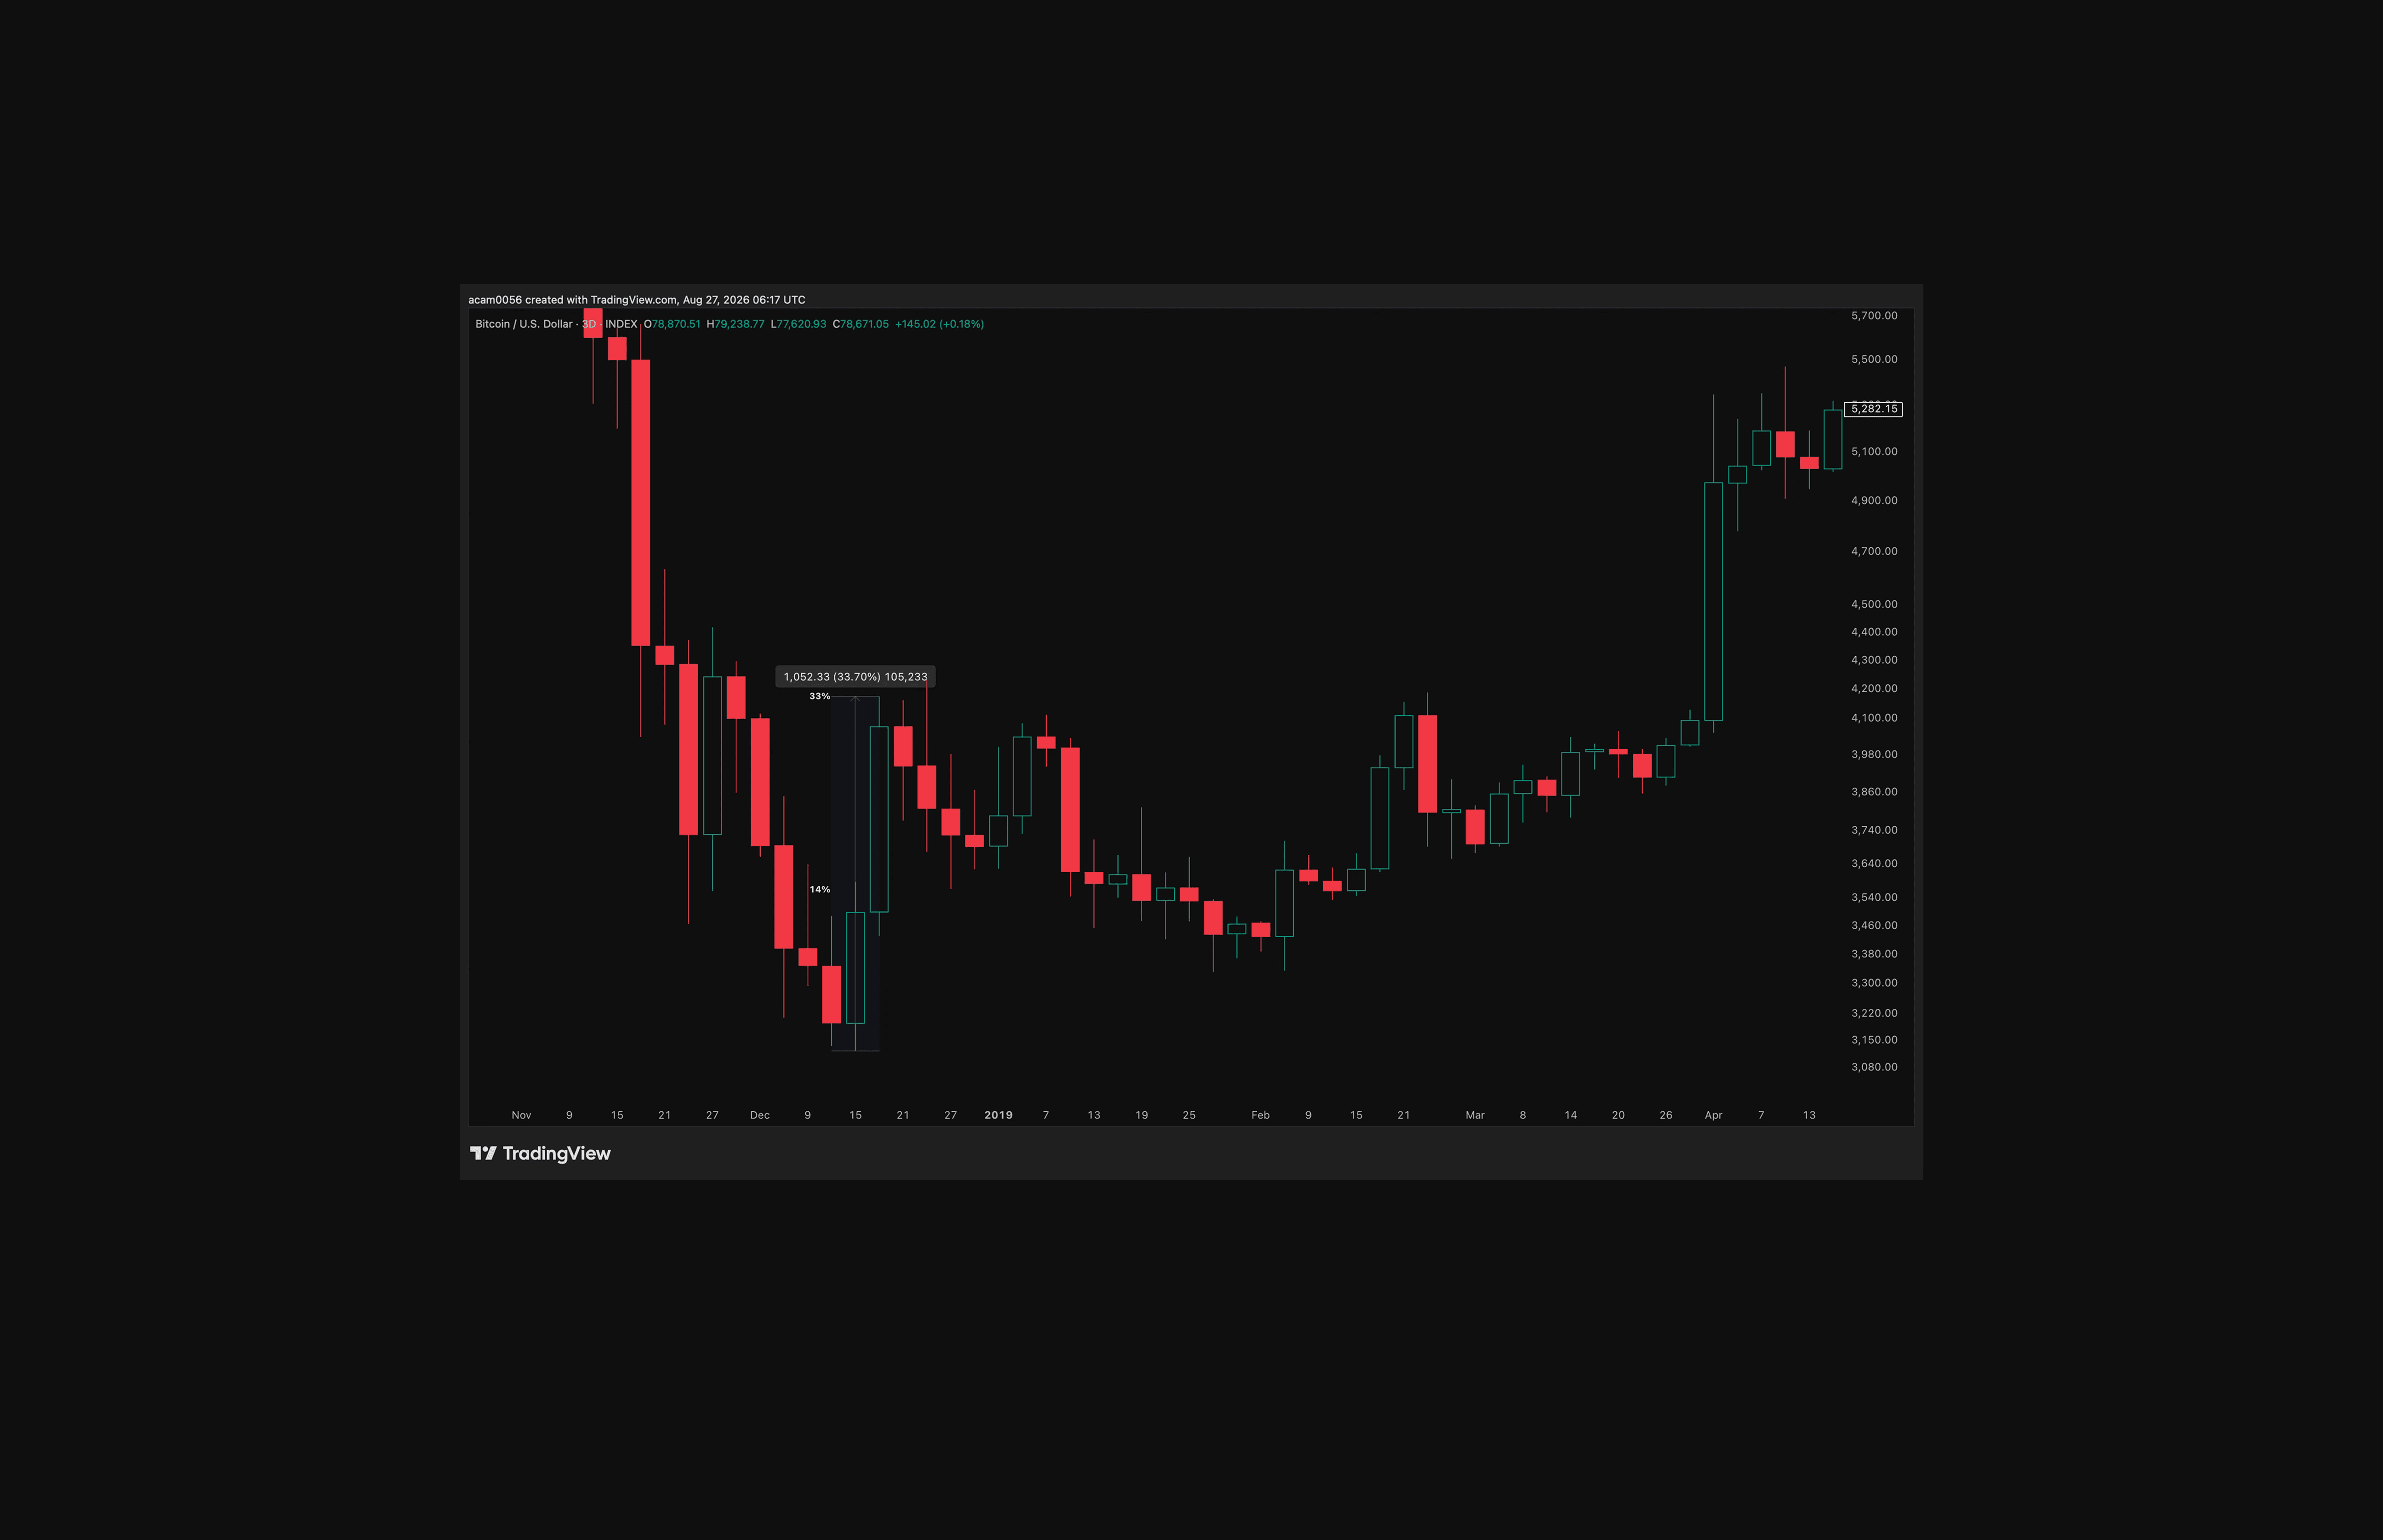
Initial rise: The December marking candle rebounded approximately 14%.
Extended rise: The initial recovery reached approximately 34%.
Hold: The December low survived a multi-month consolidation.
Break: Bitcoin required approximately 42 three-day candles, or 126 days, to leave the wider recovery range decisively.
Outcome: The long base preceded the April 2019 advance.
2022: The FTX Bottom
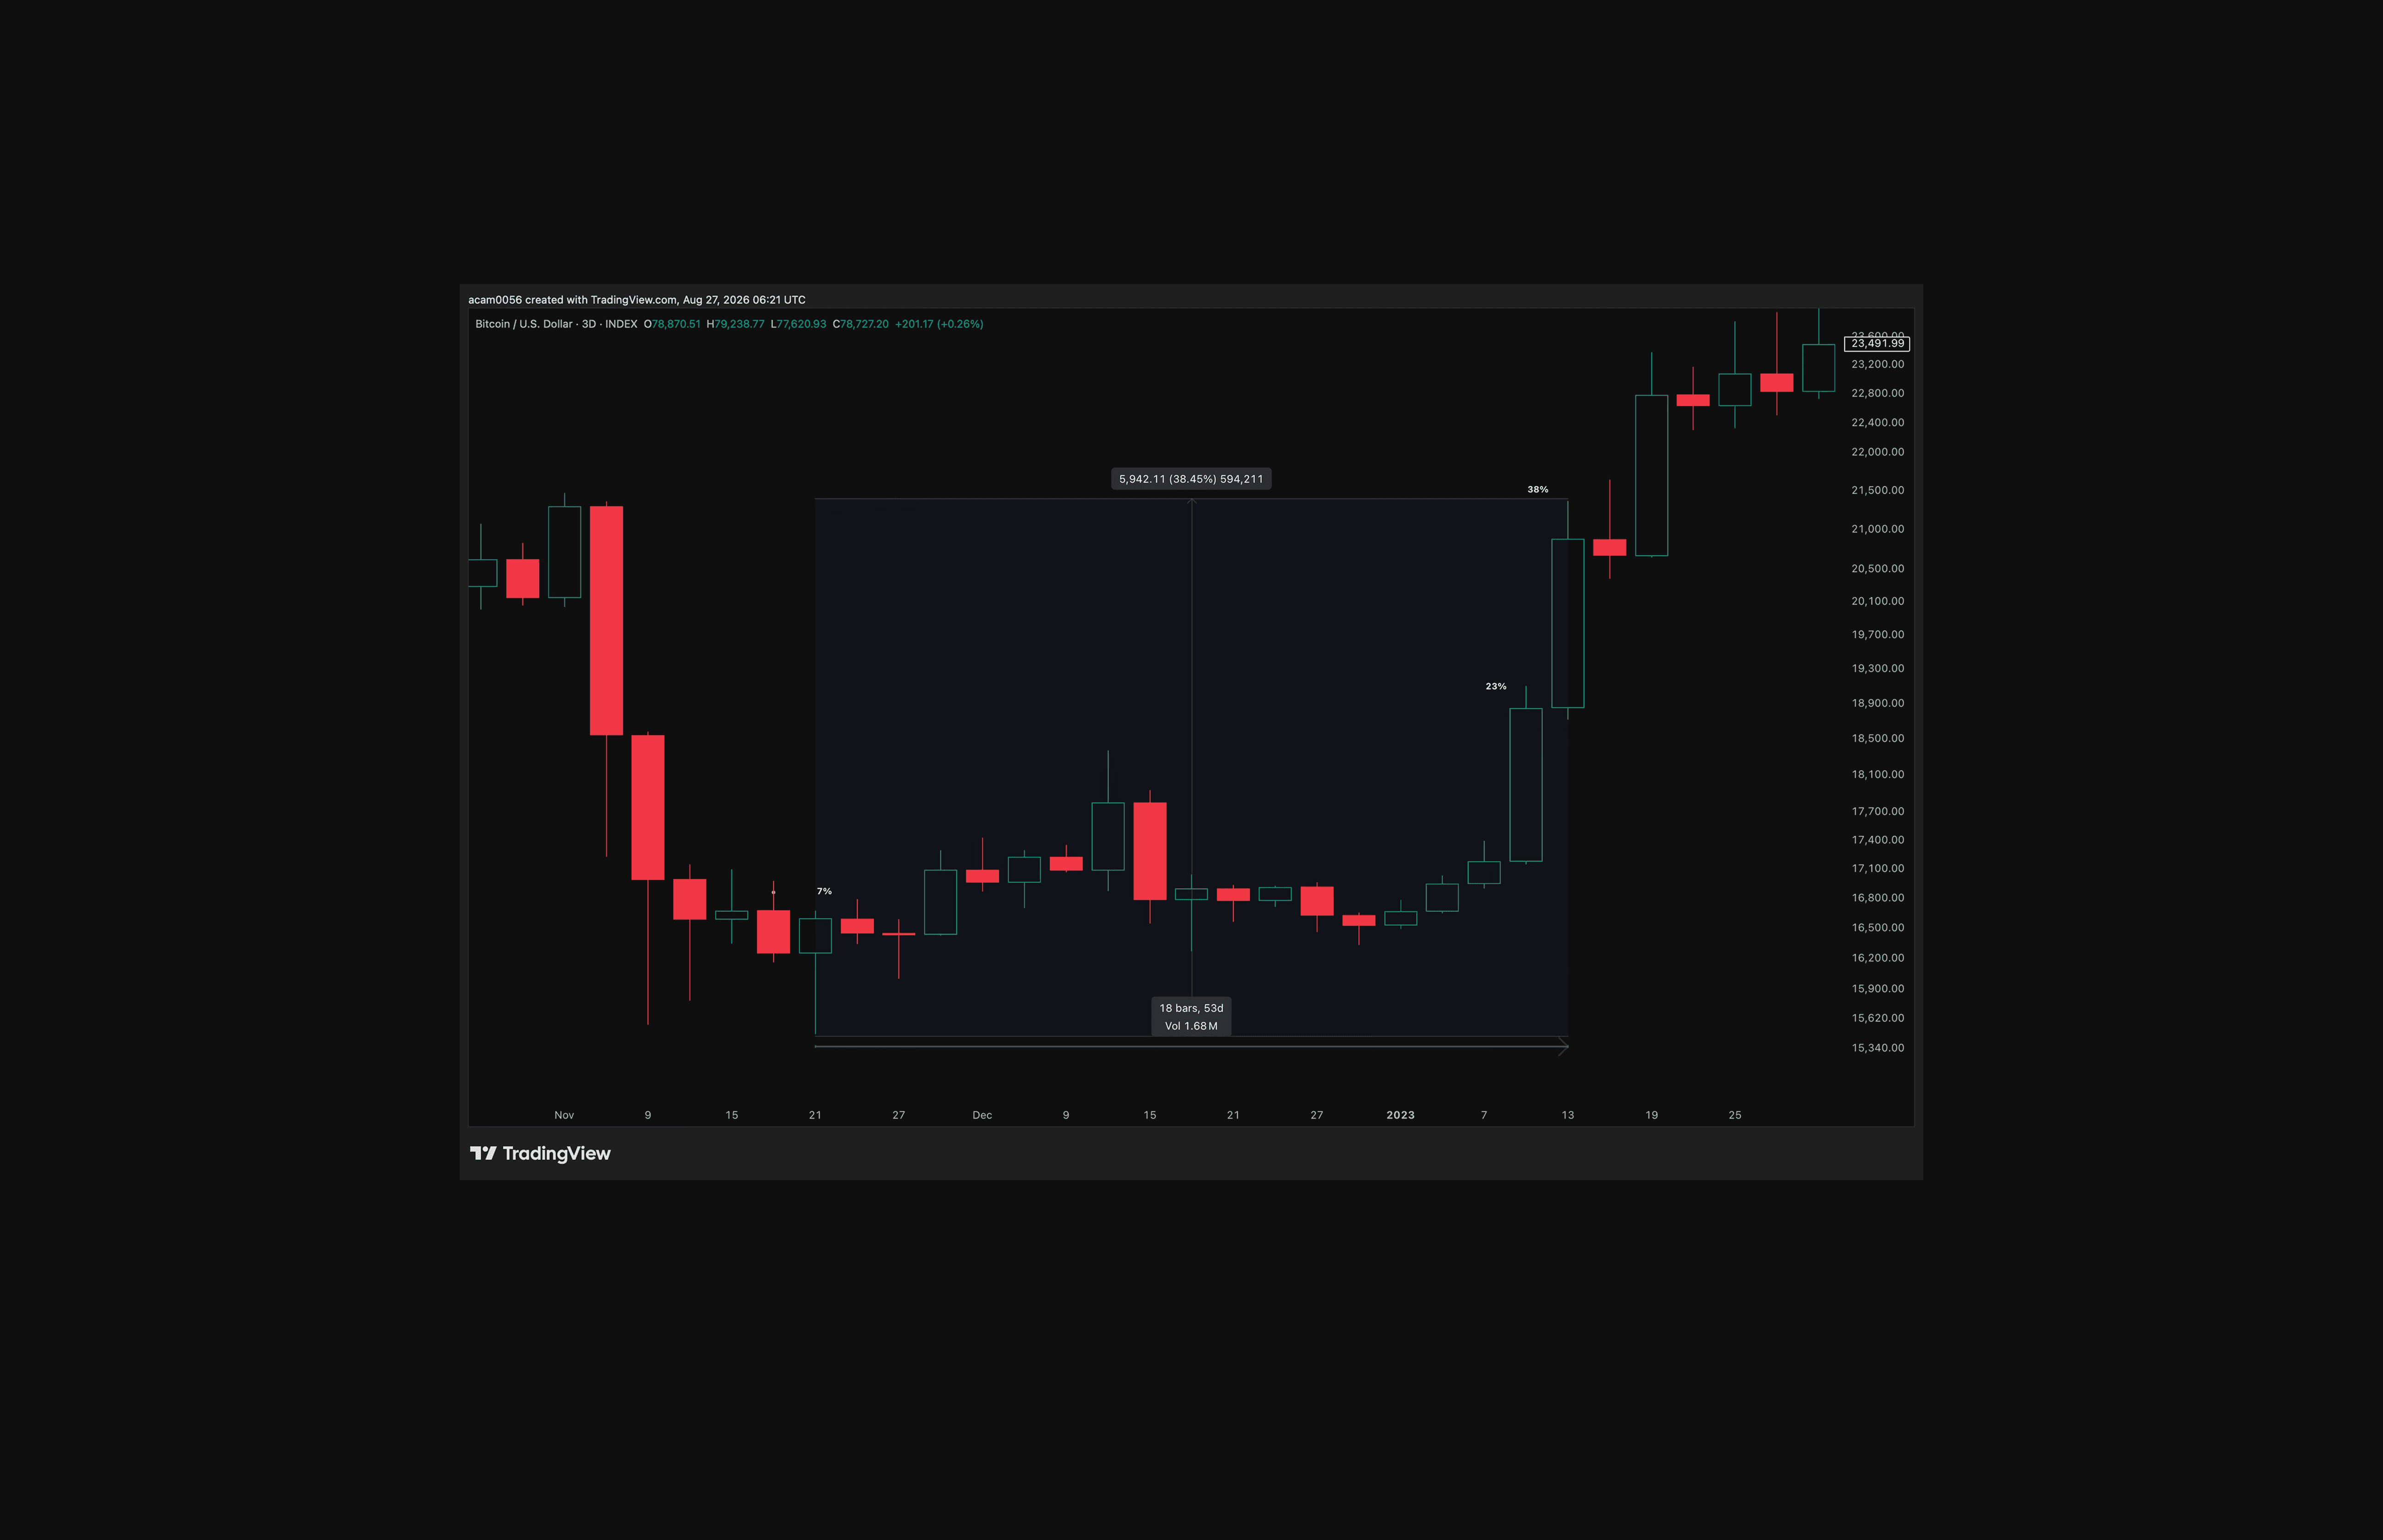
Initial rise: The November marking candle rebounded approximately 7%.
Hold: The low remained intact during almost two months of sideways trading.
Break: Bitcoin required approximately 18 three-day candles, or 53 days, to leave the range.
Extended rise: The recovery reached approximately 23% before extending to 38%.
Outcome: The defended low became the base for the 2023 recovery.
2026: The July Bottom Candidate
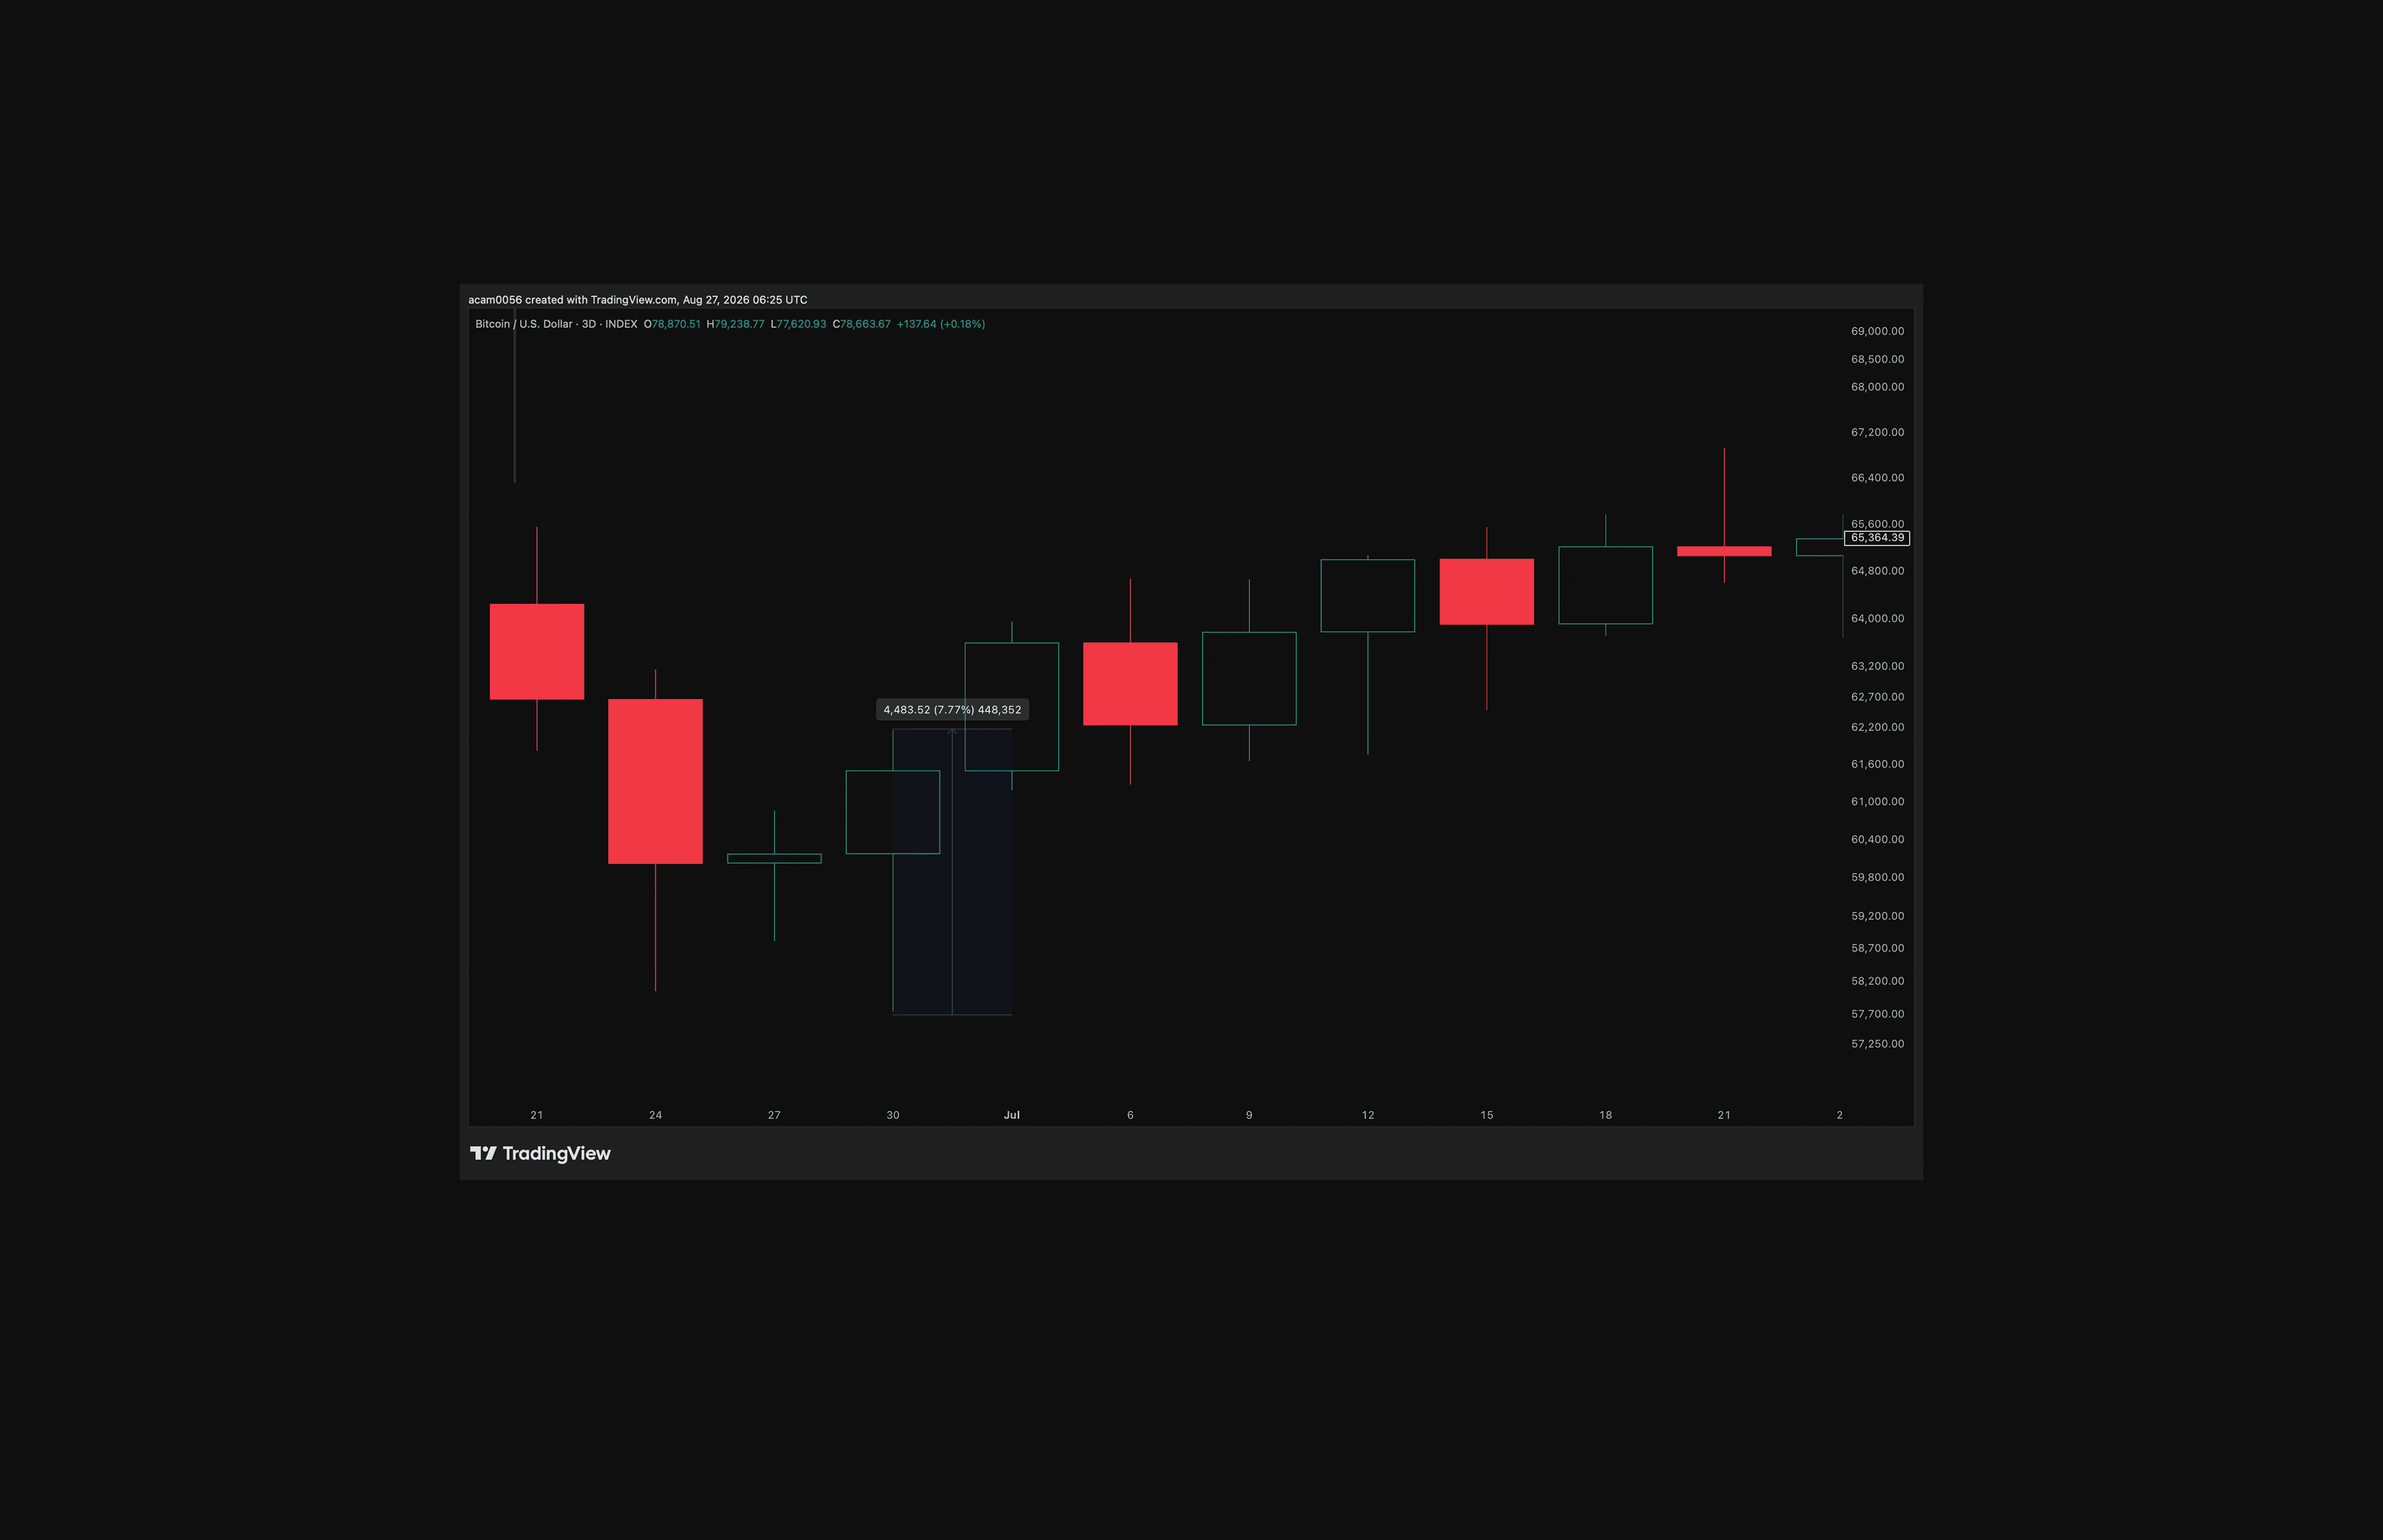
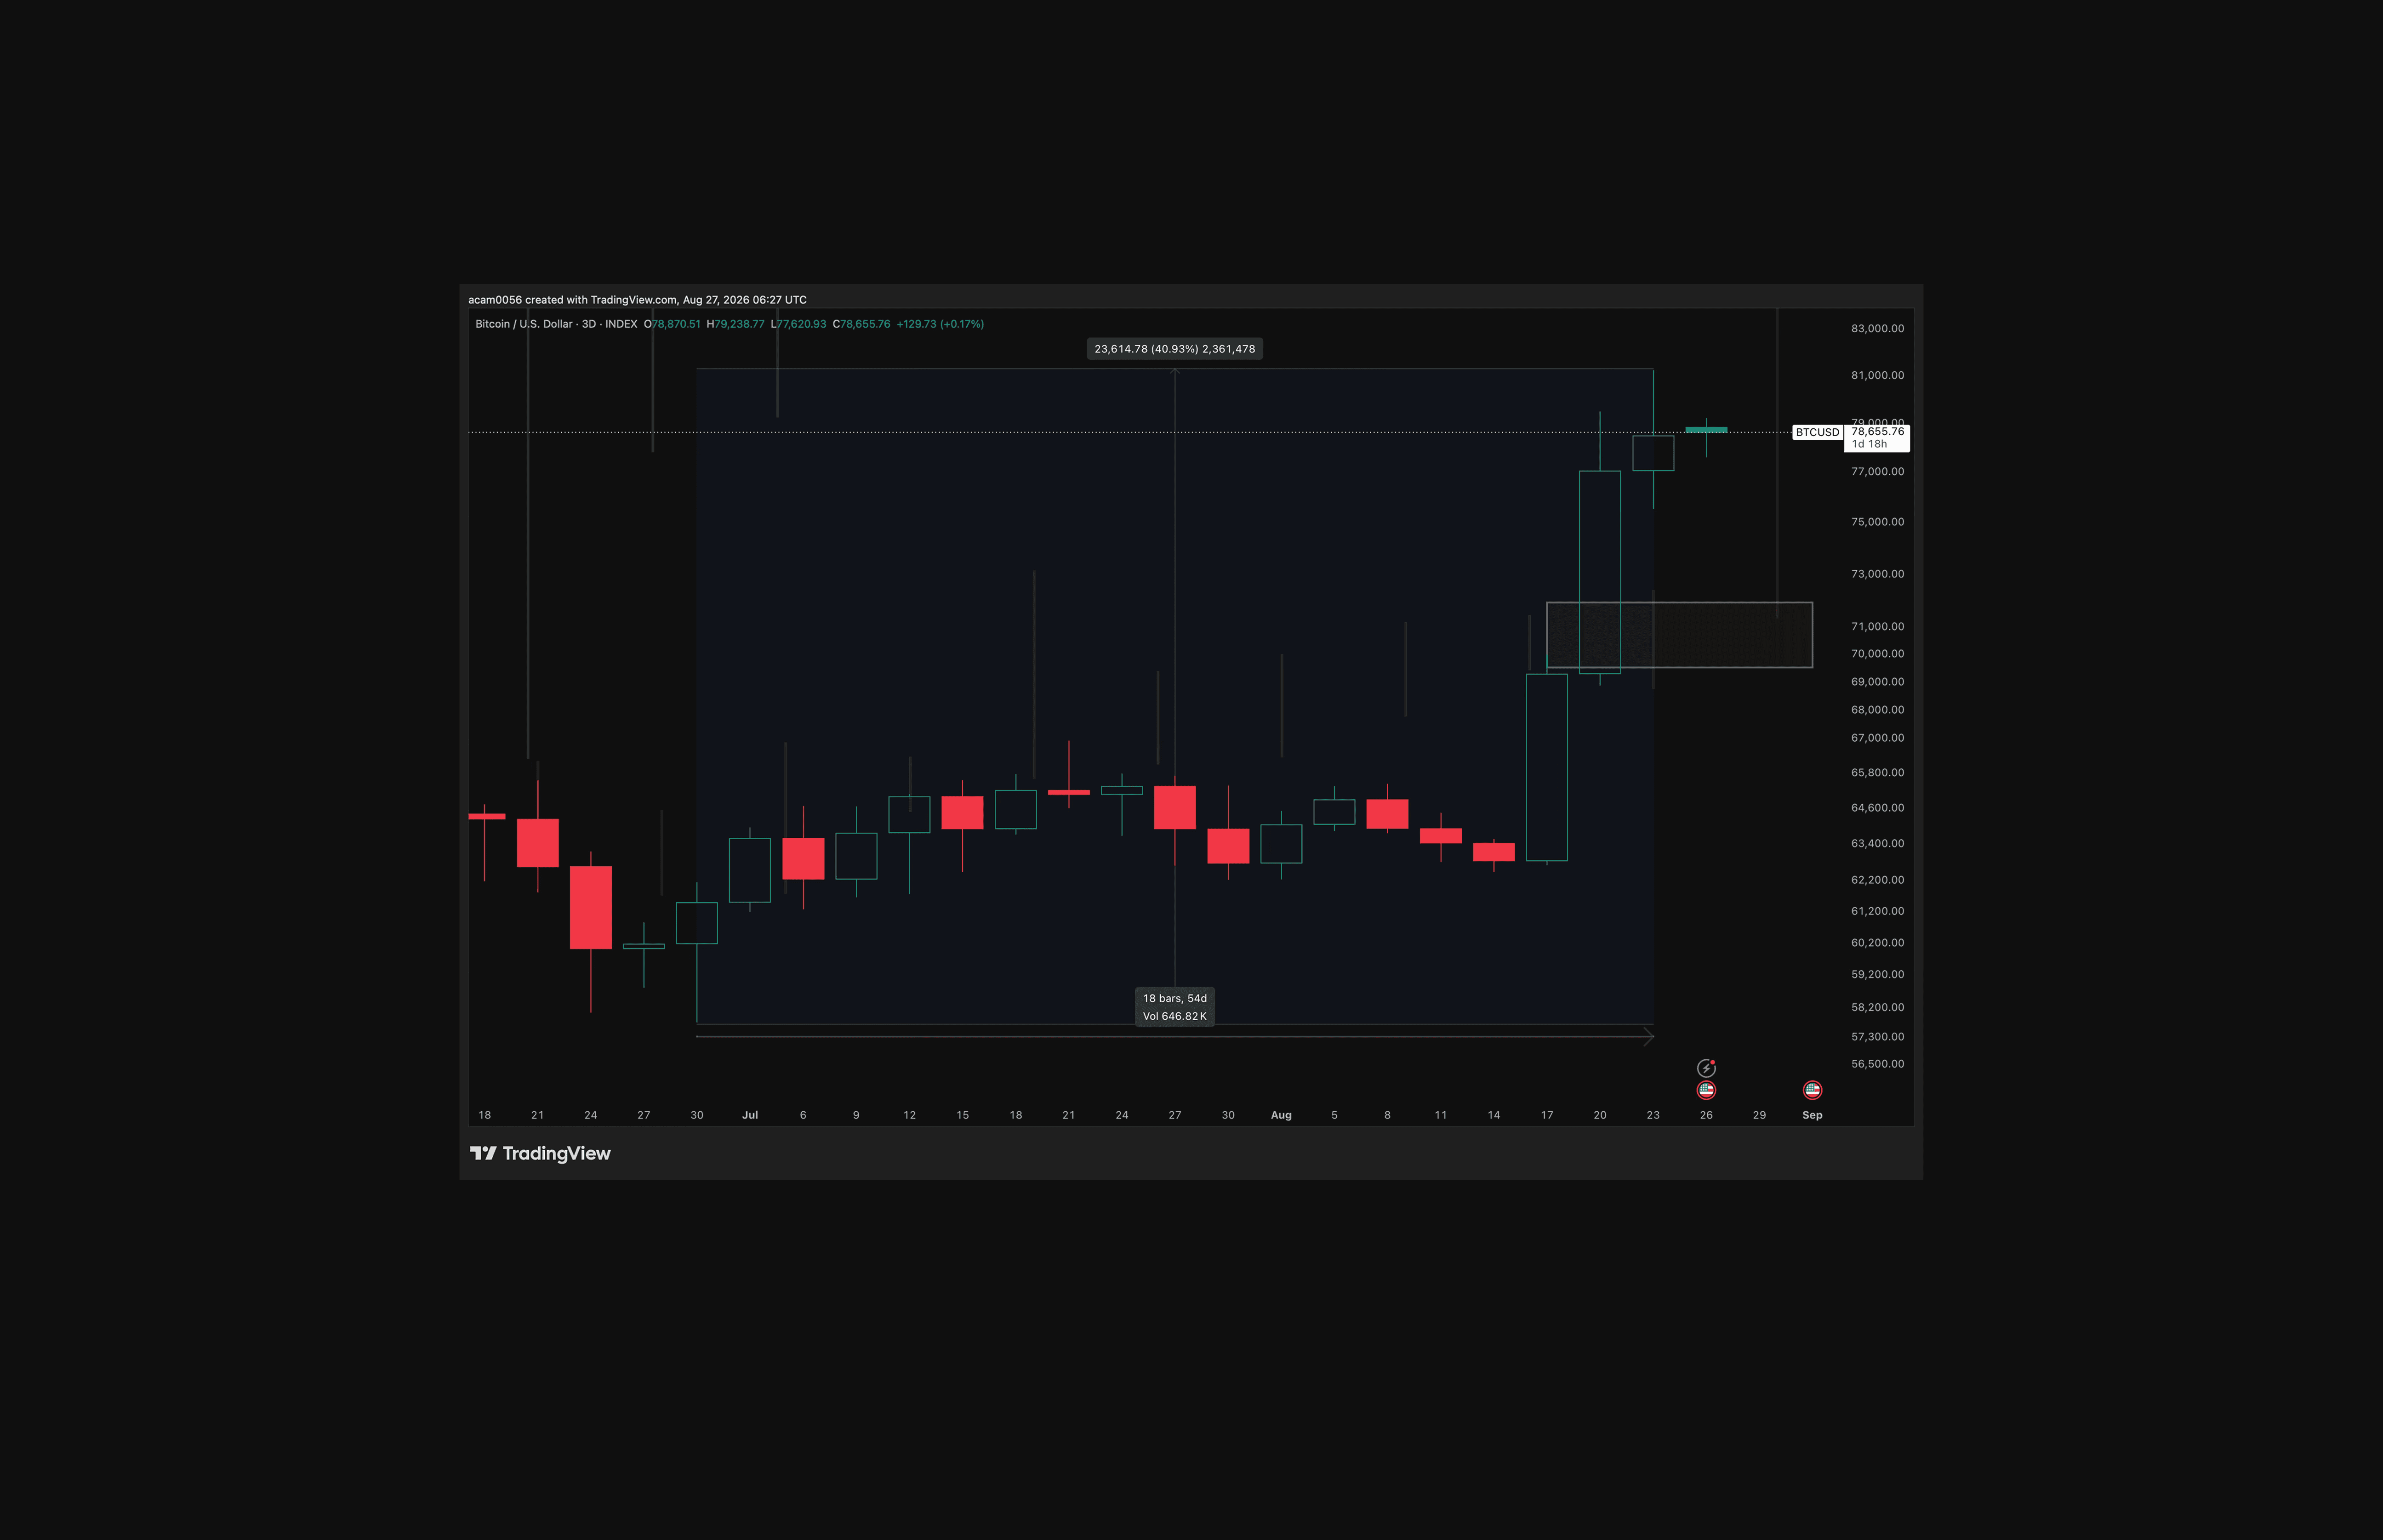
Initial rise: The July 1 marking candle rebounded approximately 8% wick to wick.
Hold: The July low survived the following consolidation.
Break: Bitcoin left the range after approximately 16 three-day candles, or 48 days.
Extended rise: The recovery reached approximately 41% after 18 three-day candles, or 54 days.
Current position: July remains a candidate rather than a confirmed cycle low.
The closest early comparison is 2022: both lows began with a reversal near 7-8%, held for roughly two months and produced a recovery near 40%. The resemblance supports the thesis, but the 2015 failure shows why an initial rebound cannot settle the question alone.
Conclusion: July Leads, but Confirmation Remains Pending
Bitcoin's July low has developed beyond a single reversal candle. Price has held the low, recovered approximately 41%, reclaimed short-term holder realised price and moved back above the 200-week moving average. Weekly momentum and Bitcoin's value against gold have also reached important breakout areas.
The evidence favours July as the bottom, but a new bull market is not yet confirmed. The 2014-2015 comparison still allows for a delayed lower low around March 2027, although a sustained move above $100,000 would materially weaken that route.
Leading interpretation: The July 1 low near $57,900 remains the strongest candidate for Bitcoin’s 2026 bear-market bottom.
Constructive pullback: A retreat toward short-term holder realised price between $71,000 and $73,800, followed by a rebound, would establish another higher low. Bitcoin does not need to revisit this area for the recovery to continue.
Stronger confirmation: Holding above short-term holder realised price, reclaiming the 50-week moving average near $81,200 and keeping weekly RSI above 56 would strengthen the bull-market case. A continuing sequence of higher lows and higher highs would provide further confirmation.
Reassessment: A confirmed close below $65,800 would break the present recovery structure and increase the probability of another test of the July low.
Invalidation: A decisive move below the July 1 low near $57,900 would invalidate the bottom thesis and require a fresh analysis.
External risk: An unexpected macroeconomic, regulatory or market-wide shock could invalidate the historical comparisons before the technical levels are reached.
Coinjuice is therefore comfortable adopting a cautiously bullish position, with greater conviction in its June view that the gap below $58,000 does not need to be filled. The conclusion remains conditional: July does not need to be declared the final low today, but it remains the strongest explanation of the evidence unless price either confirms the thesis or proves it wrong.
Readers looking to prepare for the next resistance test or pullback can start with the Coinjuice eBook, Bitcoin Trading Without Leverage. For continued analysis, live trade planning from entry through exit and the framework needed to identify similar opportunities independently, join Coinjuice and save 30% on an annual subscription. Annual subscribers also receive the eBook at no additional cost.
FAQ
Why is the July 1, 2026 low near $58,000 considered a leading candidate for Bitcoin’s bear‑market bottom?
Because price has held above that low while recovering about 41%, reclaimed the short-term holder realised price and the 200-week moving average, weekly momentum has broken above key RSI resistance, and Bitcoin has shown relative strength when priced in gold. Together, these signs make July the strongest current candidate for the bear‑market low, though not yet a confirmed cycle bottom.
What conditions would help confirm that a new Bitcoin bull market has begun?
Key confirming conditions are holding above the short-term holder realised price (around $71,000-$73,800), reclaiming and sustaining trade above the 50-week moving average near $81,200, and keeping weekly RSI above resistance around 56. A continued pattern of higher lows and higher highs would provide further confirmation.
What levels would weaken or invalidate the bottom thesis based on the July low?
A confirmed close below $65,800 would materially weaken the current recovery structure and increase the chance of retesting the July low. A decisive move below the July 1 low near $57,900 (about $58,000) would establish a new low and fully invalidate the bottom thesis, requiring a new reference point for analysis.
How do current Bitcoin bear‑market drawdowns compare with previous cycles?
Major bear‑market drawdowns have become progressively shallower: about 85% below the prior peak in January 2015, 84% in December 2018, 77% in November 2022, and roughly 54% from the October 2025 high to the July 2026 low. This suggests Bitcoin’s large drawdowns may be moderating as the market matures, though it does not guarantee every future decline will be smaller.
Disclaimer
The information provided in this article is for informational purposes only. It is not intended to be, nor should it be construed as, financial advice. We do not make any warranties regarding the completeness, reliability, or accuracy of this information. All investments involve risk, and past performance does not guarantee future results. We recommend consulting a financial advisor before making any investment decisions.
More like this


Written by

Andrew Kamsky
Andrew Kamsky is a Bitcoin analyst. He spent a decade in traditional finance across a Big Four firm and a listed fintech bank before going deep on Bitcoin full-time.