










Quick summary
Bitcoin rose near $79,658 alongside Nvidia’s 8 percent earnings-driven rally and tech strength
Glassnode shows nearly 8 percent of BTC supply bought between 80000 and 82000 dollars
ETF holders’ average cost, 50 week moving average, cluster in same resistance band near 81000
Traders prefer defined risk call spreads and covered calls amid heavy supply wall and weak September seasonality
Bitcoin traded near $79,658 on August 28, 2026. Two developments elsewhere explain what sits beneath it: an earnings report from a NVDA company with no direct Bitcoin or crypto exposure, and a supply map showing precisely where the largest concentration of Bitcoin ownership last changed hands. Both point to the same $80,000 to $82,000 band, and both are shaping how professional traders are positioning into it.
Bitcoin's Bounce Traced Nvidia's Beat, Not the Reverse
Nvidia reported fiscal second-quarter revenue of $96.2 billion, ahead of the $92.27 billion analyst estimate, and guided third-quarter revenue to $108 billion, above the $103.9 billion consensus. Shares rose roughly 8% in premarket trading.
A second announcement layered on top: Nvidia has agreed to acquire open-source AI platform Hugging Face for $12.9 billion, according to The Information, extending its reach from chips into the AI software stack. Neither company has confirmed the deal directly.
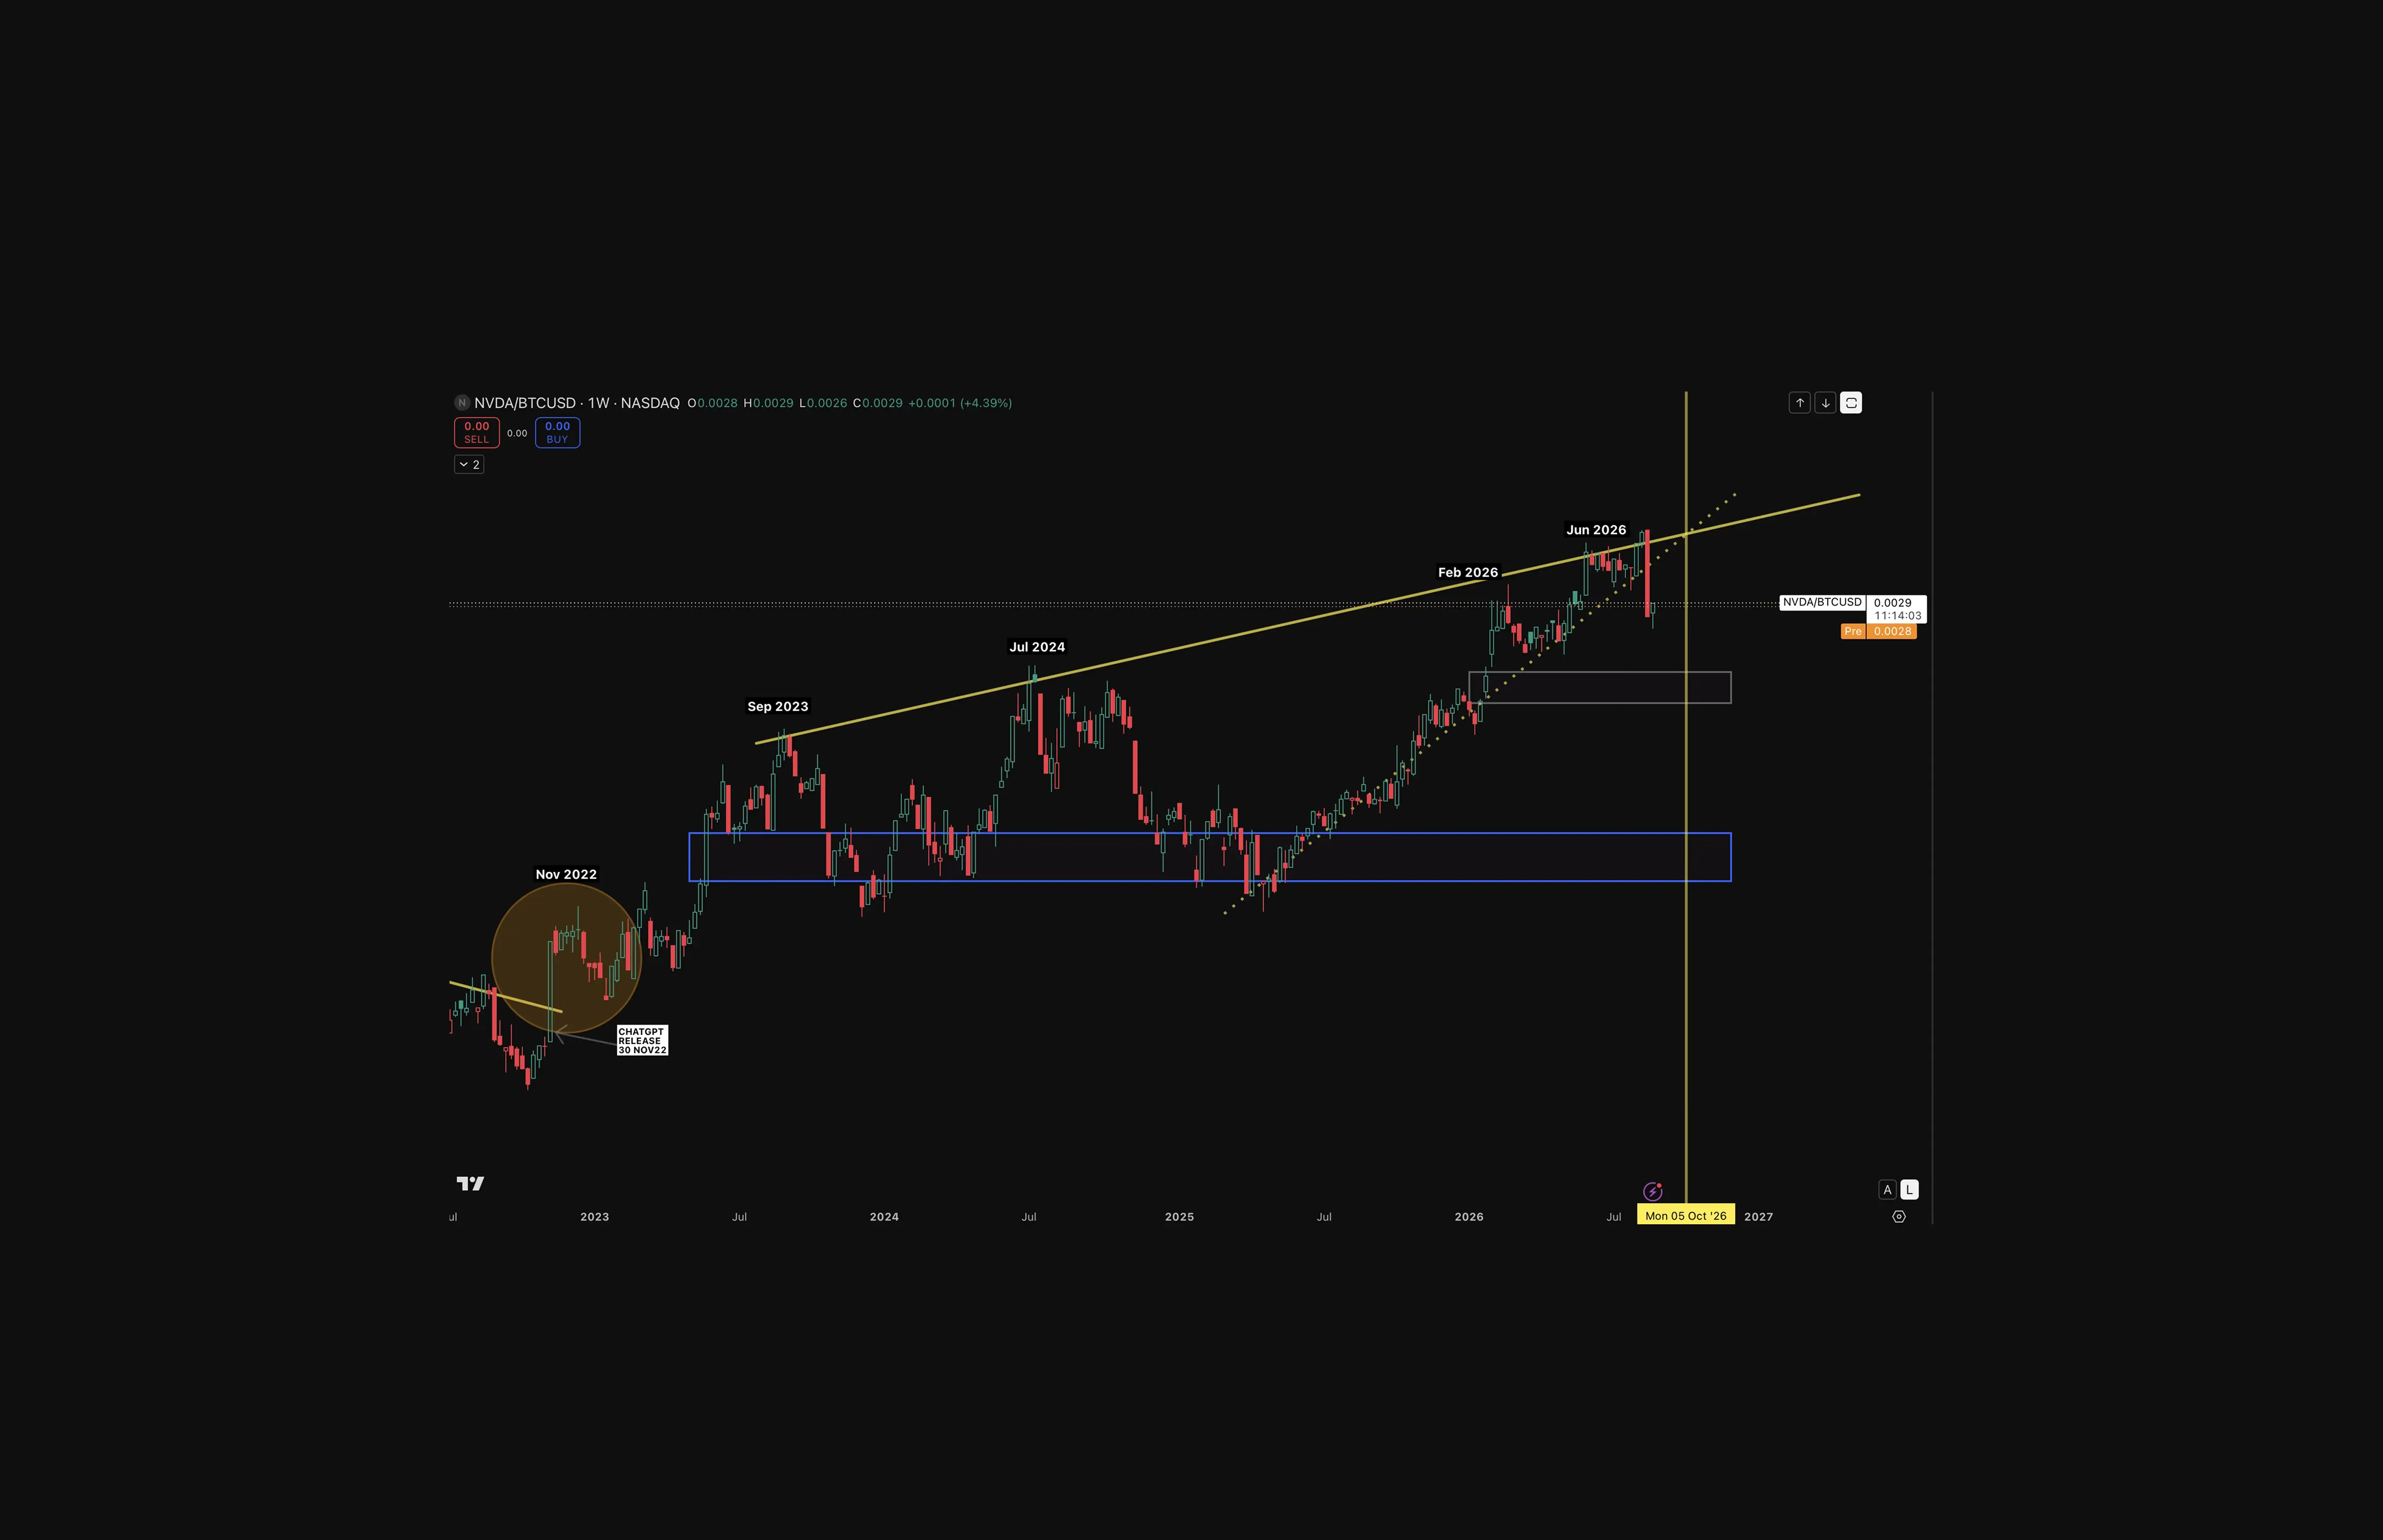
The correlation channel did the rest: Bitcoin has held a rolling correlation above 0.5 with Nvidia's stock for most of the year. As Nvidia rose, Bitcoin climbed toward $80,000 the same session, tracking that relationship rather than reacting to any Bitcoin-specific catalyst.
What moved alongside it: Bitcoin miners with AI infrastructure exposure advanced with the broader tech move. IREN rose 5%, while TeraWulf and Cipher Mining each gained around 3%, evidence that the flow into Bitcoin traced the same risk-on channel lifting the Nasdaq rather than a separate crypto narrative.
The Invesco QQQ gained more than 1%: in the same session, underscoring that the move was tech-led first and crypto-adjacent second.
For scale: Nvidia's post-earnings market cap of roughly $5.5 trillion, divided across bitcoin's 21 million coin supply cap, works out to roughly $262,000 a coin, a reminder of the size gap between the two assets even as they move together.
The Bounce Is Running Into the Densest Supply Concentration on Record
Bitcoin's push back toward $80,000 is arriving at a level that Glassnode's Realized Price Distribution flags as the single largest concentration of supply at any comparable price range.
The wall, mapped: nearly 8% of Bitcoin's circulating supply was acquired between $80,000 and $82,000. Roughly 5% of supply is clustered at $80,000 alone, the densest single price level, while $82,000 holds the fourth-largest cluster.
The overlap that compounds it: the average cost basis of U.S. spot Bitcoin ETF holders also sits inside that same $80,000 to $82,000 band, meaning the largest cohort of institutional buyers from the past two weeks of inflows would be exiting near breakeven if they sold here. The 50-week moving average, at $81,081, sits directly inside the same range.
A precedent worth watching, not assuming: a similar concentration between $60,000 and $63,000 acted as resistance for weeks earlier this year before flipping into support once price traded through it. That is a pattern from a different cycle phase, not a guarantee this band repeats it.
This supplies the mechanism behind Wednesday's rejection: Coinjuice's coverage of the 50-week moving average test flagged the rejection at that level without a full account of why it mattered structurally. The realized price distribution data closes that gap.
Professional traders are structuring, not chasing: Deribit's chief commercial officer Jean-David Pequignot said call spreads, buying a call at one strike while selling a call at a higher strike, remain the preferred way to gain upside exposure into September, since the position caps maximum loss to the premium paid, unlike spot, where a reversal toward $70,000 produces a full per-coin loss.
Markus Thielen of 10x Research proposed a related structure: holding spot while selling a call near $90,000 against it, collecting premium as a partial cushion.
The seasonal caution behind the caution: Bitcoin has averaged a negative 3% return in September since 2013, according to CoinGlass data, giving the defined-risk framing a calendar-based rationale on top of the supply wall itself.
One flag worth carrying forward: Glassnode-sourced coverage does not agree on how far the resistance zone extends. Some reporting frames it as $80,000 to $82,000; other coverage of the same underlying data extends the same overhead structure to $86,000, citing long-term holder breakevens and options dealer hedging further up. Both readings agree the test starts near $80,000. Neither has resolved the upper boundary.
The Lesson
A price catalyst and a structural resistance level are different categories of evidence, and conflating them is the easiest mistake to make in a session like this one. Nvidia's earnings beat explains why Bitcoin approached $80,000 this week. Glassnode's supply data explains why that specific level may not give way on the first attempt. Bitcoin's Nvidia-driven bounce is testing its largest supply wall, and traders are structuring risk rather than chasing price.
Readers looking to navigate a resistance test like this one can start with the Coinjuice ebook, Bitcoin Trading Without Leverage, or go deeper with a Coinjuice subscription, currently 30% off the annual plan, where we start and complete trades and you will learn to snipe them independently. Annual subscribers also get the ebook for free.
Coinjuice Lens: Market Structure
This closes a loop opened in Wednesday's coverage of the 50-week moving average test: that piece flagged the rejection at roughly $81,000 as a level worth watching. The supply concentration data now supplies that explanation.
The open question from earlier in the week, whether Bitcoin is becoming a macro hedge or simply riding a risk-on wave, remains unresolved; a bounce driven by a semiconductor earnings report is evidence for the latter, not the former, though one session does not settle it either way.
News Behind Today's Read
Nvidia shares surge 8% on earnings beat, lifting technology stocks and bitcoin (CoinDesk, Aug 27, 2026) — source for the Nvidia results, the Hugging Face acquisition, and the correlation move into Bitcoin.
Bitcoin tests its largest supply wall at $80,000, near ETF holders' average price (CoinDesk, Aug 27, 2026) — source for the Glassnode Realized Price Distribution figures and the ETF cost-basis overlap.
Bitcoin experts prefer this defined-risk strategy for the next leg higher in prices (CoinDesk Daybook, Aug 27, 2026) — source for the Deribit and 10x Research options commentary and the September seasonality figure.
Bitcoin faces true demand test above $83K as liquidity thickens: Glassnode (Cointelegraph, Aug 2026) — corroborating source that frames the same overhead structure with a wider upper boundary, flagged above as an unresolved discrepancy.
Weekly Economic Outlook: August 23-30, 2026 (Finobird) — source for the Jackson Hole and PCE calendar context.
This article was developed with the support of artificial intelligence tools as part of Coinjuice's editorial process and reviewed by our editorial team before publication.
What Investors Are Asking
Why did Bitcoin move with Nvidia's earnings instead of crypto-specific news?
Bitcoin has held a rolling correlation above 0.5 with Nvidia's stock through most of the year, a relationship tied to shared risk appetite across tech and crypto rather than any direct business link. Nvidia's beat and acquisition lifted broader risk sentiment, and Bitcoin moved with it.
Does the $80,000 to $82,000 supply wall mean Bitcoin cannot go higher?
No single supply cluster guarantees an outcome. It identifies where a meaningful share of holders, including recent ETF buyers, are near breakeven and may be inclined to sell. A similar band between $60,000 and $63,000 held as resistance earlier this year before flipping into support once price traded through it, though that outcome is not assured to repeat.
Market Snapshot
Asset | Price | Distance from ATH | 7d Change |
BTC | $79,658 | 36.9% below ATH ($126,156) | +10.4% (CoinGecko) |
ETH | $2,487 | 49.7% below ATH ($4,946) | +10.7% (CoinGecko) |
SOL | $106.82 | 63.6% below ATH ($293.31) | +18.6% (CoinGecko) |
DeFi TVL | $88.6B | — | — |
FAQ
Why did Bitcoin move higher alongside Nvidia instead of on crypto-specific news?
Bitcoin has held a rolling correlation above 0.5 with Nvidia's stock for most of the year, reflecting shared risk appetite across tech and crypto. Nvidia's earnings beat and the reported Hugging Face acquisition lifted broader risk sentiment, and Bitcoin followed that tech-led move rather than responding to a Bitcoin-specific catalyst.
What is the significance of the $80,000 to $82,000 price range for Bitcoin?
Nearly 8% of Bitcoin's circulating supply was acquired between $80,000 and $82,000, with roughly 5% clustered at $80,000 alone, the densest single level. The average cost basis of U.S. spot Bitcoin ETF holders and the 50-week moving average at $81,081 also sit in this band, creating Bitcoin's largest recorded supply concentration at a comparable price range.
How are professional traders positioning around Bitcoin's current resistance zone?
Professional traders are using defined-risk strategies instead of chasing spot. On Deribit, call spreads—buying a call at one strike and selling a higher-strike call—are favored to cap maximum loss at the premium. Markus Thielen of 10x Research suggests holding spot while selling a call near $90,000 to collect premium as a partial cushion.
Does the current supply wall mean Bitcoin cannot move above $80,000 to $82,000?
No. The supply wall marks where many holders, including recent ETF buyers, are near breakeven and may be inclined to sell, but it does not guarantee an outcome. A similar $60,000 to $63,000 band acted as resistance earlier this year before flipping into support once price broke through, though there is no assurance this pattern will repeat.
Disclaimer
The information provided in this article is for informational purposes only. It is not intended to be, nor should it be construed as, financial advice. We do not make any warranties regarding the completeness, reliability, or accuracy of this information. All investments involve risk, and past performance does not guarantee future results. We recommend consulting a financial advisor before making any investment decisions.
More like this

Written by

Andrew Kamsky
Andrew Kamsky is a Bitcoin analyst. He spent a decade in traditional finance across a Big Four firm and a listed fintech bank before going deep on Bitcoin full-time.