


Quick summary
Bitcoin's 50 percent drawdown carries 2018-level fear without a 2018-level catastrophe behind it
Historical unfilled gaps near 1.4k and 2.7k challenge the assumption that all gaps must fill
Coins sold in capitulation historically migrate to new holders and rarely return to sellers
The bull thesis breaks if long-term holder supply share falls rather than rises through July
Traders waiting for Bitcoin at $32k are betting on a rule that gaps always fill. The evidence points the other way. The current 50% drawdown is printing the same fractal structure as 2018 and 2022, but with one structural difference: there is no black swan behind it.
This article examines the past three sentiment-driven drawdowns side by side, tests the gap-fill assumption against Bitcoin's own unfilled gaps, and explains why the entry the crowd is waiting for already sits above the exit it took.
Three BTC Drawdowns
Fractals work because they capture the same emotional cycle at every price scale. The panic at $3k in 2018 and $15k in 2022 produced the same holder response: forced selling, accelerating outflows from old wallets, and the same handful of contrarian voices arguing the bottom was in.
Cycle | Peak to Trough | Drawdown | Trigger | Exogenous Shock |
2018 | ~$19.9k to ~$3.1k | -85.5% | Post-mania unwind | No |
2020 | ~$10.5k to ~$3.8k | -63% (weeks) | Global Pandemic | Yes |
2022 | ~$69k to ~$15.5k | -79.7% | LUNA, FTX collapse | Yes |
2026 | ~$126k to ~$63k | -50% | No single exogenous shock identified | No |
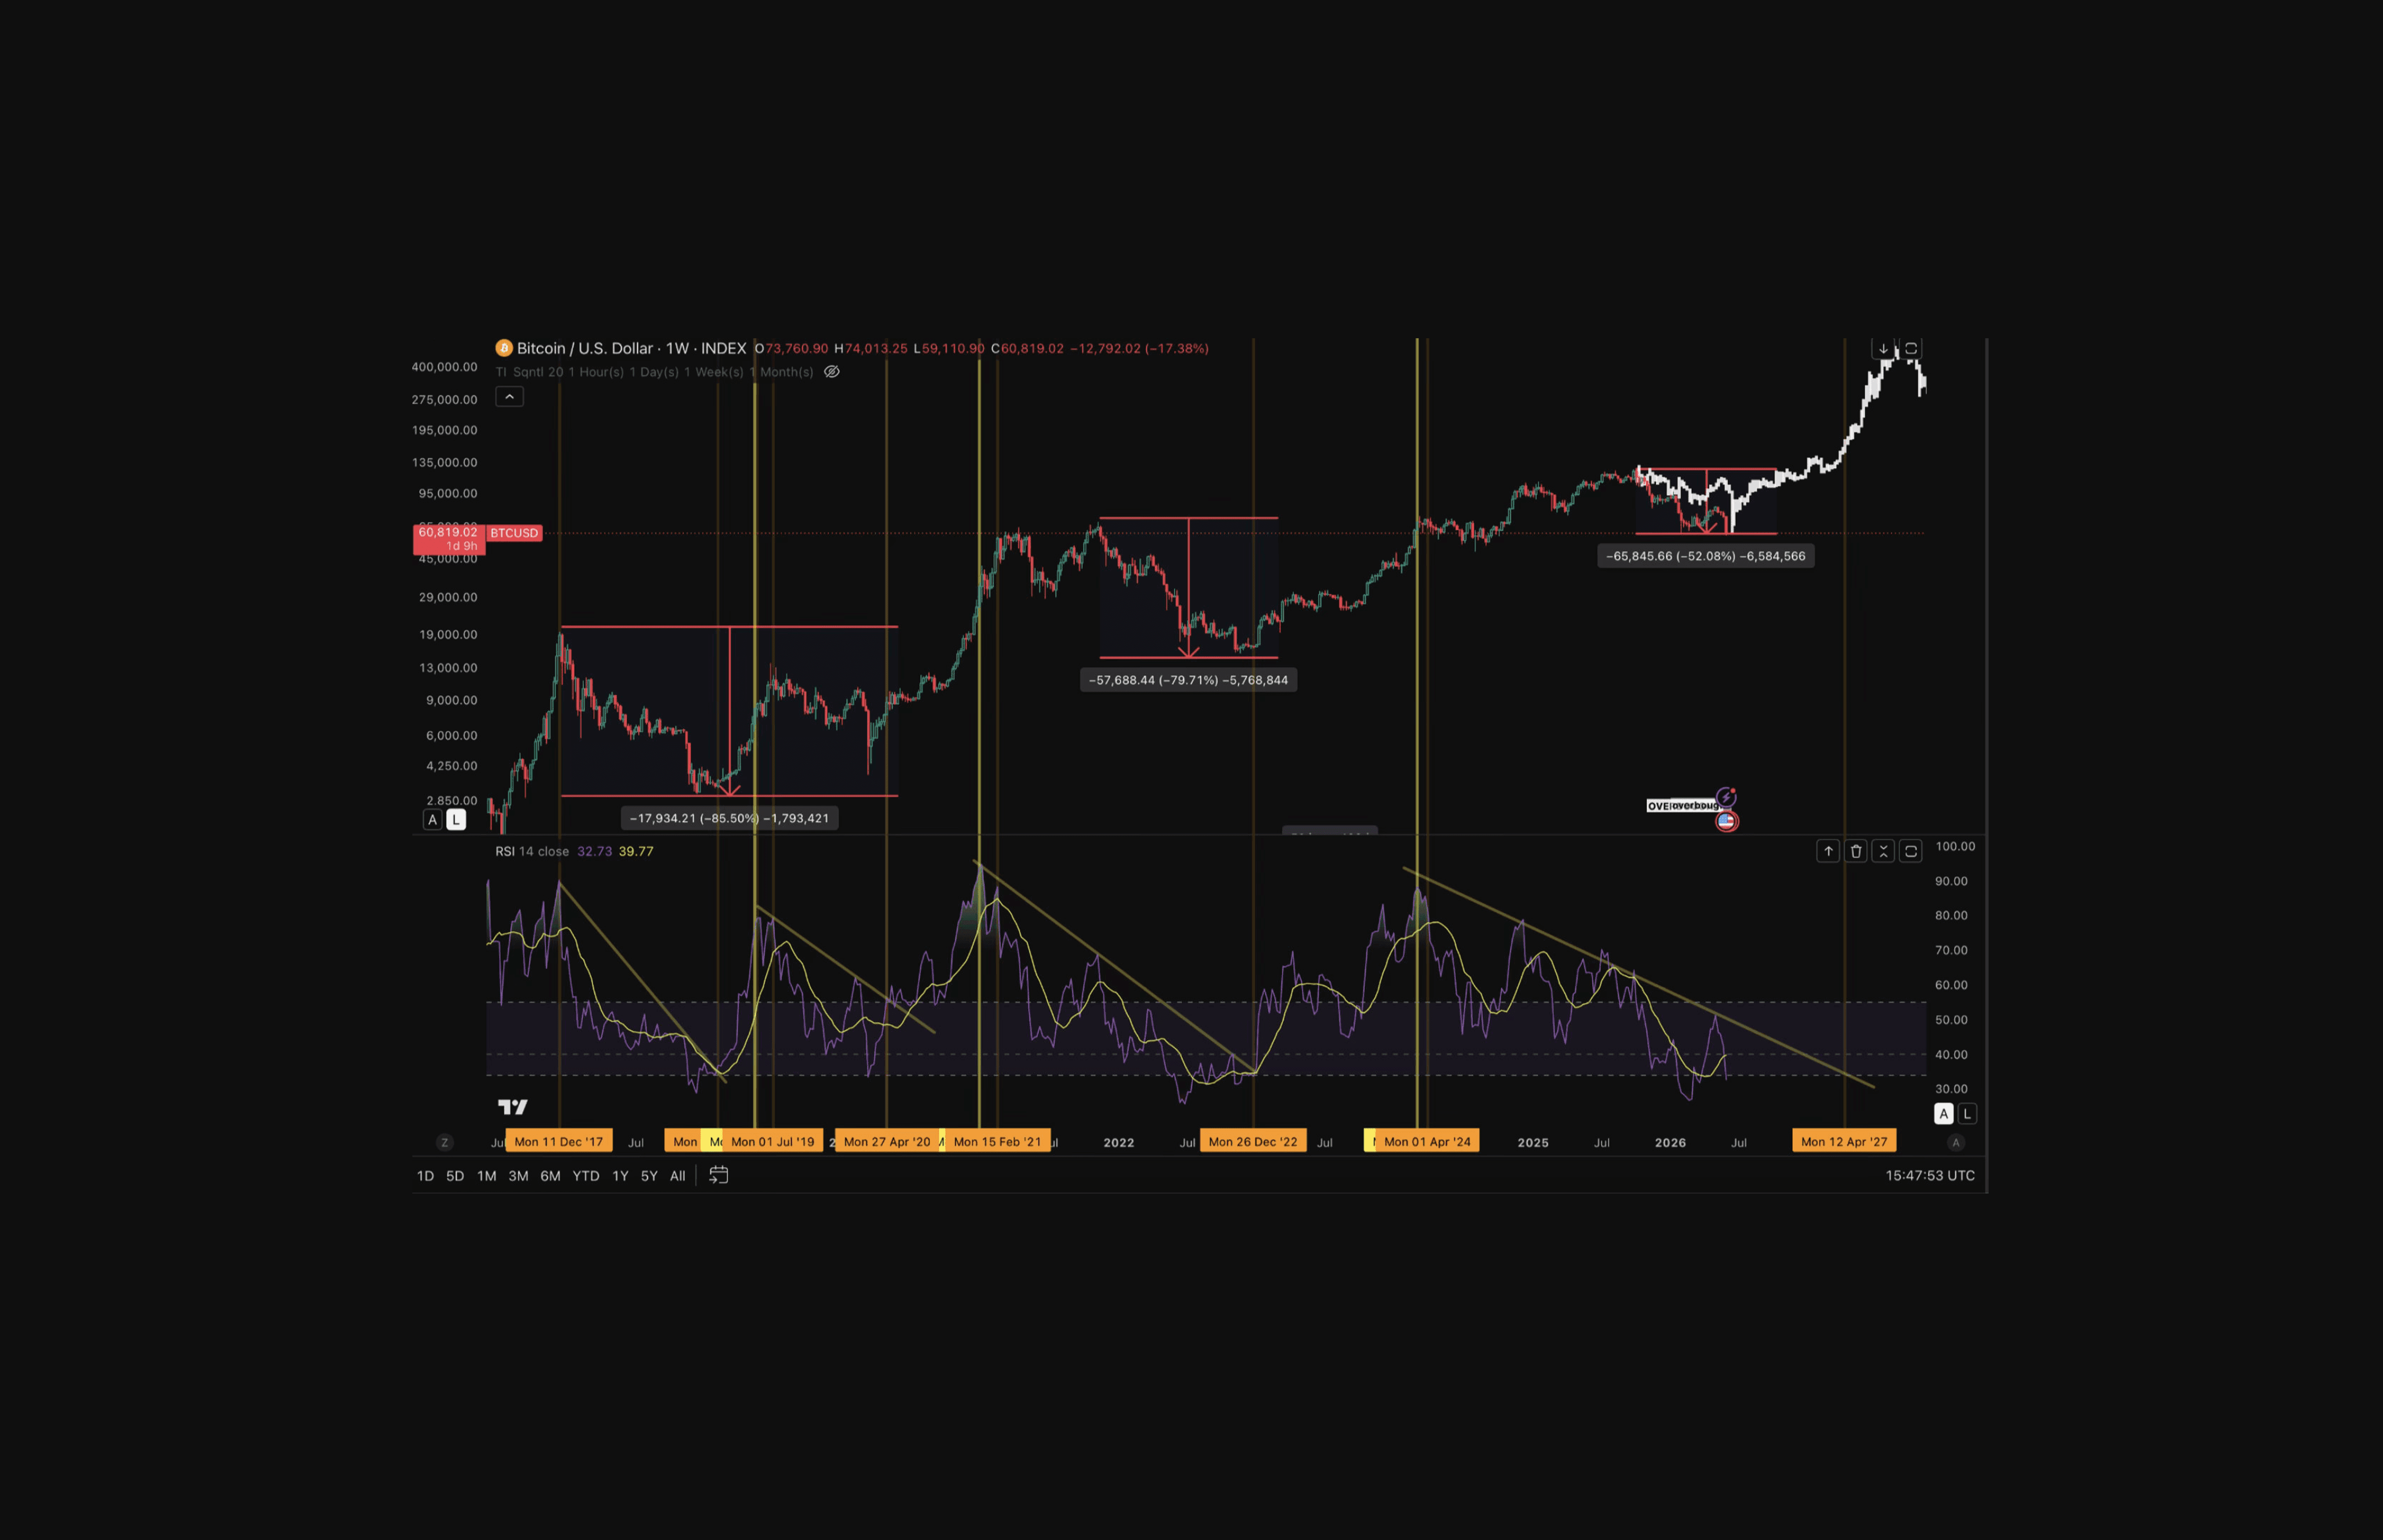
The reading from the table:
Current drawdown has no catastrophe attached: COVID and FTX were external shocks that forced liquidation. The 2026 bleed has no single exogenous trigger
Shallower trough, same fear: A 50% drawdown producing 2018-level pessimism is consistent with a maturing holder base. Fewer speculative holders means the marginal seller capitulates earlier in the move, not that the asset is weaker
RSI compression matches prior multi-month bottoms: Weekly RSI in the low 30s has marked the terminal phase of every prior multi-month bear structure. The 2020 COVID crash was the exception, a violent short event that reversed before RSI fully compressed.
Bitcoin Price Gap That Never Filled
The popular case for $30k to $40k rests on the idea that gaps always fill. Bitcoin's own price history disagrees.
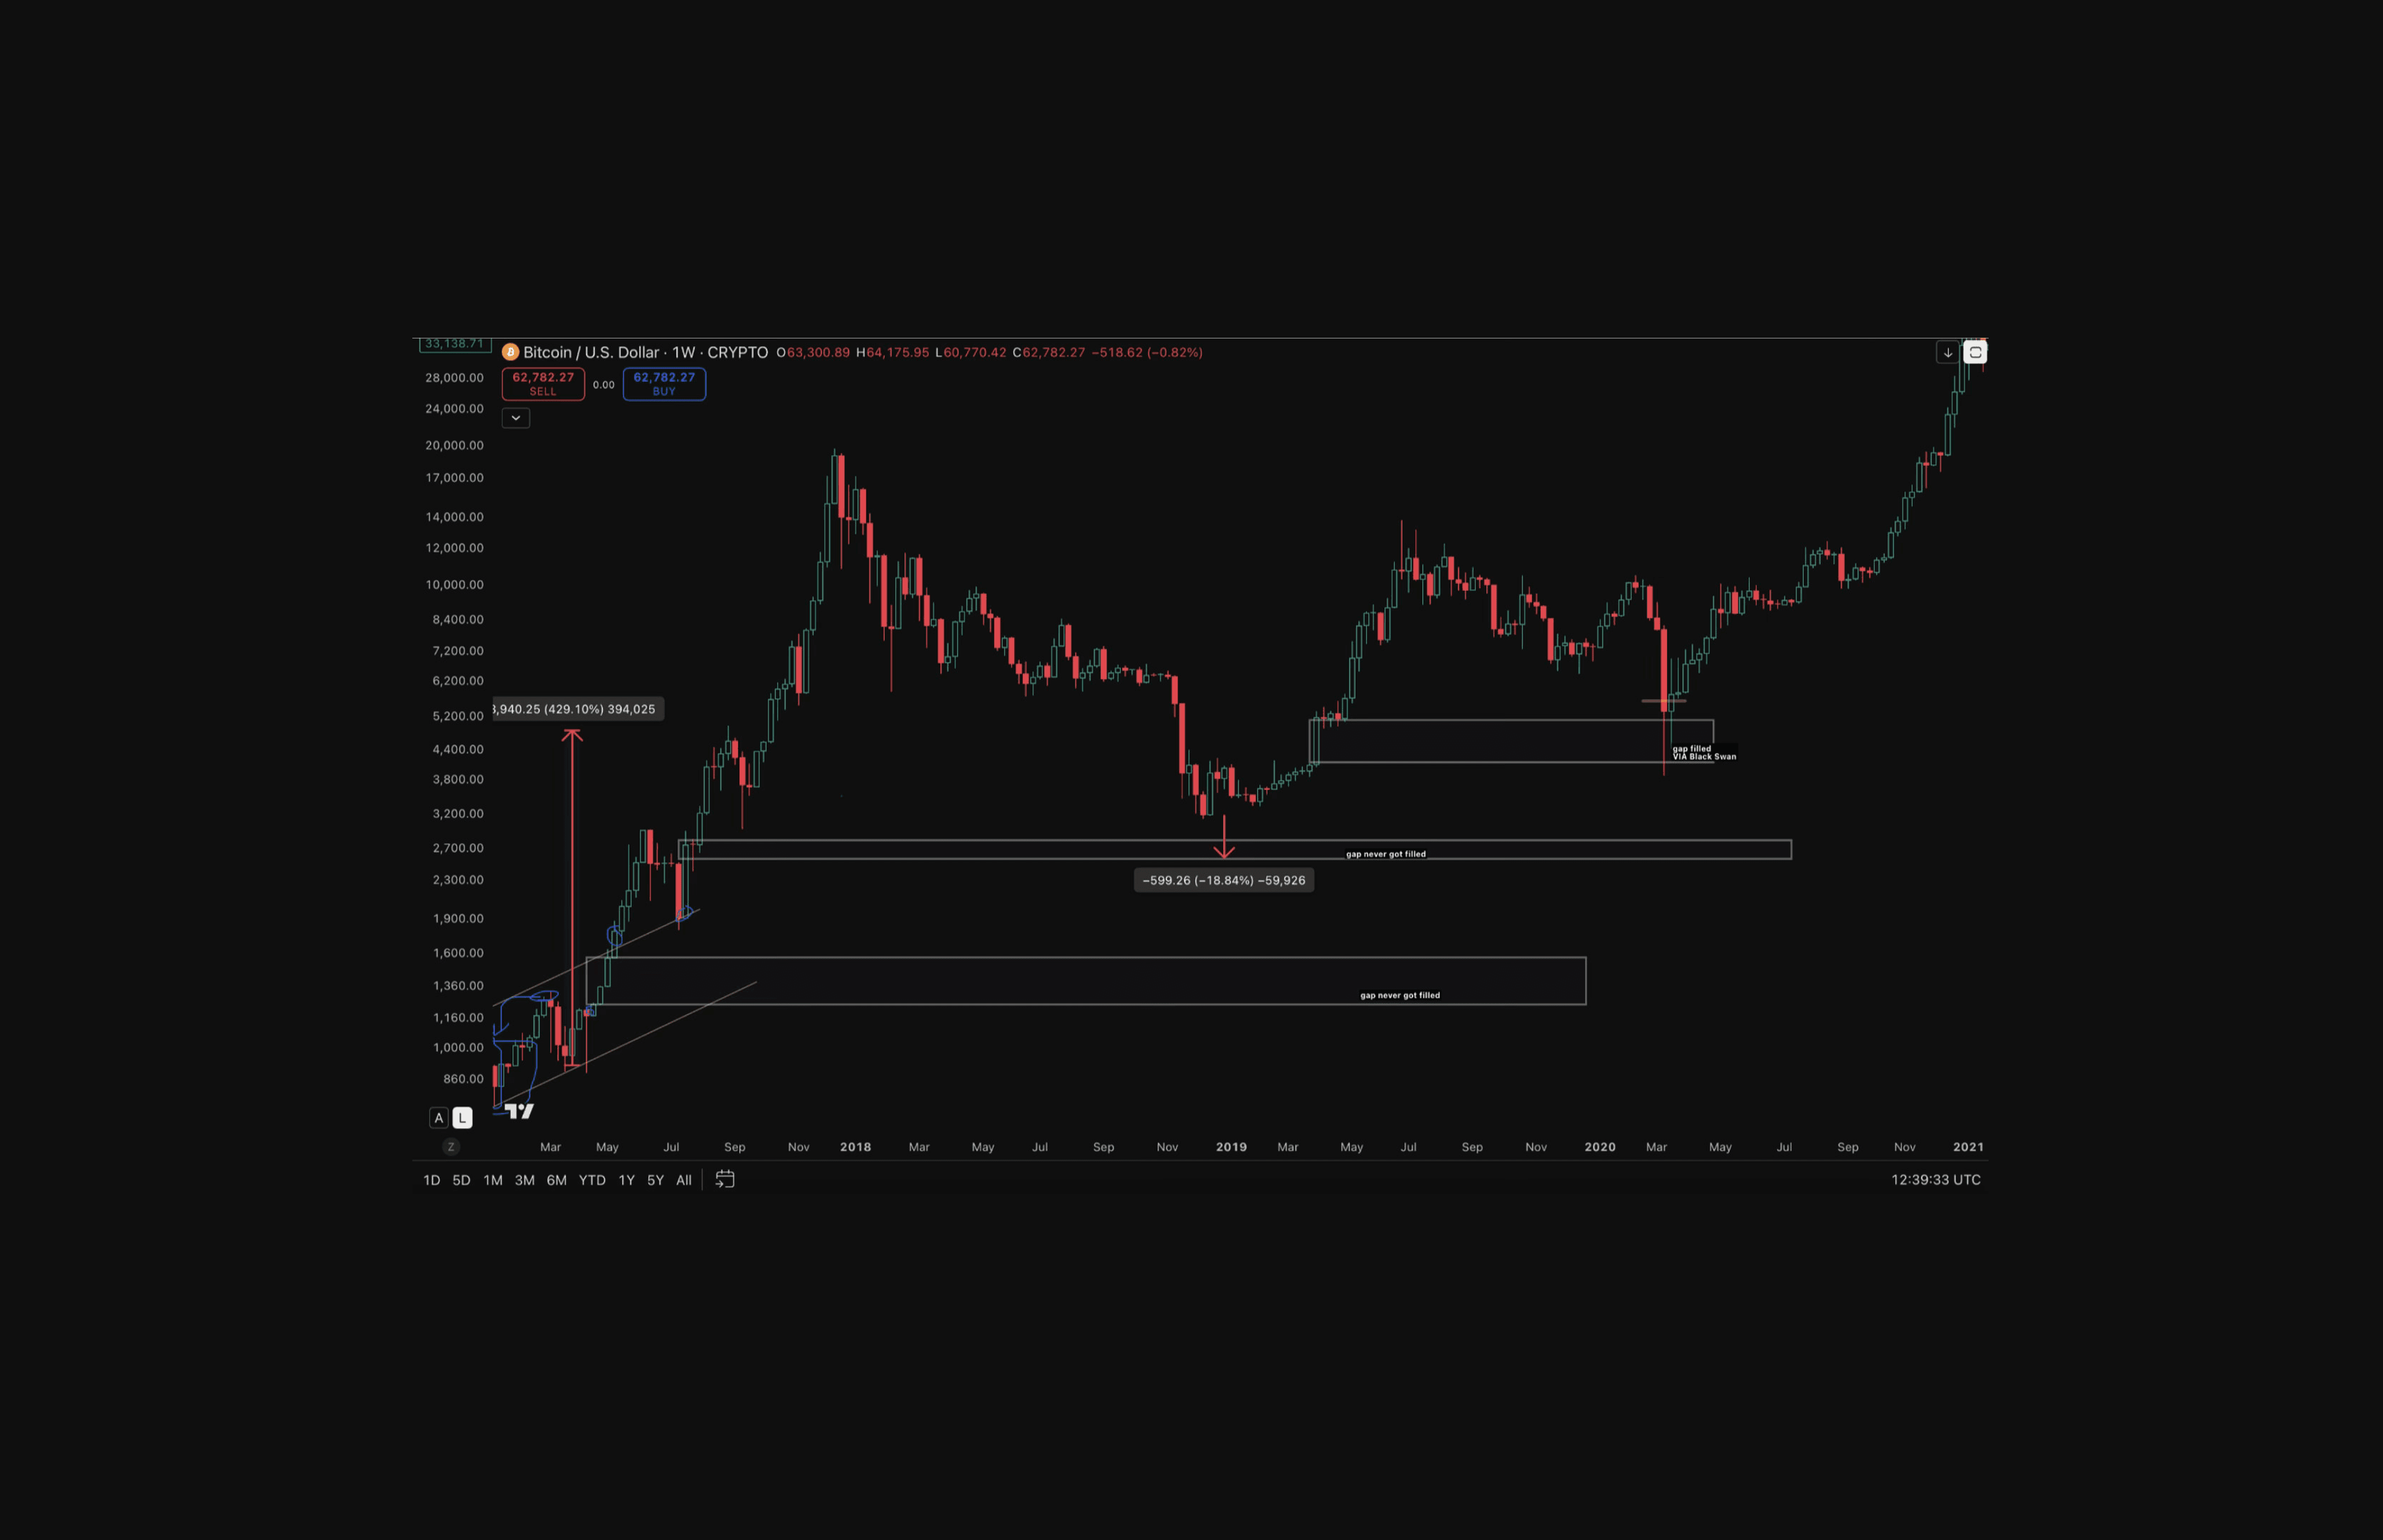
Two 2017 gaps remain open at $1.4k and $2.7k: The 2018 bear market, an 85% drawdown, didn't fill
Gaps lose validity when fundamentals outrun the pattern: Less than 1 million BTC remain to be mined against a buyer pool of eight billion people, the vast majority of whom have never purchased a single sat
Pattern is a probability, not a law: Treating gap-fill as guaranteed is how traders missed the 2019 move to $12k waiting for a gap to be filled at $1.4-$2.7k.
The Hidden Cost of Selling Bitcoin
Three groups likely make up sellers at $63k: Those funding costs, those exiting positions opened near the January highs, and those waiting for a black swan to reload lower
Sellers exit the holder pool permanently: On-chain cohort data across prior cycles shows that coins released during capitulation migrate to new holders and rarely return to the wallets that sold them
The 2017 cohort: A holder who bought at $4k in 2017, sold at $7.5k, never bought back at $3.1k in 2018, watched $69k and $126k print, and now sees a 50% drawdown that still leaves Bitcoin above every price they ever owned it at.
Sellers cannot buy the same amount back anymore. That is what tightening supply looks like from the outside.
Will the gap to $32k be filled? Possibly. But the entry the crowd is waiting for already sits above the exit it took.
The full method for trading these base structures without leverage is documented in the Coinjuice QFL ebook.
Bitcoin Bear Case: Why The Gap Could Still Fill
Most gaps in traditional markets do fill: Thomas Bulkowski's research across hundreds of stocks in his Encyclopedia of Chart Patterns shows that gaps tend to close over time, particularly partial fills within the first week. The pattern is consistent enough that traders treat unfilled gaps as magnets
Bitcoin is not a stock: The Bulkowski sample is equity data. Bitcoin trades 24/7, has no quarterly earnings, and its holder base behaves nothing like a typical stockholder.
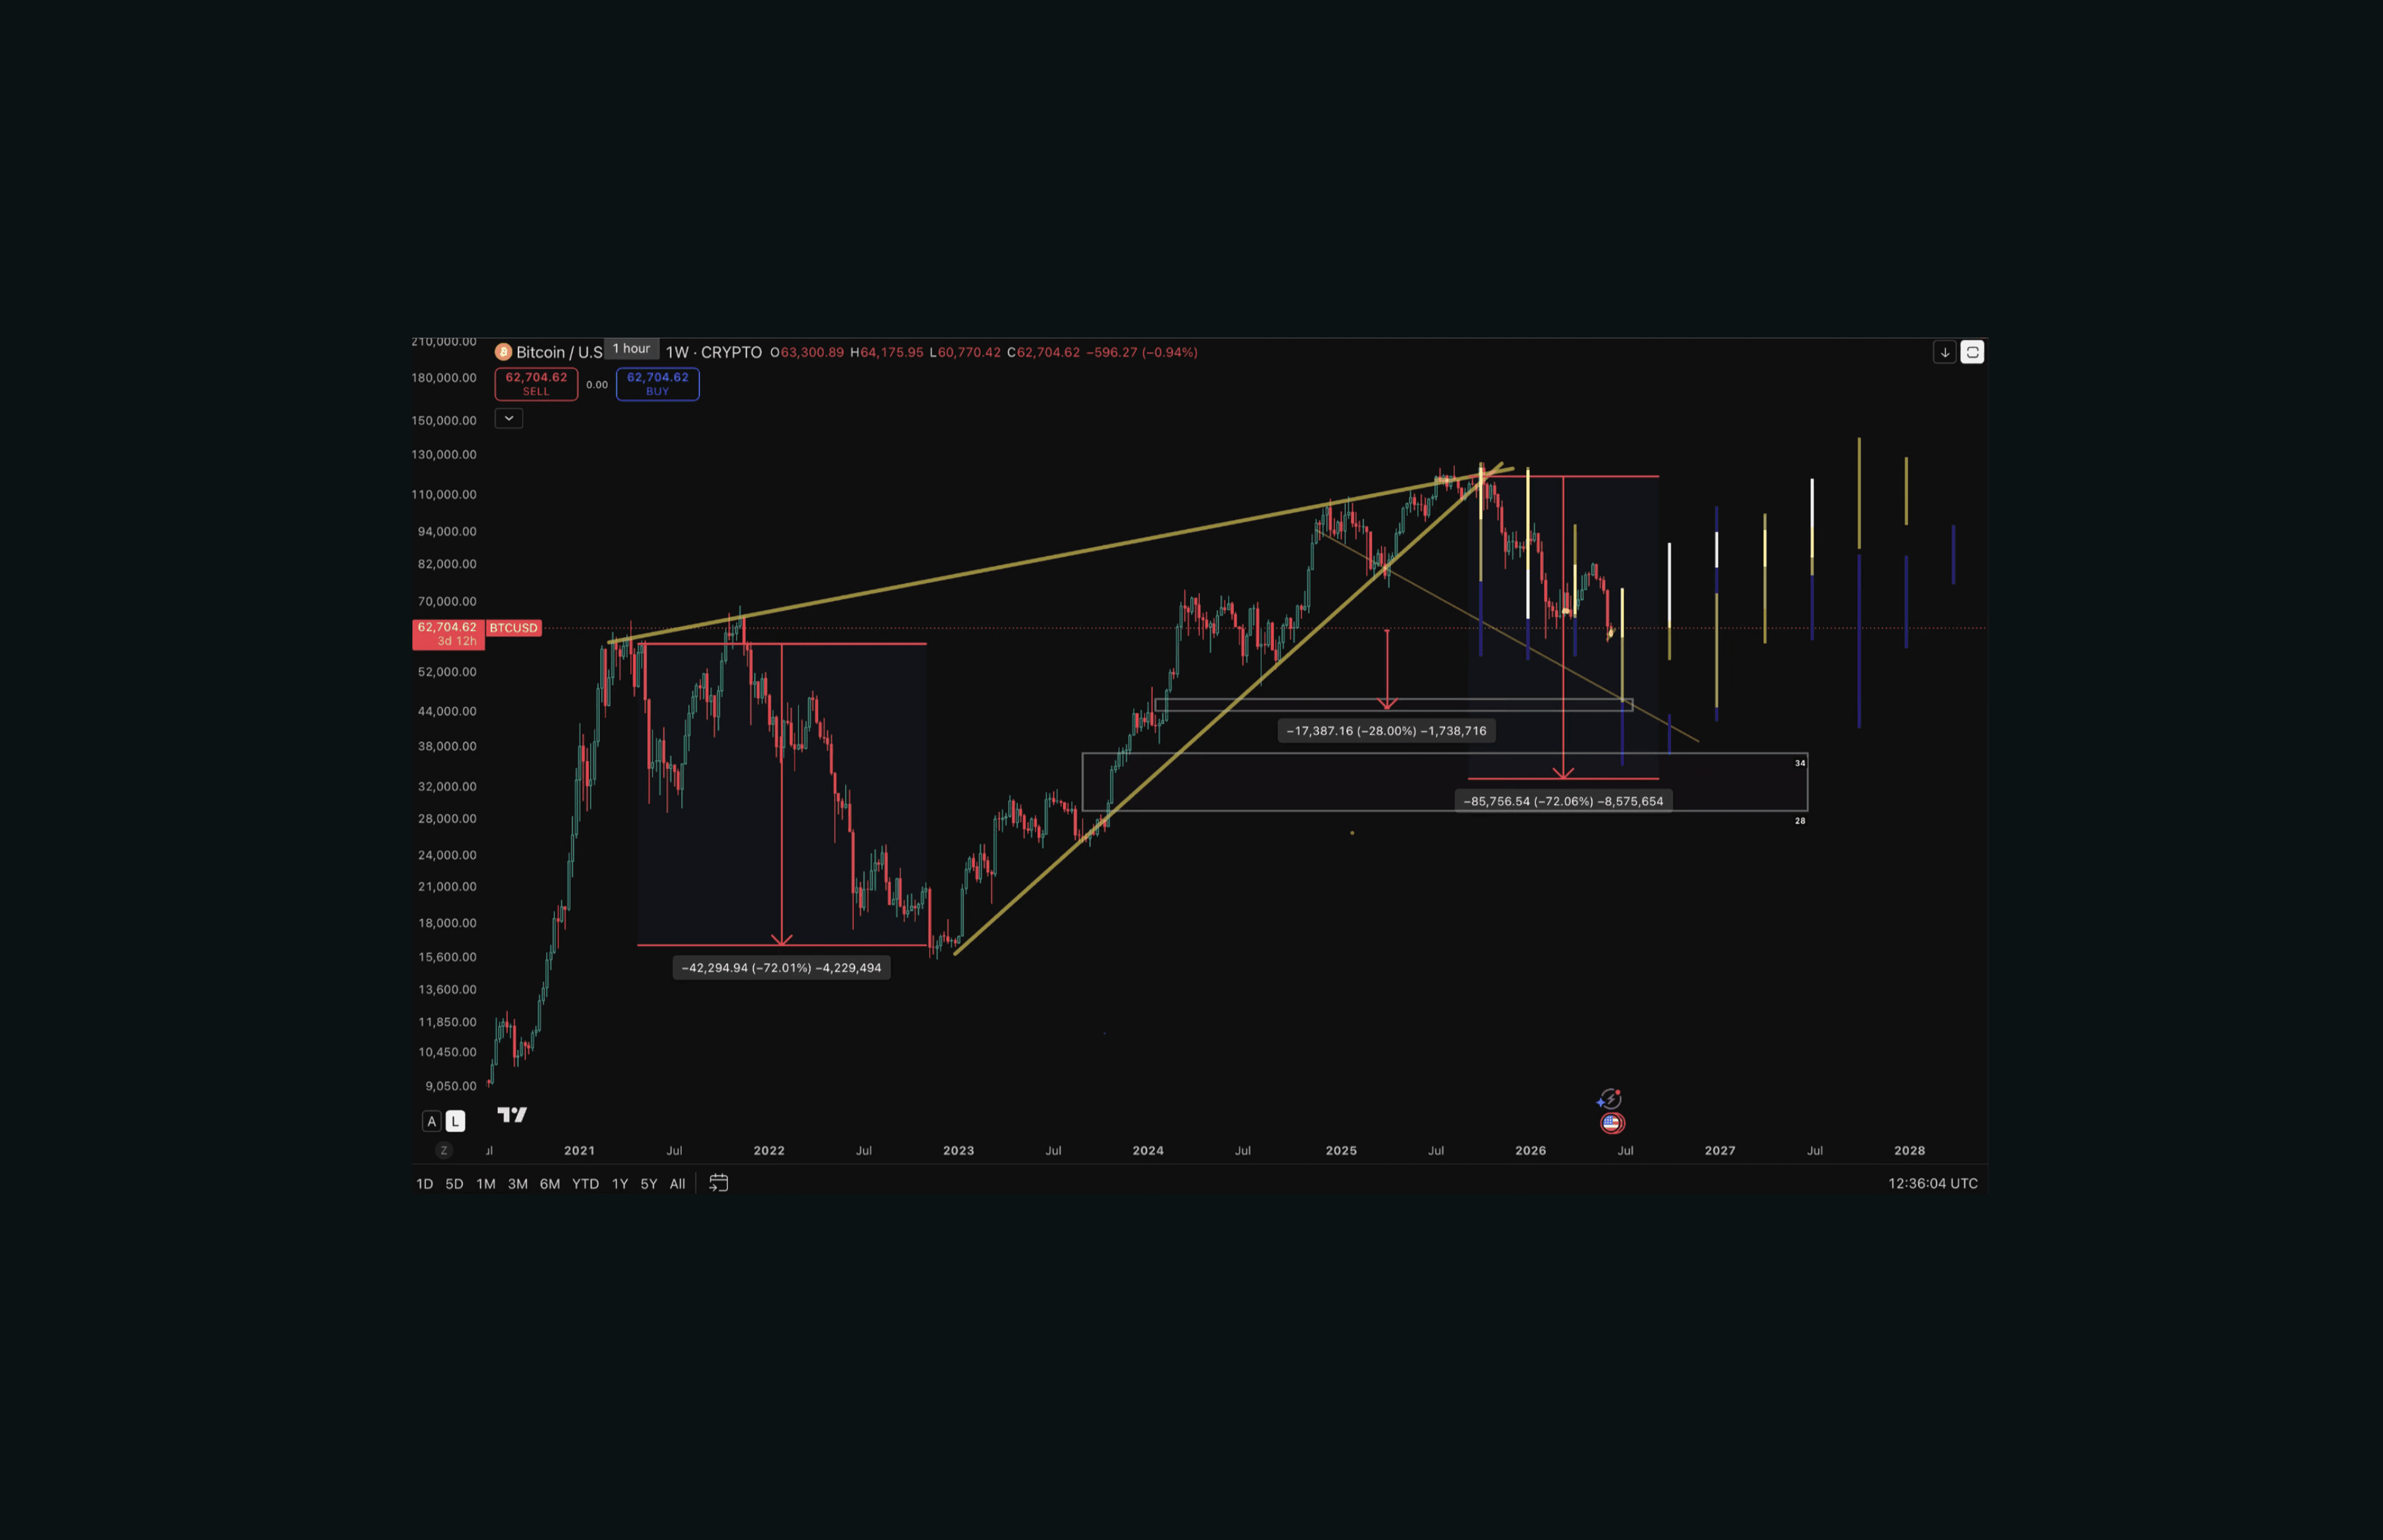
What To Watch Next
Three indicators will confirm or break the fractal:
Weekly RSI: resolving upward out of the low-30s compression band, as it did in 2015, 2019 and 2023
Long-term holder supply share: continuing to rise through this drawdown rather than fall
Multi-year ascending channel: price holding the lower boundary into early July.
FAQ
What is the main argument against Bitcoin definitely filling the gap down to $32k?
The main argument is that gap-fills are probabilities, not laws, and Bitcoin already has unfilled gaps from 2017 around $2.7k and $1.4k that even an 85% drawdown in 2018 did not reach, so assuming all gaps must fill can cause traders to miss major moves.
How does the current Bitcoin drawdown compare to previous major drawdowns?
The current drawdown is about -52.1% from roughly $126k to $60k, shallower than the -85.5% in 2018 and -79.7% in 2022, and unlike 2020 and 2022 it is sentiment-driven with no external catastrophe or black swan behind it.
Why are sellers at current levels described as unlikely to rejoin the holder pool?
On-chain cohort data across cycles shows that coins sold during capitulation phases migrate to new holders and rarely return to the original wallets, meaning those sellers effectively exit the holder pool permanently and typically do not buy back even when similar prices reappear later.
What key indicators are suggested for confirming or breaking the current fractal thesis?
The key indicators are weekly RSI resolving upward out of the low-30s band, long-term holder supply share continuing to rise rather than fall during the drawdown, and Bitcoin price holding the lower boundary of its multi-year ascending channel into early July.
Disclaimer
The information provided in this article is for informational purposes only. It is not intended to be, nor should it be construed as, financial advice. We do not make any warranties regarding the completeness, reliability, or accuracy of this information. All investments involve risk, and past performance does not guarantee future results. We recommend consulting a financial advisor before making any investment decisions.
More like this


Written by

Andrew Kamsky
Andrew Kamsky is a Bitcoin analyst. He spent a decade in traditional finance across a Big Four firm and a listed fintech bank before going deep on Bitcoin full-time.


