










Quick summary
Article presents a four-layer chart-reading framework using candlesticks, timeframes, levels, volume
Candlesticks show control and indecision; patterns matter only at important price levels
Timeframe choice must match trading style and lifestyle; support resistance drawn as zones
Volume confirms moves; follow a consistent multi-step process and avoid common beginner mistakes
Traders shouldn't fall back on the excuse that they lose money because the market was unpredictable. They lose it trading on a feed, a call-out account, or whatever chart got the most replies that hour. A chart doesn't predict the future. It shows what buyers and sellers actually did, which is a different thing entirely, and a more useful one.
The traders who stay in the game long enough to compound aren't the ones who guess right more often. Traders who are in the game long enough are the ones running the same process every time, on every chart, regardless of what Twitter thinks that day.
The Four-Layer Framework for Reading Charts
Four layers, read in order, cover everything a beginner needs before adding a single indicator:
Candlesticks: tells what happened within a period of time
Timeframes: when it happened, and whether it matters
Support and resistance: where price has reacted before
Volume: how much conviction was behind the move
Skip a layer and the read isn't wrong, just incomplete, missing the context that would help read the chart better and give the trader more to work with.
Layer 1: Understanding Candlesticks
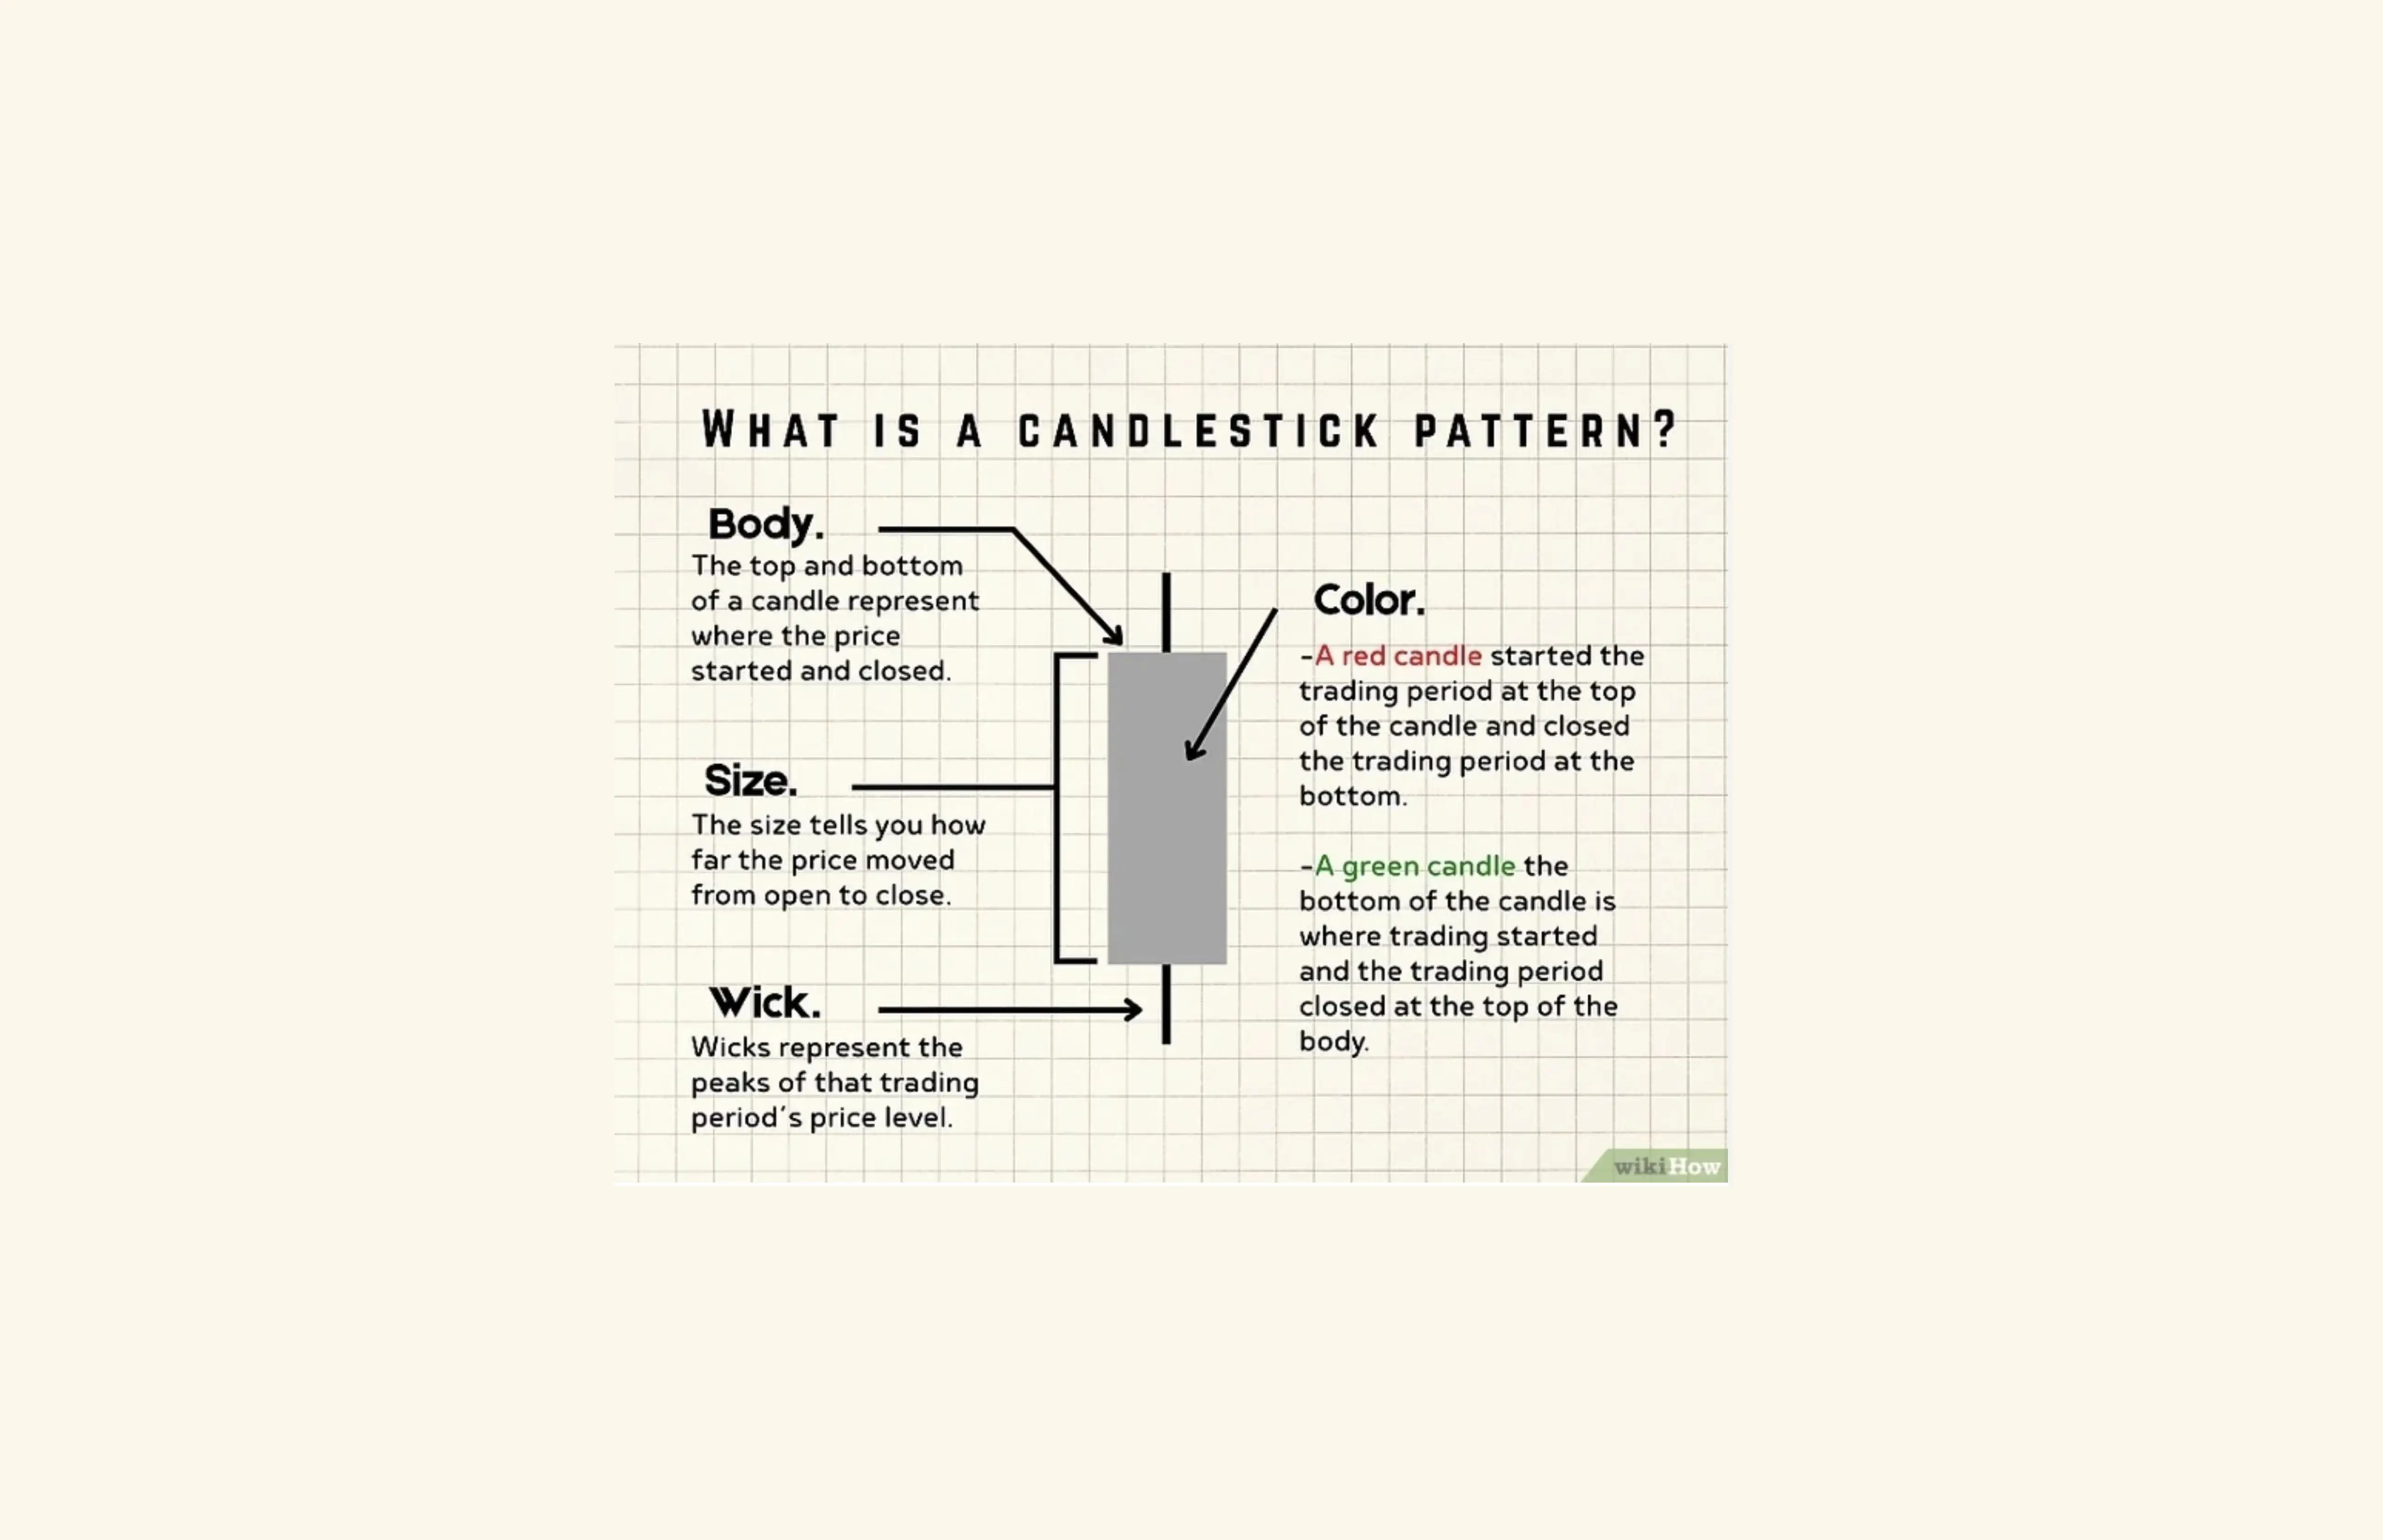
A candlestick packs four numbers into one shape: open, high, low, and close for whatever period it covers.
Green vs. red: Green means the price went up over that period. Red means price went down. The thick part of the candle (body) shows how much it moved. The thin lines poking out the top and bottom (wicks) show the highest and lowest price it touched before settling back down.
What the body tells you: A long, thick candle means one side, buyers or sellers, was clearly in control. A short, skinny candle means neither side really won and people couldn't agree on a direction, which is worth noticing too, because it signals indecision.
What the wicks tell you: A long line poking up means the price tried to go higher but got pushed back down. Where buyers lost that fight. A long line poking down means the price tried to drop but got bought back up implying sellers lost that fight.
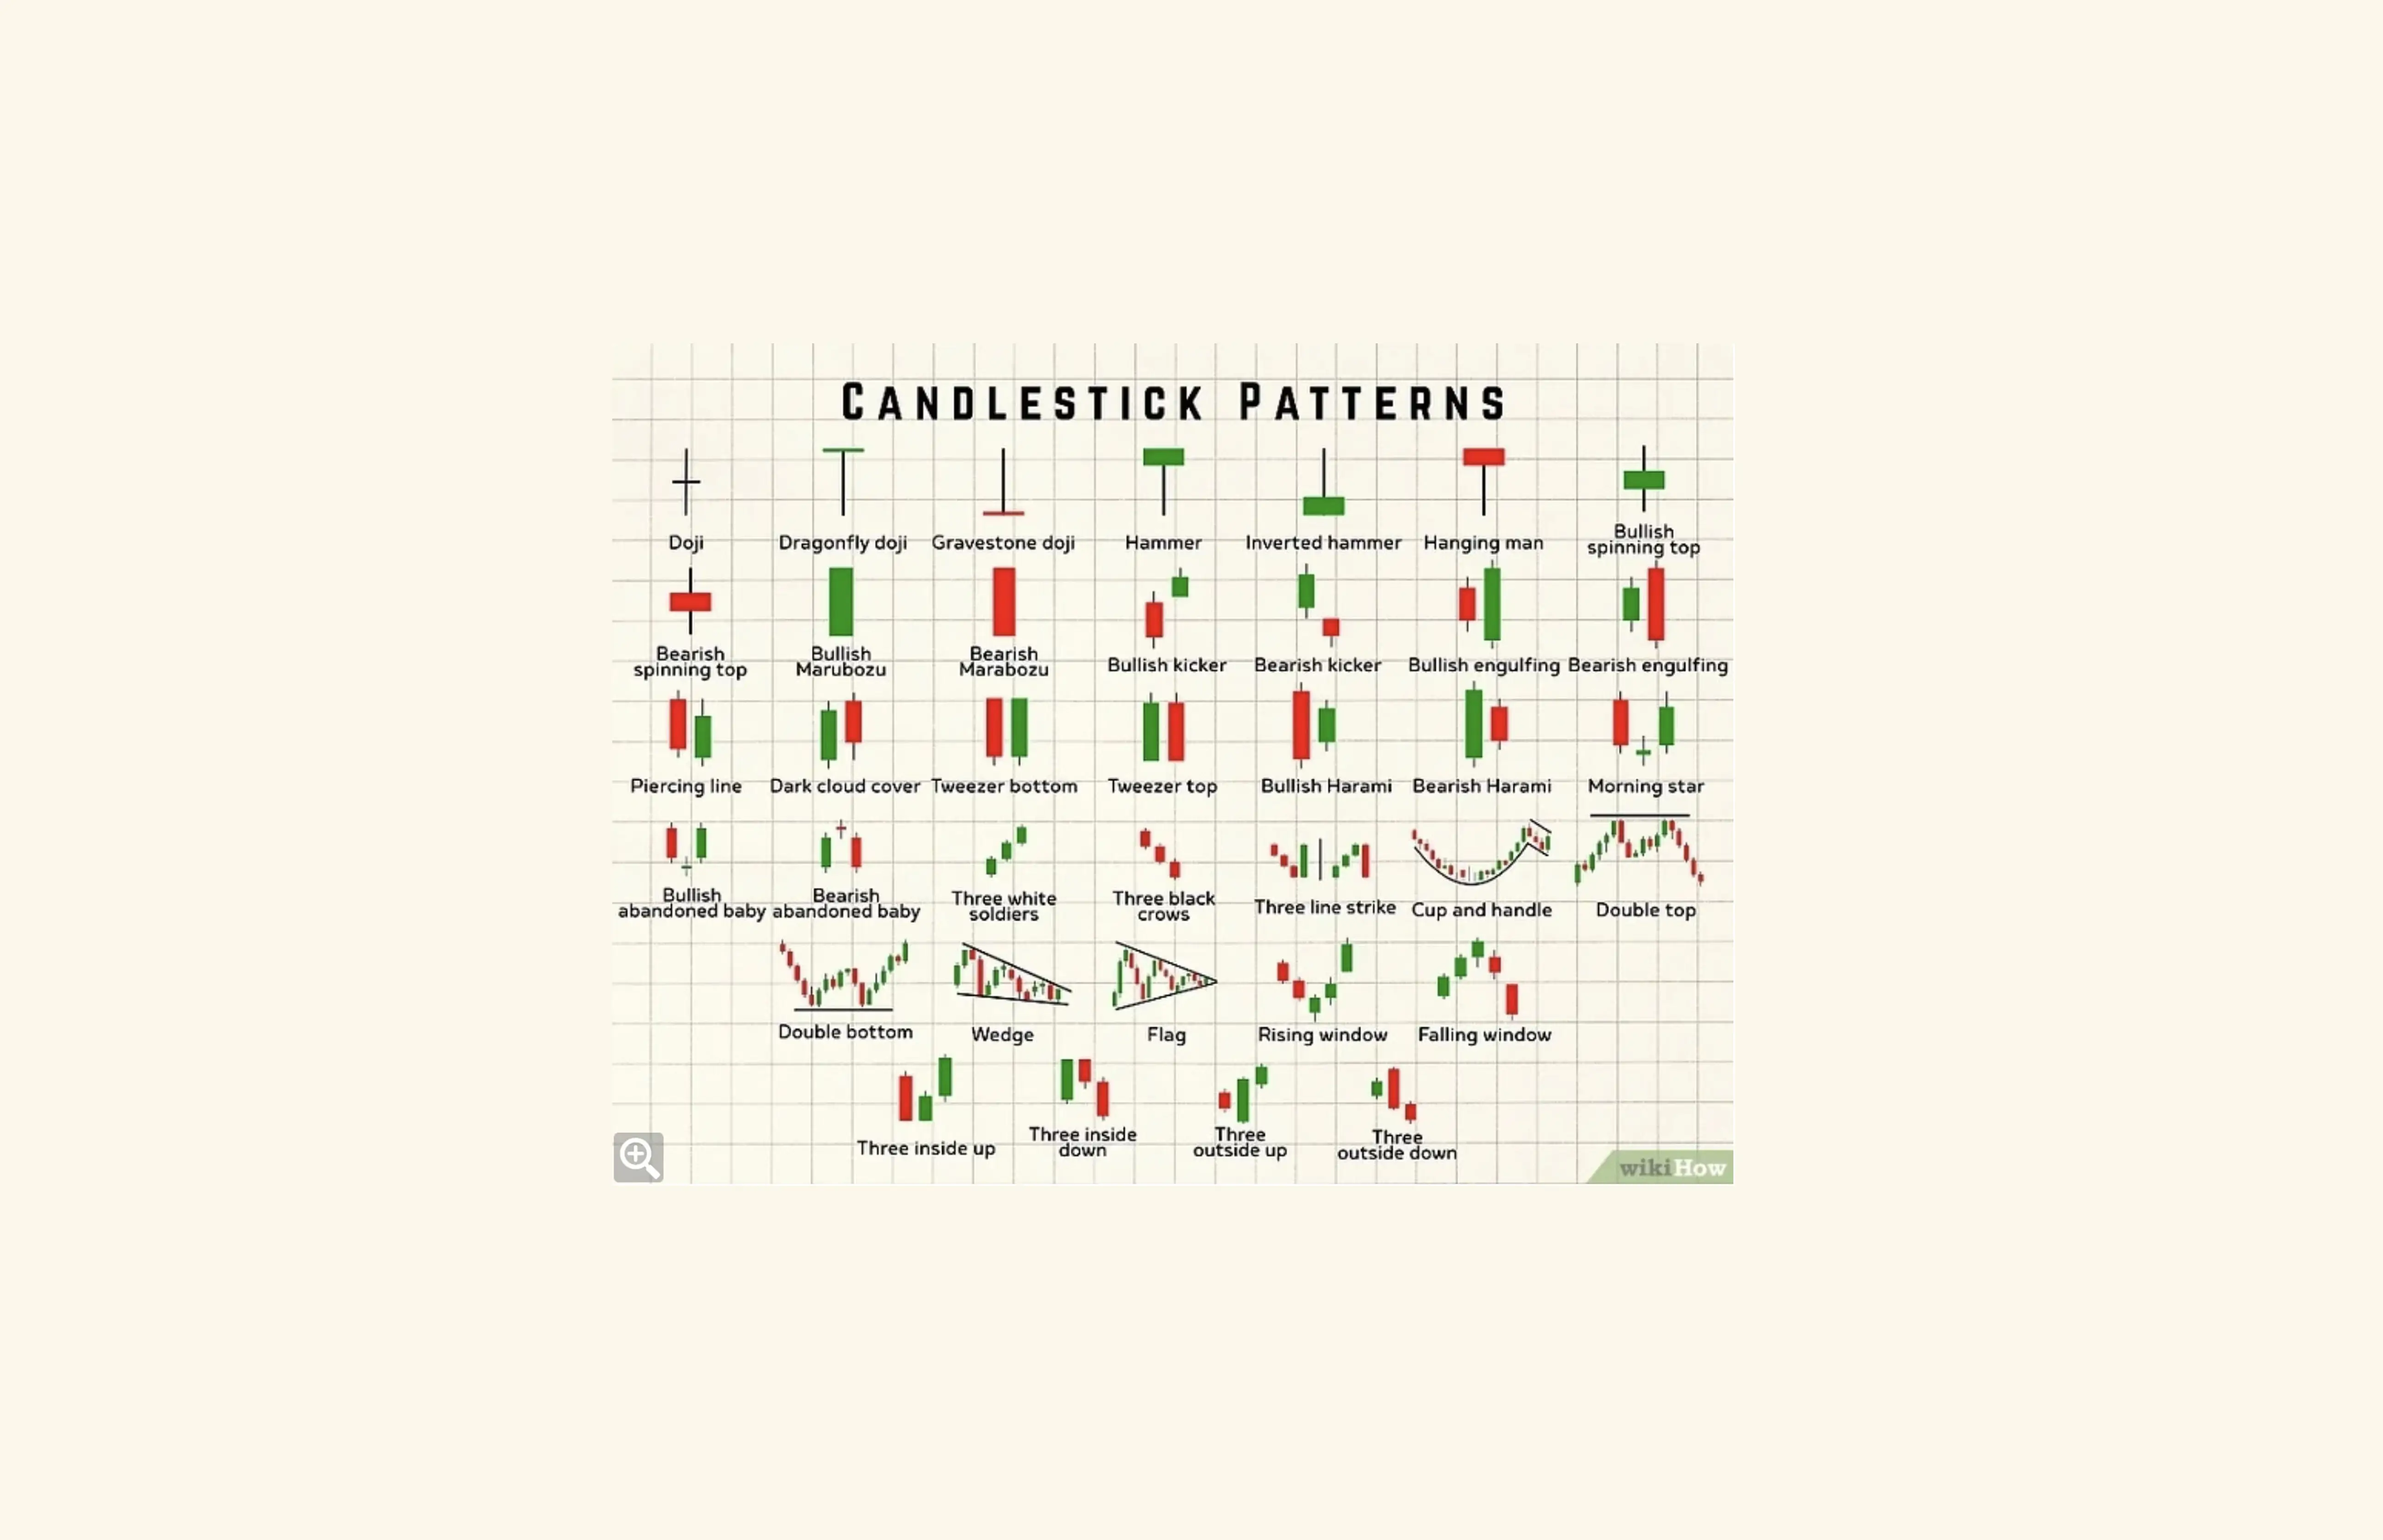
Patterns worth recognizing, not memorizing: A doji is a candle where the open and close are almost the same price — it means nobody's in control. A hammer is a small candle with a long wick underneath, and it often shows up near the bottom of a drop. A shooting star is a small candle with a long wick on top, and it often shows up near the top of a rally. None of these mean much on their own — they only matter when they show up at a price level that's already important.
Layer 2: Timeframes and Context
The same chart tells two different stories depending on which timeframe it's viewed on. A bullish setup on the 1-hour chart can sit inside a bearish daily trend, and the daily trend usually wins.
As a trader understand which kind of “trader” you want to assume:
Scalping: 1-minute to 5-minute charts
Day trading: 15-minute to 1-hour charts
Swing trading: daily to weekly charts
Position trading: weekly to monthly charts
This isn't just a technical choice, it's a lifestyle one. A scalper is glued to the screen for the entire session; step away for ten minutes and the setup is gone.
A day trader needs to be present for the hours the trade is open, but the day ends and so does the watching. A swing trader can check in a couple of times a week and let the trade breathe between visits.
Finally, a position trader can go about their day almost entirely undisturbed, with alerts and limit orders doing the watching instead of a screen. Pick the timeframe that matches the trade you actually have time to manage, not the one that looks most exciting.
Layer 3: Support and Resistance
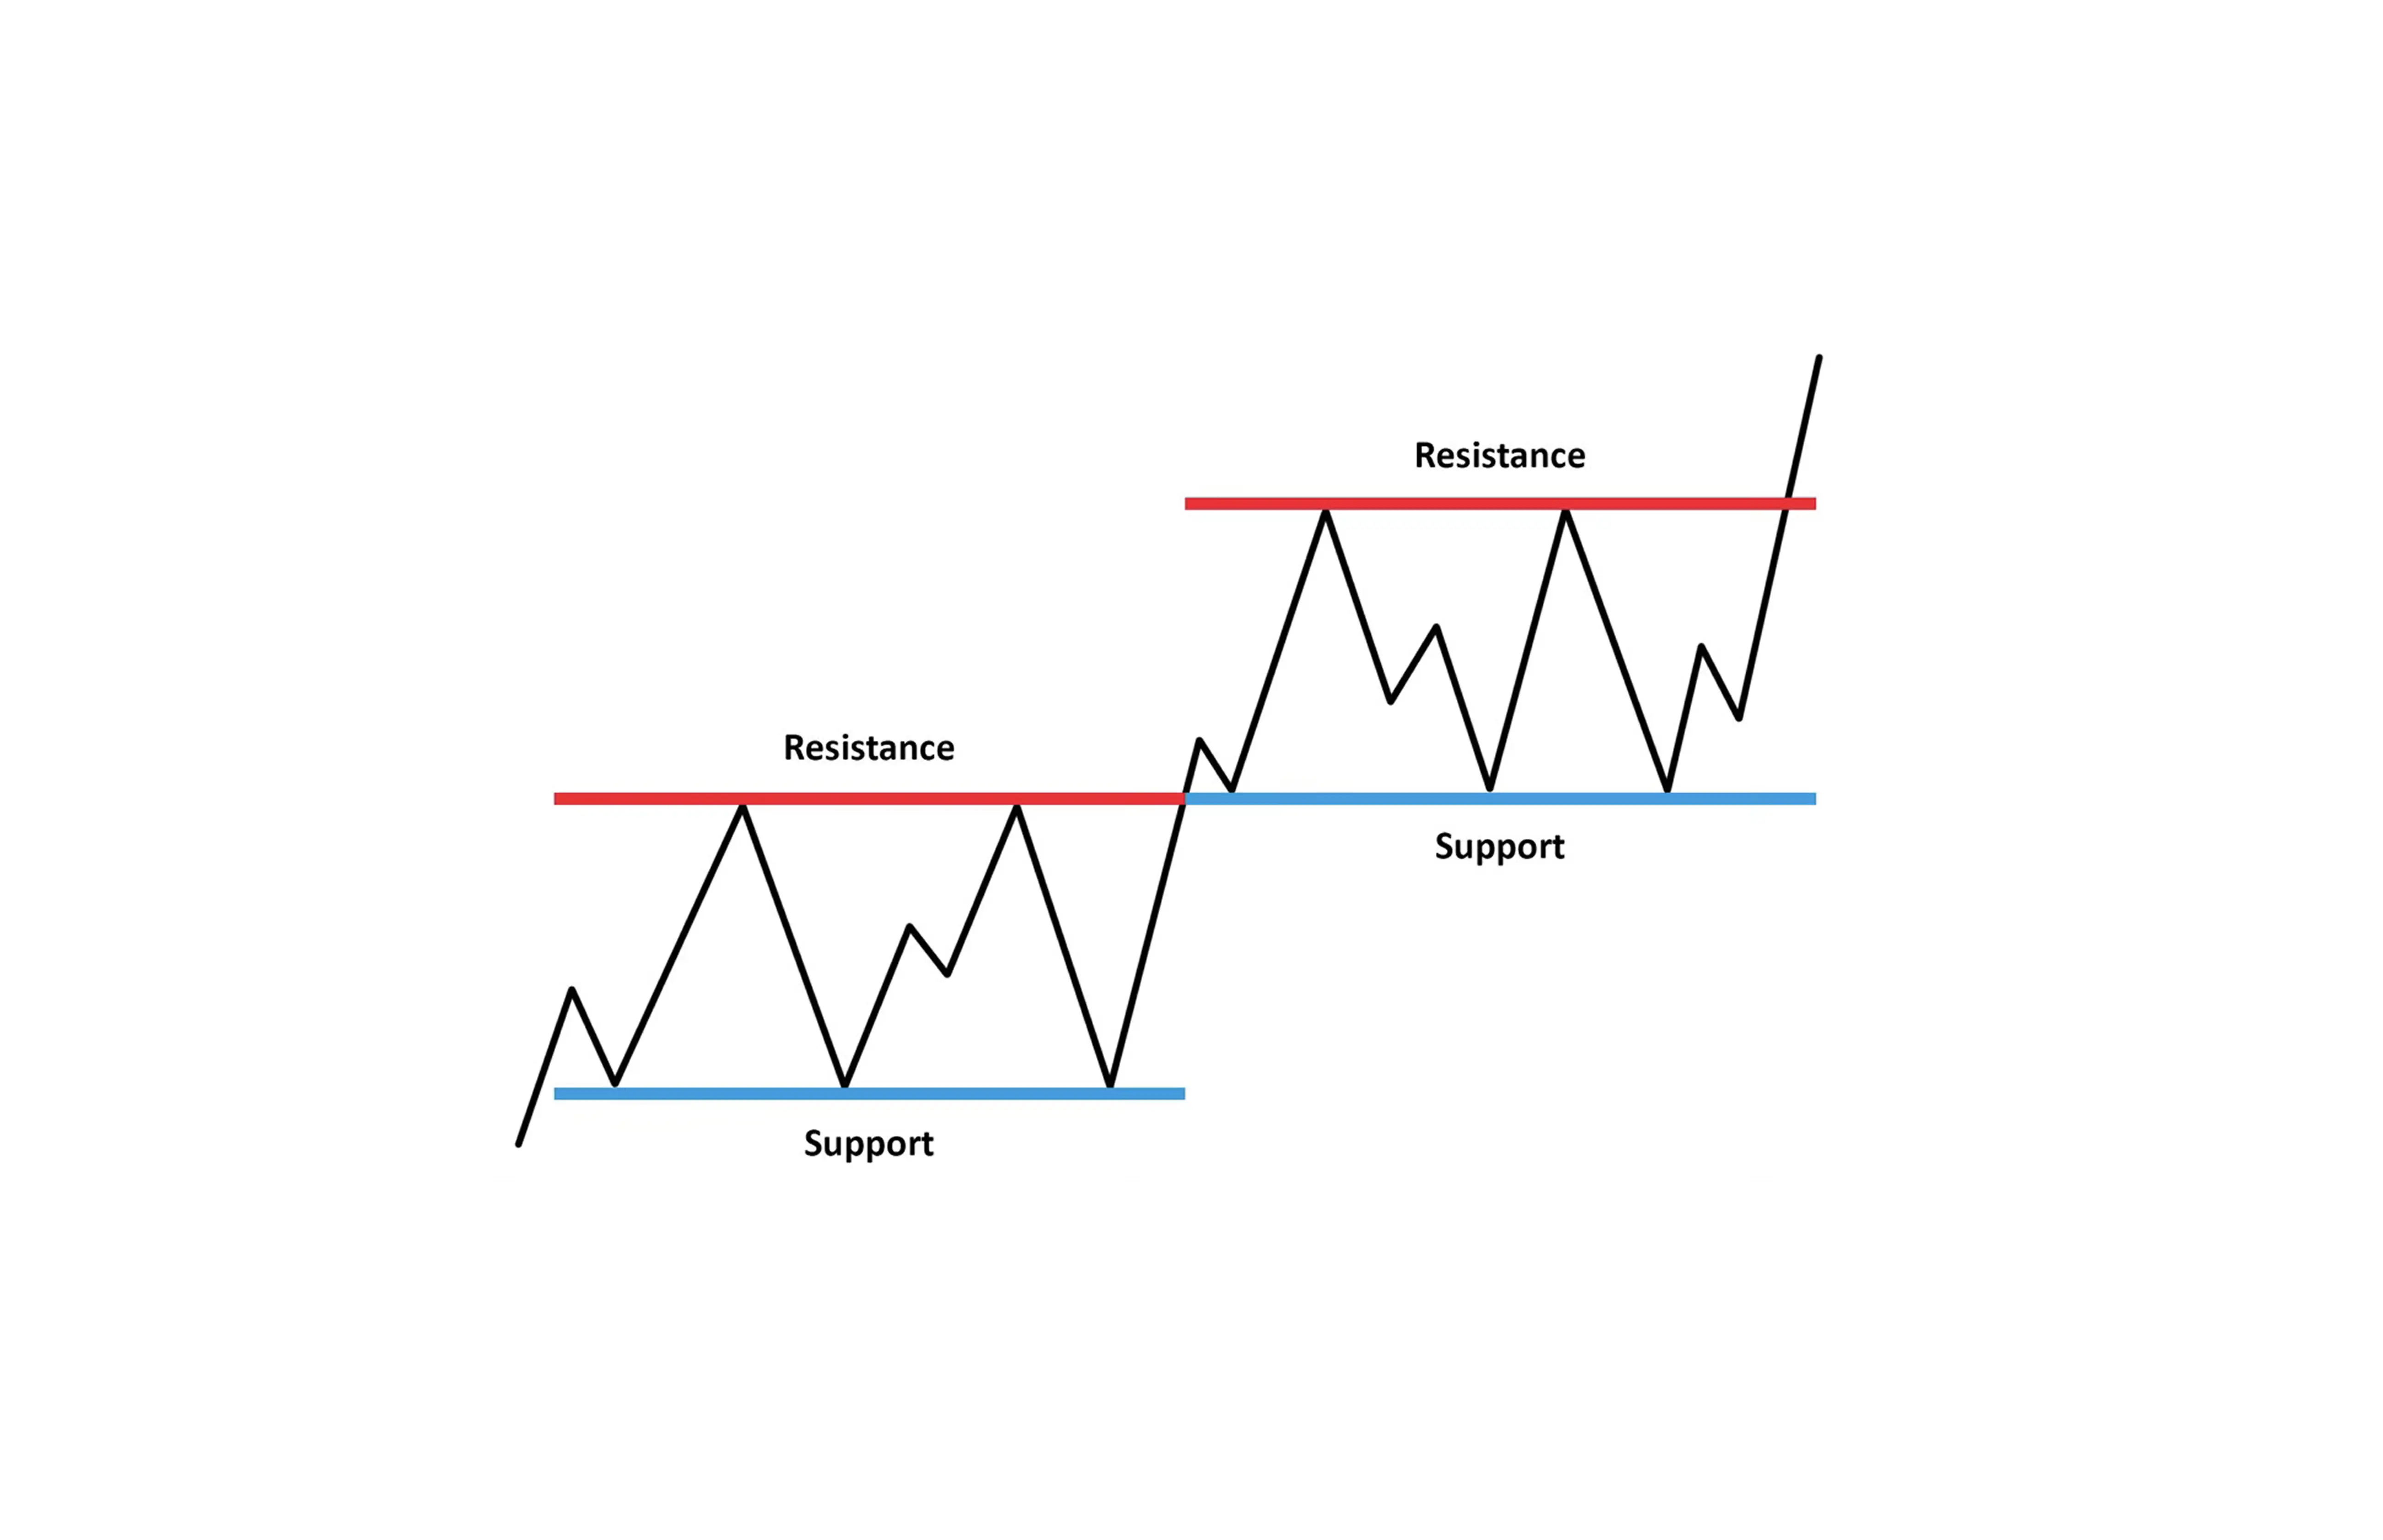
Support and resistance marks where buying and selling pressure has historically concentrated. They repeat because the people trading a market today aren't behaving fundamentally differently from the people trading it a year ago. Meaning the psychology holds even when the price doesn't.
Support: price has bounced here more than once, on real volume, and a former resistance level flipped into support after being reclaimed.
Resistance: price has been rejected here more than once, on real volume, and a former support level flipped into resistance after breaking down.
Draw zones, not lines: A single wick isn't a level. A level is a zone where price has reacted multiple times. If a line only holds up because of one candle's shadow, it isn't a level yet.
The break-and-retest: When resistance breaks, it often becomes the new support on the retest. When support cracks, it often becomes the new resistance. This flip shows up often enough in crypto that it's worth building an entire entry rule around it: don't chase the break, wait for the retest.
Layer 4: Volume and Confirmation
Volume tells you whether a move is real or borrowed. High-volume moves tend to continue. Low-volume moves tend to fail and snap back.
Volume and breakouts: A breakout above resistance needs volume behind it to be trusted. A low-volume breakout is less credible and looks like a move until the first real seller shows up (dead cat bounce). The same logic applies in reverse to breakdowns below support.
Divergence: Price making a new high while volume shrinks is a weakening trend, even though the price chart alone looks fine. Price making a new low while volume shrinks can mean the selling is running out of participants, not necessarily done falling, but running thin.
Reading the bars: Volume bars sit at the bottom of most charts, usually colored to match the candle. The height matters more than the color, a tall red bar on a down day says more than the color.
Building Your Chart Reading Process
The edge isn't in complexity. It's in doing the same five steps, in the same order, every single time.
Start with the weekly chart: Identify the dominant trend before looking at anything else. Try not to fight the trend.
Mark the key levels: Major support and resistance on the primary timeframe become the reference points for every decision that follows.
Check volume context: Was the last breakout confirmed? Is the market currently in a high- or low-volume environment?
Locate current price relative to those levels: Is price trending around support, resistance, or drifting in the middle of a range with each implies a different risk and a different plan.
Plan both scenarios before either happens: What does a break higher look like? What does a crack lower look like? Decide the response to both before price forces a decision under pressure.
Common Mistakes That Cost Money
Trading against the higher timeframe trend: A bearish daily chart makes bullish 1-hour setups unreliable more often than not. Fighting the dominant trend is the single most common way beginners give back gains.
Ignoring volume entirely: A price move without volume behind it is a move that hasn't proven anything yet. Check volume before trusting a breakout or breakdown.
Drawing too many lines: A chart with fifteen support and resistance lines has zero useful ones. Keep the three to five levels that have actually been tested and ignore the rest.
Overcomplicating the read: Simple analysis done consistently outperforms complex analysis done occasionally. Add indicators after the fundamentals are automatic, not before.
Mixing timeframes to justify a trade: Using a 5-minute chart to talk yourself into a trade based on daily-chart logic is a rationalization, not analysis. Keep timeframes separate.
These aren't the only structural errors that show up in retail trading, either Coinjuice's breakdown of five recurring mistakes retail investors keep making in 2026 covers the ones that live outside the chart itself: chasing crowd sentiment, misusing leverage, and buying every dip without checking the structure underneath it. Worth reading alongside this framework, not instead of it.
Next Steps: From Basics to Advanced Analysis
Master these four layers before adding anything else. Every more advanced technique sits on top of this foundation, and skipping ahead just means re-learning the fundamentals later, usually after a loss makes the point more memorable than this article ever could. In trading, mistakes will happen. That's okay, they are normally valuable experiences that teach you more about yourself than trading. Address your flaws because you become a better trader.
Practice on historical charts first. Pick any coin, walk through all four layers, and repeat until the process runs on its own without conscious effort.
The entry and exit mechanics that pair with this framework, how to size a position and set levels without touching leverage or a liquidation risk, are covered step by step in the Coinjuice ebook, Bitcoin Trading Without Leverage. It's the practical half of what's outlined here.
For the ongoing version of this process, applied live to Bitcoin and digital assets every week, Coinjuice PRO runs structured chart breakdowns with entry, exit, and invalidation levels for every setup, starting at $6.99/month billed annually. The goal isn't to hand over trades to copy. It's to show the reasoning behind them until reading a chart this way becomes automatic.
FAQ
What is the four-layer framework for reading charts?
The four-layer framework consists of: 1) Candlesticks, which tell what happened within a period of time; 2) Timeframes, which show when it happened and whether it matters; 3) Support and resistance, which mark where price has reacted before; and 4) Volume, which shows how much conviction was behind the move.
How should a trader choose the right timeframe?
Choose the timeframe that matches the trade you actually have time to manage. Scalpers use 1–5 minute charts and are glued to the screen, day traders use 15-minute to 1-hour charts and watch for hours, swing traders use daily to weekly charts and check a couple of times a week, and position traders use weekly to monthly charts and can rely more on alerts and limit orders.
What defines support and resistance levels on a chart?
Support is where price has bounced more than once on real volume, often where former resistance flipped into support after being reclaimed. Resistance is where price has been rejected more than once on real volume, often where former support flipped into resistance after breaking down. These are drawn as zones where price has reacted multiple times, not single lines based on one wick.
Why is volume important when analyzing breakouts and trends?
Volume shows whether a move is real or borrowed. High-volume moves tend to continue, while low-volume moves tend to fail and snap back. A breakout above resistance needs volume behind it to be trusted, and shrinking volume while price makes new highs or lows signals a weakening trend or selling that is running thin.
Disclaimer
The information provided in this article is for informational purposes only. It is not intended to be, nor should it be construed as, financial advice. We do not make any warranties regarding the completeness, reliability, or accuracy of this information. All investments involve risk, and past performance does not guarantee future results. We recommend consulting a financial advisor before making any investment decisions.
More like this
Written by

Andrew Kamsky
Andrew Kamsky is a Bitcoin analyst. He spent a decade in traditional finance across a Big Four firm and a listed fintech bank before going deep on Bitcoin full-time.