


Quick summary
Bitcoin gold ratio expresses how many gold ounces one Bitcoin buys, currently about fifteen
O'Connor’s research sets a benchmark of one ounce yearly, twenty five ounces total
Studies show gold only weakly hedges inflation, working inconsistently and often failing savers
Counting gold ounces lets Bitcoin holdings map directly into years of purchasing power protection
Academic research suggests that accumulating one ounce of gold each year for 25 years broadly preserved purchasing power over long periods. For a Bitcoin holder, the natural next question is: how many coins equal 25 ounces? This article argues that the question is framed backwards. Rather than counting coins, it measures how many ounces of gold a Bitcoin position buys today and converts those ounces into years toward the historical benchmark. The benchmark stays fixed. Only the exchange rate between Bitcoin and gold changes.
Viewed through that lens, the Bitcoin Gold Ratio becomes more than a comparison between two assets. It becomes a measure of progress toward a historical purchasing-power benchmark. The framework builds on two earlier CoinJuice concepts: The Bitcoin Gold Floor, which establishes the Bitcoin equivalent of one ounce of gold, and Bitcoin as the Unit of Account, where Bitcoin becomes the measure against which other assets are priced.
What Is the Bitcoin Gold Ratio?
The Bitcoin gold ratio measures how many ounces of gold one Bitcoin buys at current prices. The calculation is the Bitcoin price divided by the gold price per ounce. At today's prices, $61,263 divided by roughly $4,000 to $4,090 per ounce gives a ratio near 15.0 ounces per BTC.
The ratio rises when Bitcoin outpaces gold and falls when gold outpaces Bitcoin. Most coverage treats the ratio as a relative strength gauge between the two assets. The piece below puts it to a different use: converting a Bitcoin position into years of historical inflation protection.
Full paper confirms everything I flagged, and now with the complete text in hand I can be precise. The corrected section, drop-in ready, scanned clean:
What Academic Research Says
O'Connor (2017), published in the Global Commodities Applied Research Digest, models a hypothetical US dollar based saver purchasing one ounce of gold annually over multiple horizons, using 217 years of price data starting in 1800.
Horizon | Ounces accumulated | Average terminal real value | Savers who matched or beat inflation |
25 years | 25 oz | 0.98 | 50% |
30 years | 30 oz | 0.95 | 40% |
40 years | 40 oz | 0.90 | 29% |
The averages sit near parity, but the paper itself warns against reading too much into the mean. A small number of extreme winners, savers who started around 1814 and doubled their purchasing power, drag the average upward. The more practical measure is the success rate, and even in the best case only half of 25 year savers matched or beat inflation.
O'Connor's own conclusion: gold as an inflation hedge has been roughly a 50:50 bet, and savers cannot rely on it to protect purchasing power. Worse, no 40 year saver whose horizon ended after 1980 beat inflation at all; the average outcome for those savers was a 58% loss of purchasing power.
The paper still supplies the benchmark used throughout the piece: one ounce per year is a reasonable, evenly paced savings pattern, and 25 ounces marks the horizon where the historical record looks strongest. What the paper does not supply is confidence in gold delivering against the benchmark. Gold set the pace; it hit the target about half the time.
The finding lines up with the broader literature. Hoang, Lahiani and Heller (2016), studying local gold prices across six major markets over periods spanning 1955 to 2015.
Does Gold Actually Hedge Inflation? What the Studies Show
The academic record on gold as an inflation hedge is weaker than its reputation suggests:
Cross-market evidence: Hoang, Lahiani and Heller (2016), studying local gold prices across six major markets over periods spanning 1955 to 2015, found gold offered short run inflation protection only in the United Kingdom, the United States, and India, and no long run hedging relationship in any market studied.
The Japan anomaly: In Japan the relationship ran negative, with rising consumer prices coinciding with falling gold prices.
The authors' own verdict: The paper points investors toward gold for diversification and safe haven value rather than inflation hedging.
Two papers, two entirely different methods, one shared verdict: gold's reputation as an inflation hedge outruns its historical record.
Converting Ounces Into Years
Because the O'Connor pace is one ounce per year, ounces owned read directly as years toward the 25 year benchmark.
The two numbers are the same: a hypothetical position worth 4 ounces of gold is 4 years toward the benchmark. Count the ounces, and the years count themselves.
A worked example July 2026: 1 BTC buys roughly 15 ounces of gold. A holder with 0.25 BTC therefore holds roughly 4 ounces, which is 4 years toward the benchmark. A holder with 0.1 BTC (10 million sats, about $6,126 today) holds roughly 1.5 years..
Bitcoin Priced in Gold: The Ratio From 2013 to 2026
The same holdings measured at year end 2020 tell an unexpected story. Bitcoin closed 2020 near $29,097 and gold near $1,894 per ounce, putting 1 BTC at roughly 15 ounces of gold, almost exactly today's reading. One ounce of gold cost about 0.0608 BTC at year-end 2020, and costs about 0.0665 BTC today (Jul 2, 2026) meaning gold has gotten slightly more expensive in BTC terms over that stretch.
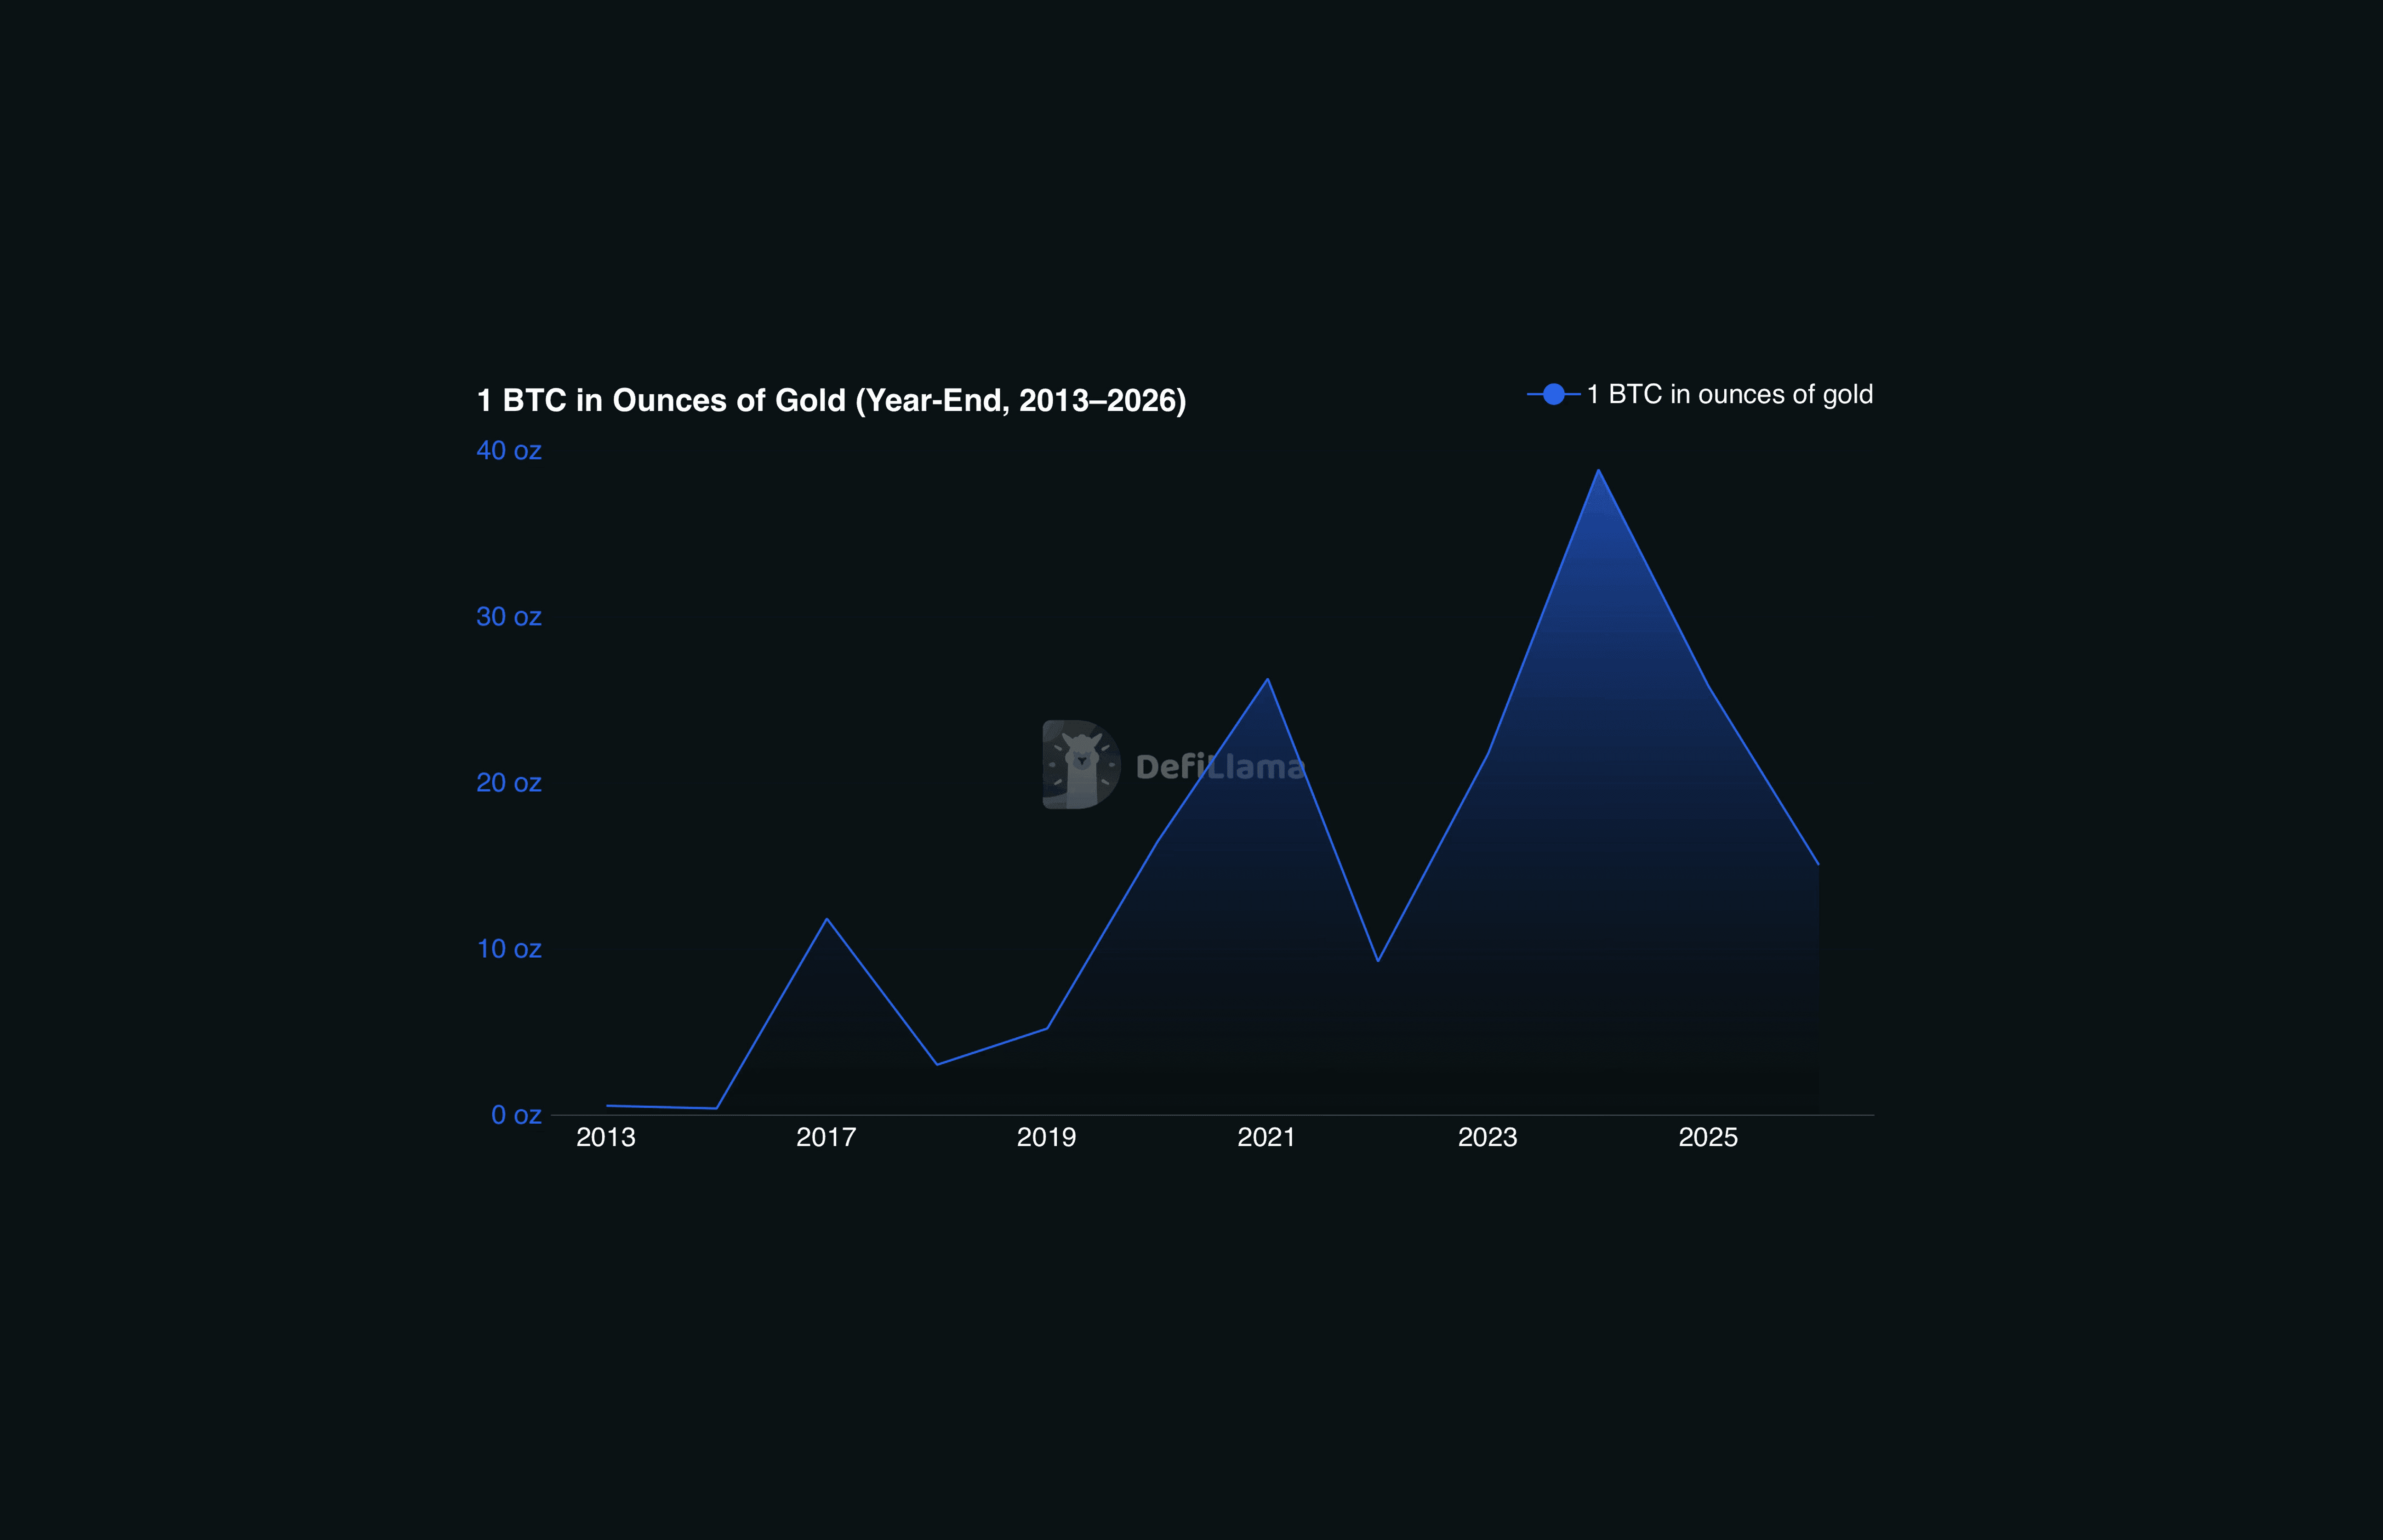
Two data points, however, cannot describe a cycle, and reading the pair above as six flat years would be the wrong conclusion. The ratio on July 2, 2026, sits in a drawdown, down from nearly 39 ounces at the end of 2024, not on a plateau.
The full year end record shows the actual shape:
Year end | BTC price (USD) | Gold price (USD/oz) | Ounces of gold per 1 BTC |
2013 | $755 | $1,411 | 0.5 oz |
2015 | $431 | $1,160 | 0.4 oz |
2017 | $14,840 | $1,257 | 11.8 oz |
2018 | $3,810 | $1,269 | 3.0 oz |
2019 | $7,223 | $1,393 | 5.2 oz |
2020 | $29,097 | $1,770 | 16.4 oz |
2021 | $47,205 | $1,799 | 26.3 oz |
2022 | $16,609 | $1,800 | 9.2 oz |
2023 | $42,196 | $1,941 | 21.7 oz |
2024 | $92,669 | $2,386 | 38.8 oz |
2025 | $88,427 | $3,432 | 25.8 oz |
Jul 2026 (today) | $61,263 | ~$4,075 | ~15.0 oz |
BTC prices via DeFiLlama. Gold year end figures via LBMA PM fix and external aggregators, unverified against a second source and treated as directional.
The record is cyclical, not flat: each peak so far has printed higher than the last, 11.8 ounces in 2017, 26.3 in 2021, 38.8 in 2024, and each drawdown has bottomed higher than the one before. Whether the pattern extends to a fifth cycle is a pattern in the data, not a guarantee.
What the table establishes without any forecast is the range: the same Bitcoin position has swung between representing 3 years and 39 years toward the benchmark inside a single decade.
Today a Bitcoin position buys a certain number of ounces of gold. Under O'Connor's framework, each ounce equals one year toward the historical purchasing power benchmark. If Bitcoin later buys more ounces, progress increases even though the Bitcoin balance never changed.
Why Bitcoin Changes the Equation
Gold offers one path to the 25 ounce goal. Bitcoin adds a second, and it runs in both directions:
The upside path: If Bitcoin grows faster than gold, the same coins buy more ounces over time. A holding at 4 ounces today could become 6 or 8 later, without spending another dollar.
The honest reverse: When Bitcoin falls against gold, as it has in recent weeks, the same holding buys fewer ounces and the years shrink with it. Counting ounces shows where a position stands and it promises nothing about where valuation goes.
What a holder controls: Timing. Buying when Bitcoin is cheap against gold picks up more ounces per dollar. Down markets, through the ounce lens, are when protection goes on sale.
Readers wanting to check a personal position against the one ounce per year pace can find the full framework in the Coinjuice ebook.
A subscription adds ongoing trade tips built on the same no leverage approach.
Conclusion
The research provides a practical benchmark: one ounce of gold accumulated each year over 25 years. Just ounces, at a steady pace. Gold gets there the slow way, one purchase at a time. Bitcoin might get there faster: if it keeps outgrowing gold, the coins already in a wallet buy more ounces each year without another purchase. The past few weeks showed the same road runs backwards too.
So the goal never moves: 25 ounces. The only question worth checking, today and any day after, is a simple one: how many ounces does the position buy right now?
A follow up piece runs the same measurement on the world's largest companies, corporate treasuries, and global assets.
FAQ
What is the Bitcoin gold ratio and how is it calculated?
The Bitcoin gold ratio measures how many ounces of gold one Bitcoin buys at current prices. It is calculated by dividing the Bitcoin price by the gold price per ounce. At a Bitcoin price of $61,263 and a gold price around $4,000–$4,090 per ounce, the ratio is near 15.0 ounces per BTC.
What benchmark does O'Connor’s research provide for preserving purchasing power with gold?
O'Connor’s research uses a saver who buys one ounce of gold per year as the benchmark. Twenty-five ounces, accumulated over 25 years at a pace of one ounce per year, marks the horizon where the historical record looks strongest for broadly preserving purchasing power.
How does the article convert a Bitcoin holding into ‘years of purchasing power’?
Because the benchmark pace is one ounce of gold per year, each ounce corresponds to one year toward the 25-year goal. A Bitcoin position is first converted into ounces of gold using the Bitcoin gold ratio, and those ounces directly read as years. For example, if 0.25 BTC buys about 4 ounces, that equals 4 years toward the benchmark.
What does the historical Bitcoin gold ratio from 2013 to 2026 show about volatility and cycles?
The historical record shows the ratio is cyclical, not flat. Peaks have risen over time—about 11.8 ounces in 2017, 26.3 in 2021, and 38.8 in 2024—and each drawdown has bottomed higher than the one before. Over roughly a decade, the same Bitcoin position has represented between about 3 and 39 years toward the 25-ounce benchmark.
Disclaimer
The information provided in this article is for informational purposes only. It is not intended to be, nor should it be construed as, financial advice. We do not make any warranties regarding the completeness, reliability, or accuracy of this information. All investments involve risk, and past performance does not guarantee future results. We recommend consulting a financial advisor before making any investment decisions.
Written by

Andrew Kamsky
Andrew Kamsky is a Bitcoin analyst. He spent a decade in traditional finance across a Big Four firm and a listed fintech bank before going deep on Bitcoin full-time.


