


Quick summary
Article audits equities, commodities, crypto, and living costs using Bitcoin as fixed denominator
From 2020–2026 only NVIDIA, Strategy, Tesla, DOGE, BNB, XRP, and ETH grew Bitcoin-denominated value
Most major stocks, commodities, and monetary networks lost hard money value despite dollar gains
Pricing life in satoshis reveals huge global cost-of-living differences under a single fixed ruler
What happens when every major asset is measured against Bitcoin's fixed 21 million supply instead of dollars?
This hard money audit compares equities, commodities, crypto assets, and global living costs using Bitcoin as the denominator. The results show which assets outperformed Bitcoin between 2020 and 2026 and which only appeared to grow because the dollar supply expanded.
Why Fiat-Based Valuation Distorts Growth
Every valuation tool in use today shares something in common.
The price-to-earnings ratios, market capitalisation, IRR on property, GDP growth are all denominated in a fiat currency that expands. Measuring performance against a shrinking baseline and calling it growth produces a distorted picture.
This price audit applies a different denominator: market cap divided by the BTC price at each snapshot date. The result, Bitcoin Weight, shows which assets preserved or expanded hard money purchasing power between 2020 and 2026, and which primarily absorbed dollar inflation.
Every other measuring stick gets longer over time.
Bitcoin's doesn't. There will only ever be 21 million. When the ruler is fixed, performance can be measured over time.
How Bitcoin-Denominated Valuation Works
The calculation is straightforward: take any market cap, divide by the BTC price at that date. The result is BTC weight, how many Bitcoin that asset was worth at that moment in time.
NVIDIA in 2020 was worth 22.9 million BTC. Apple in 2013 was worth 4.42 billion BTC, 210 times more Bitcoin than will ever exist. Bitcoin is the denominator because BTC is the only asset with both a hard cap and sufficient market consensus to function as a reliable unit of hard money measurement.
Gold, silver, equities, and fiat currency have supplies that grow or inflate. A hard cap alone is not sufficient, Litecoin has one, but lacks the consensus that makes Bitcoin a reliable ruler to measure value and performance over time.
Formula: Bitcoin Weight (sats) = any price or market cap in USD ÷ BTC price × 100,000,000
BTC Price Snapshots 2013 to 2026
Snapshot | BTC price | Bitcoin market cap |
Aug 2013 | $103 | ~$1.2B |
May 2020 | $9,000 | ~$166B |
May 2022 | $30,000 | ~$571B |
May 2024 | $65,000 | ~$1.27T |
May 23 2026 | $75,257 | ~$1.5T |
Every market cap in this article is divided by the BTC price at that date to produce its BTC weight. How many Bitcoin that asset was worth at that moment.
Rising BTC weight: the asset got more expensive in hard money terms
Falling BTC weight: the asset lost ground to the fixed supply denominator
Above 21,000,000: the asset is worth more than all Bitcoin that will ever exist
In May 2020 Strategy was worth 142,136 BTC. In May 2026: 764,162 BTC. More expensive in hard money terms because it converted its treasury into real Bitcoin.
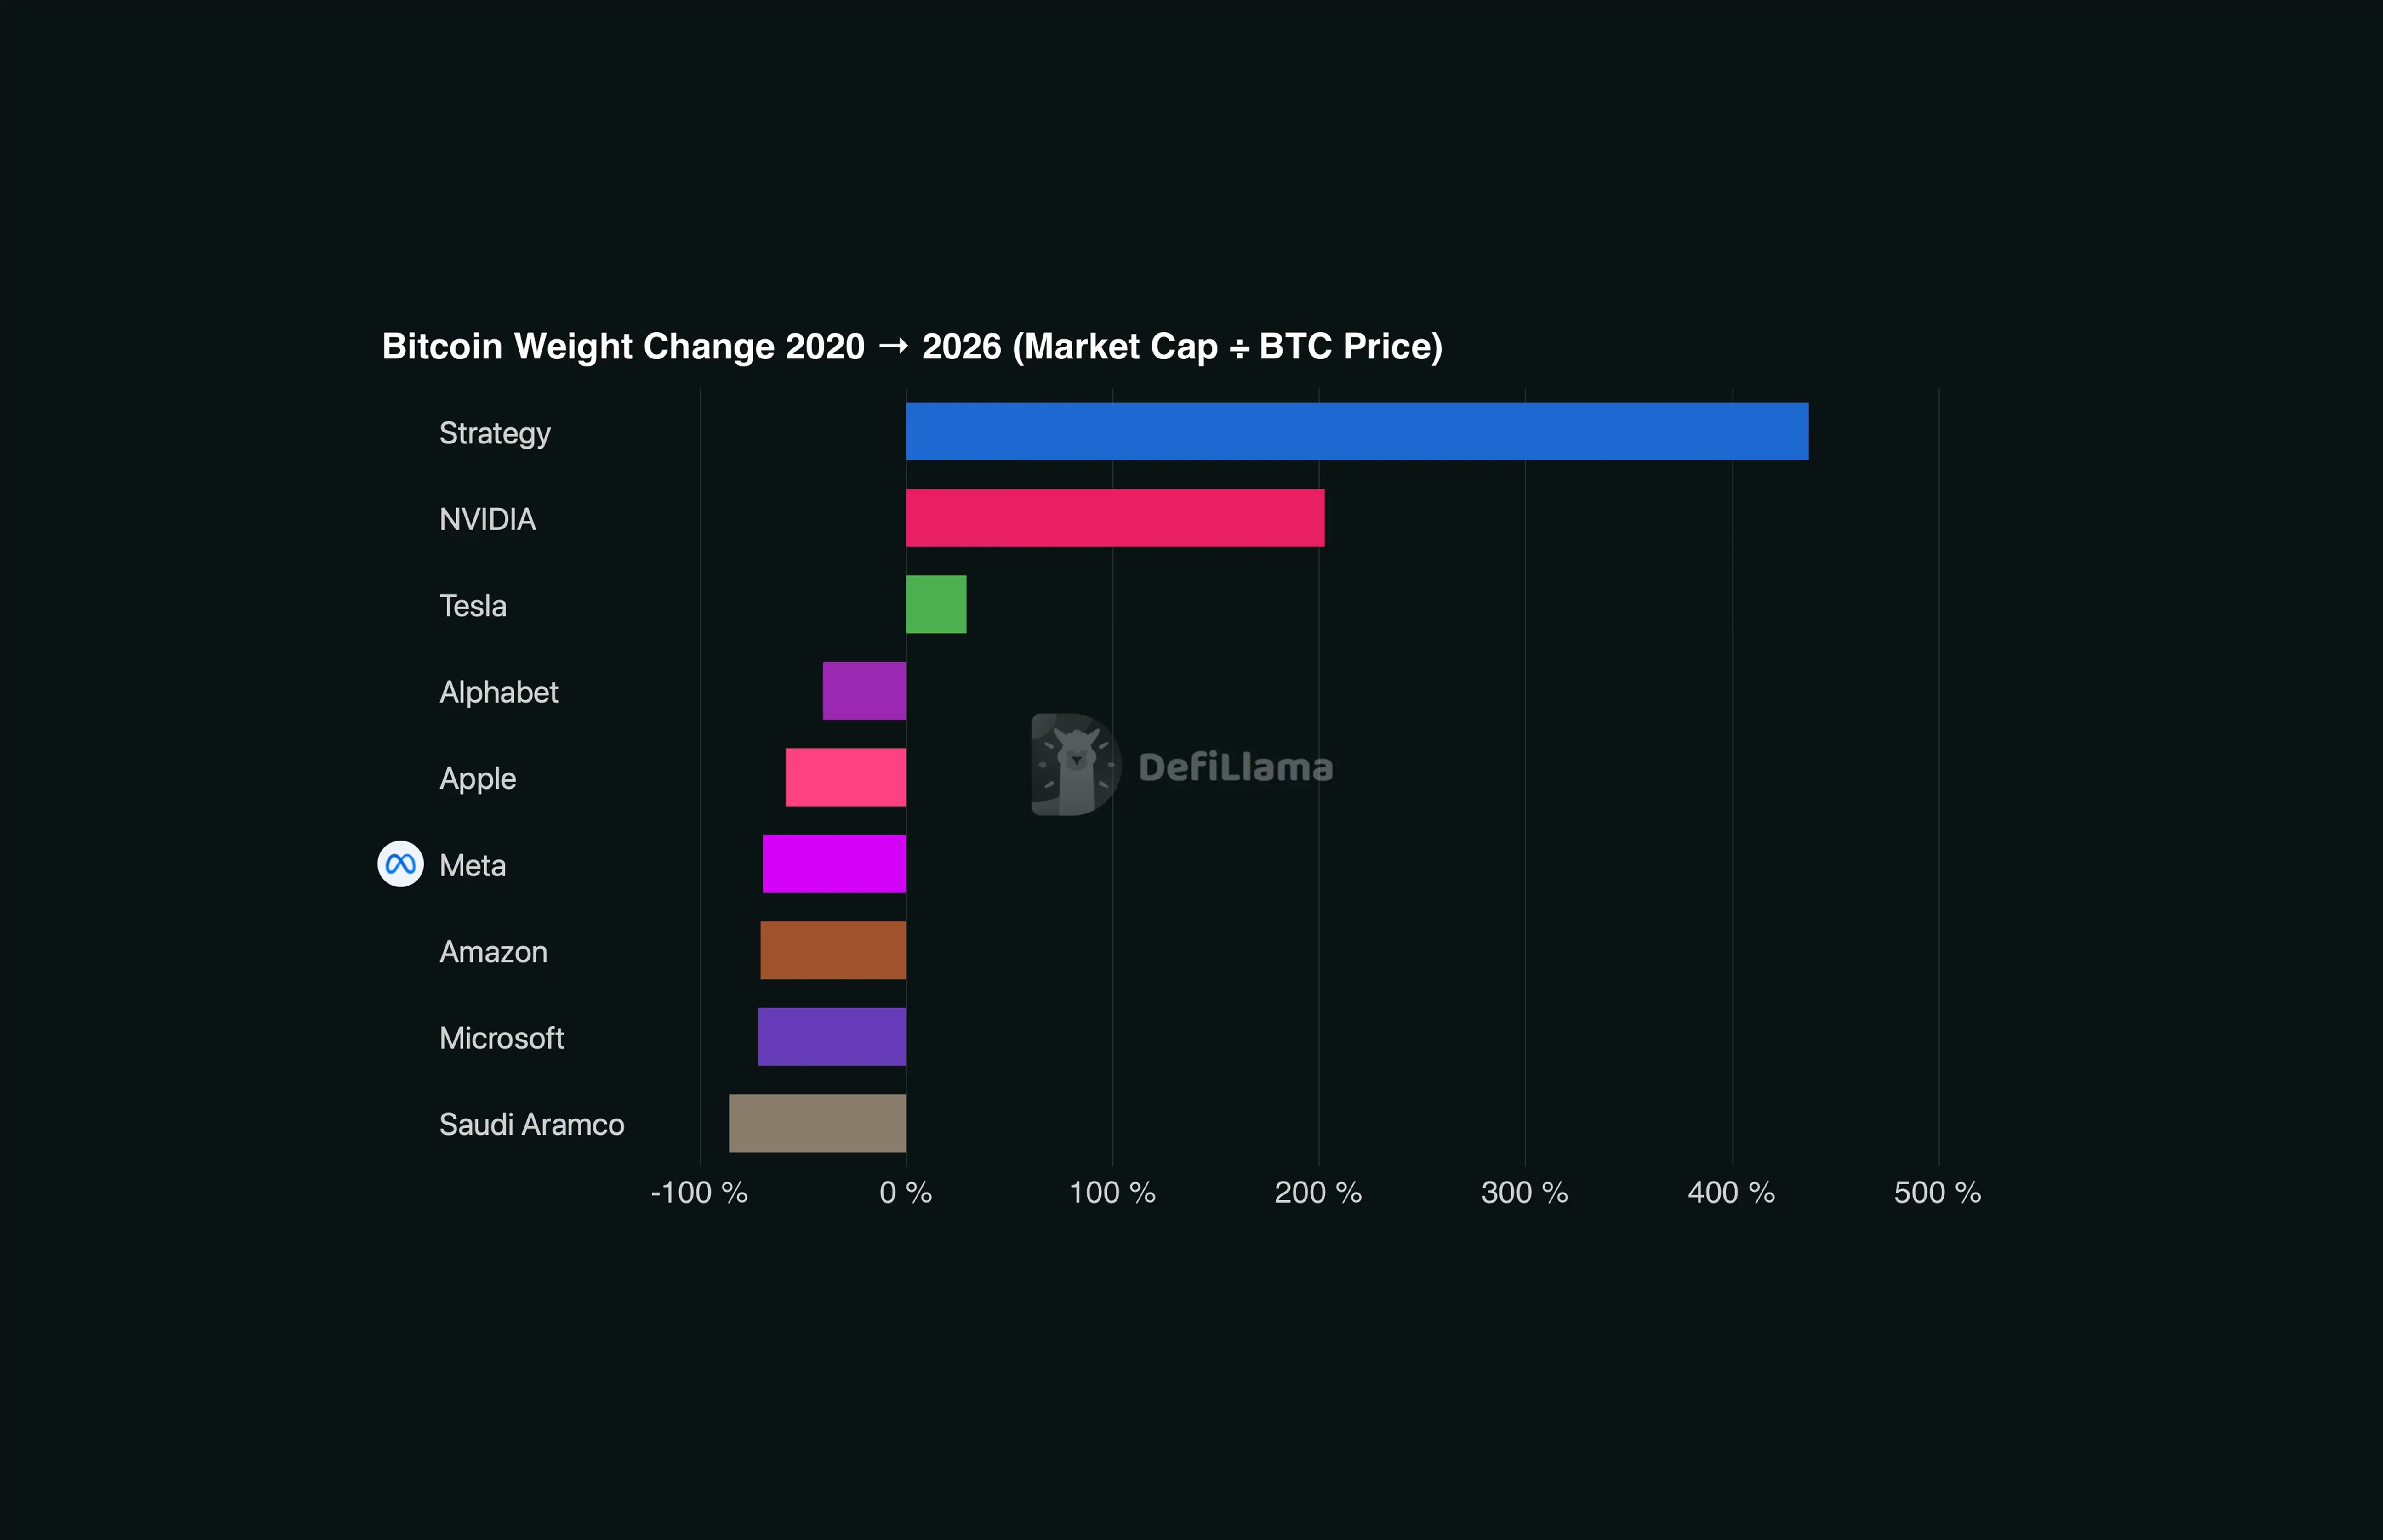
Which Stocks Outperformed Bitcoin Since 2020?
Company | May 2020 Mcap | May 2020 BTC | May 2022 Mcap | May 2022 BTC | May 2024 Mcap | May 2024 BTC | May 23 2026 Mcap | May 23 2026 BTC | Trend |
Strategy | $1.28B | 142,136 | $5.51B | 183,482 | $45.5B | 700,396 | $57.5B | 764,162 | +438% |
NVIDIA | $206B | 22.9M | $429B | 14.3M | $2.57T | 39.5M | $5.215T | 69.3M | +202% |
Apple | $1.30T | 144.1M | $2.30T | 76.6M | $2.86T | 44.0M | $4.535T | 60.3M | −58% |
Microsoft | $1.31T | 145.3M | $1.93T | 64.2M | $2.98T | 45.8M | $3.109T | 41.3M | −72% |
Alphabet | $921B | 102.4M | $1.49T | 49.8M | $2.03T | 31.2M | $4.596T | 61.1M | −40% |
Amazon | $1.16T | 128.4M | $1.15T | 38.4M | $1.81T | 27.8M | $2.864T | 38.1M | −70% |
Meta | $605B | 67.2M | $483B | 16.1M | $1.15T | 17.7M | $1.549T | 20.6M | −69% |
Tesla | $148B | 16.4M | $756B | 25.2M | $548B | 8.4M | $1.599T | 21.3M | +30% |
Saudi Aramco | $1.51T | 167.6M | $2.25T | 75.0M | $1.72T | 26.5M | $1.798T | 23.9M | −86% |
NVIDIA and Strategy gained BTC weight. Every other company in the table lost it.
NVIDIA's dollar market cap rose 25× on genuine demand from AI infrastructure, a once-in-a-generation revenue shock that outpaced the fixed denominator. Strategy did not outgrow Bitcoin. It accumulated it directly, converting its balance sheet before the market understood what was happening.
The remaining seven companies — Apple, Microsoft, Alphabet, Amazon, Meta, Tesla, Saudi Aramco — grew in dollar terms and shrank in hard money terms. Some shrank more than gold at 70%. Saudi Aramco lost 86%. Microsoft and Amazon lost roughly 70%, the same rate as gold.
Dollar growth and hard money growth are not the same thing. Between 2020 and 2026, the gap between them was material.
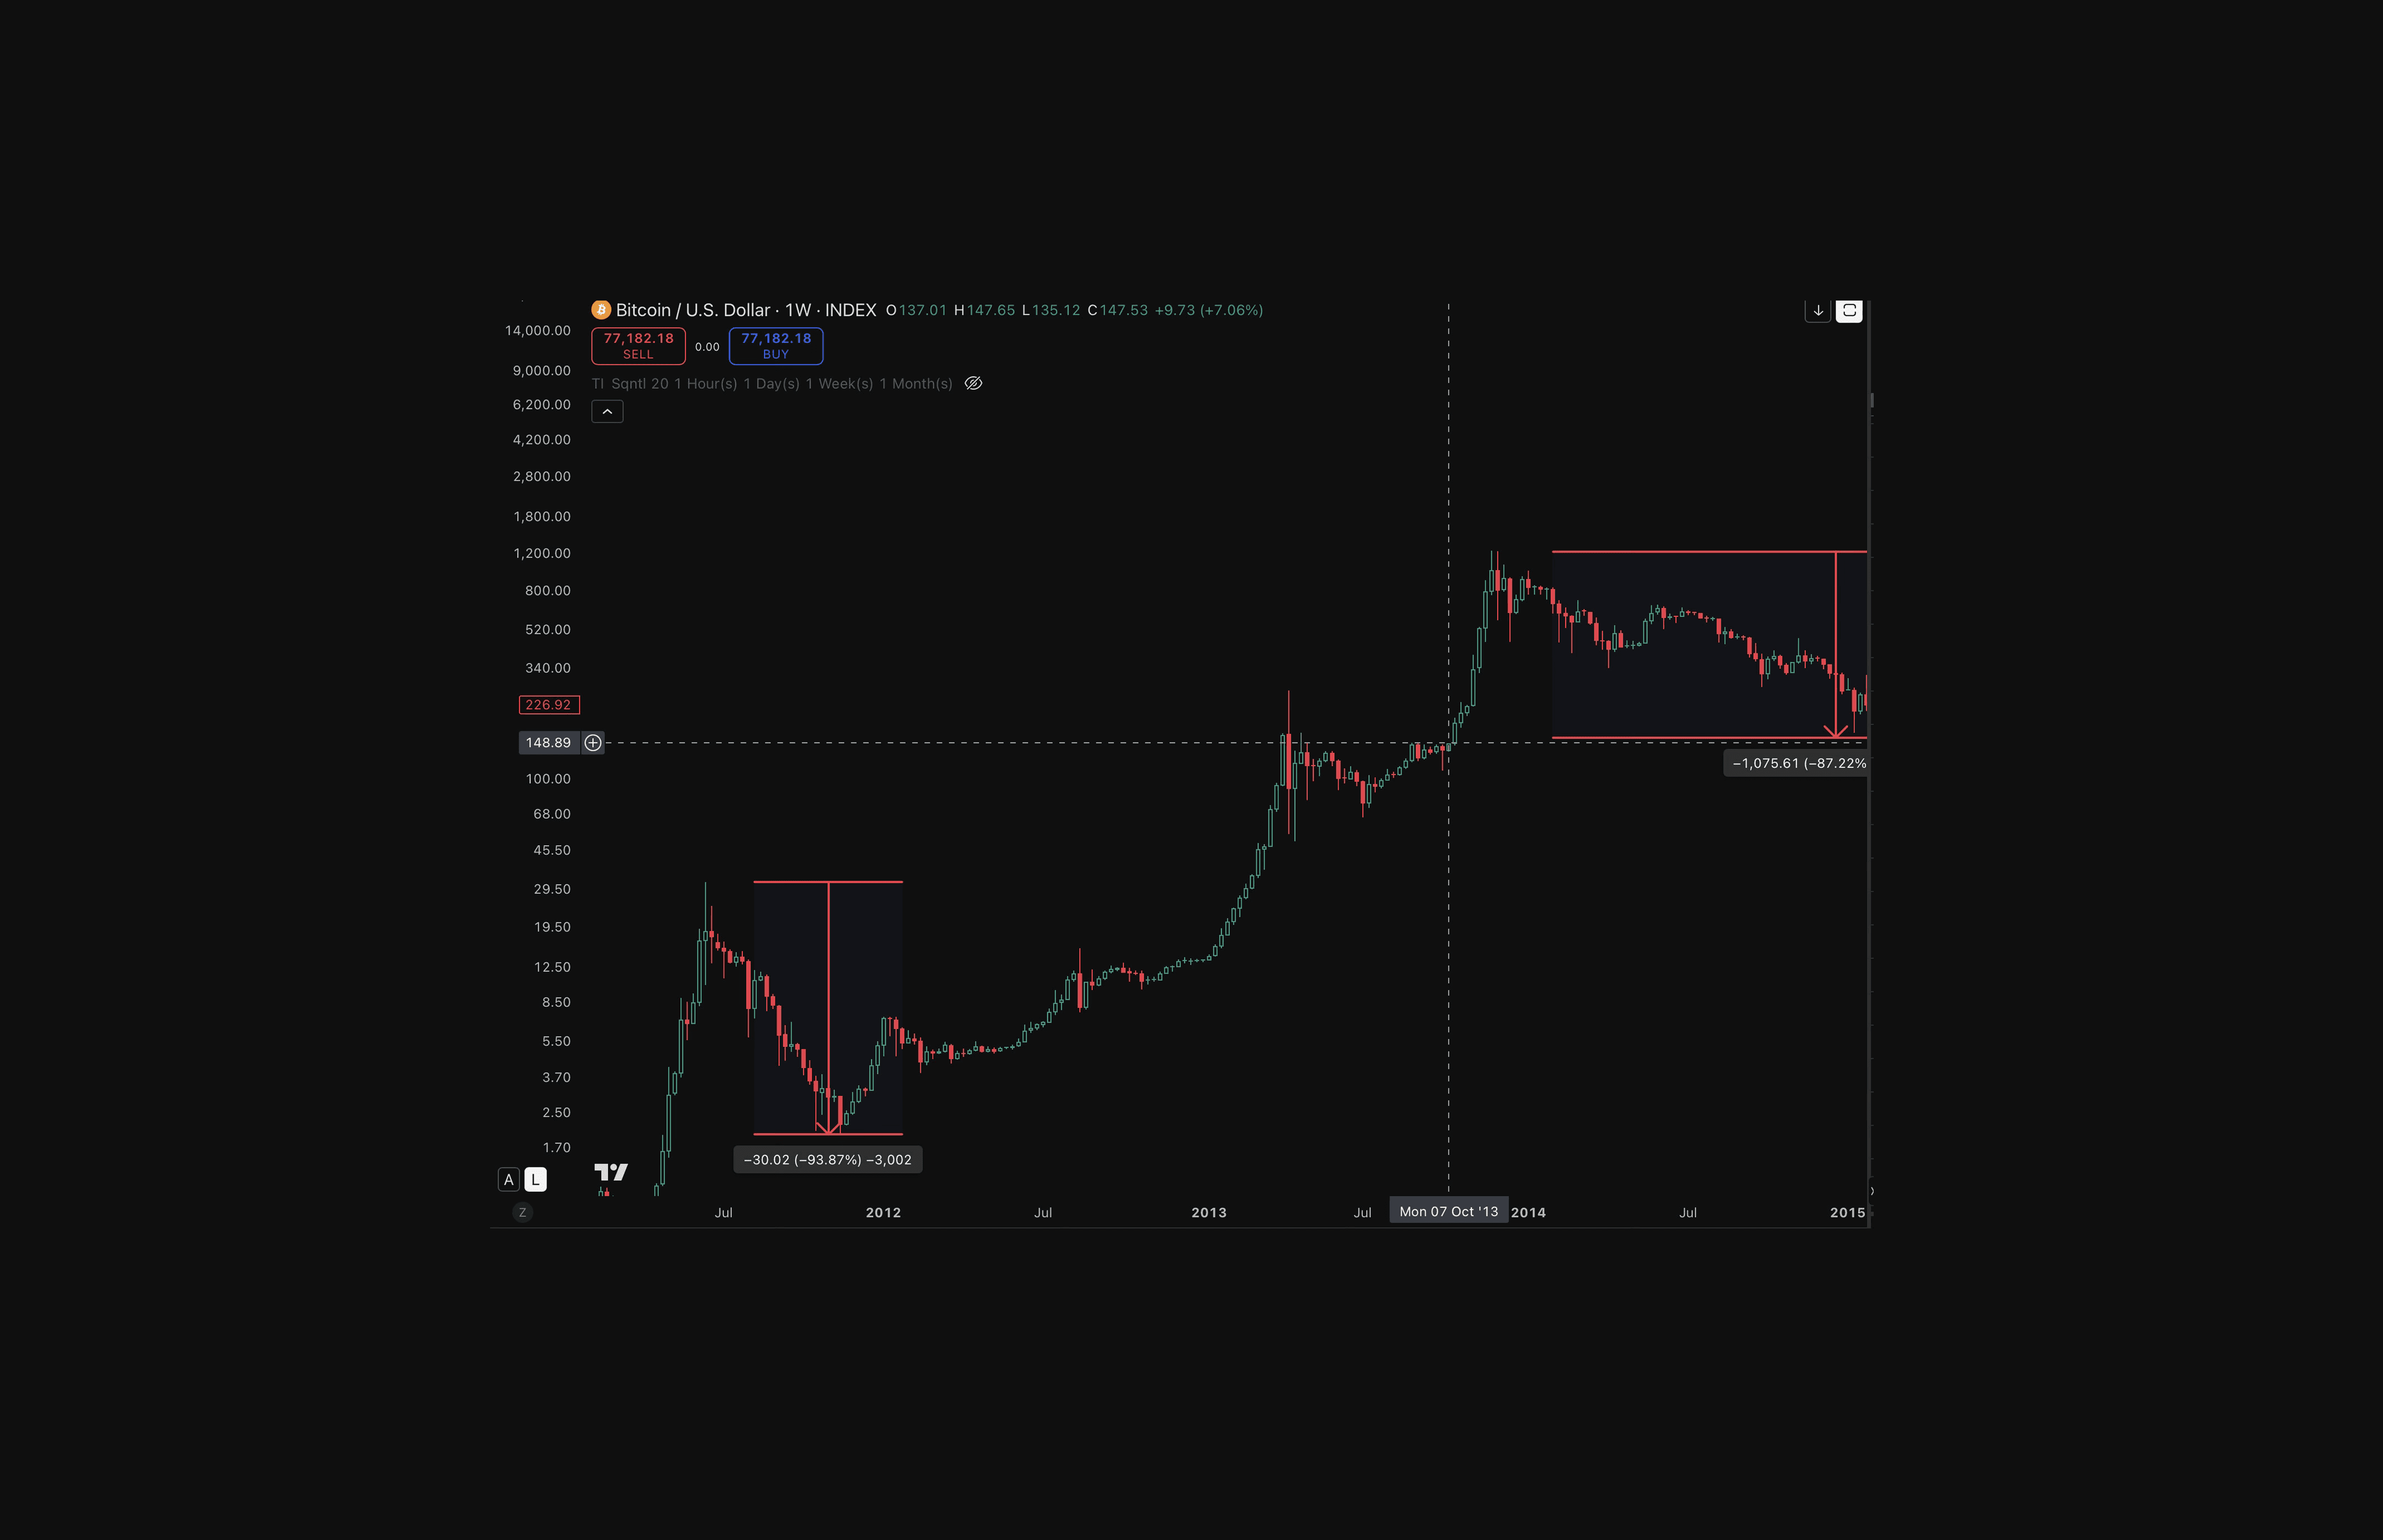
What $103 Bitcoin Reveals About Global Valuations
In August 2013 Bitcoin traded near $103. Three months later, after a rapid speculative expansion pushed BTC toward $600–$700, Michael Saylor publicly compared Bitcoin to online gambling in his famous tweet.
Company | Aug 2013 | May 23 2026 | Hard money change |
Gold | 69.9 billion BTC | 416.8M BTC | −99.4% |
Apple | 4.42 billion BTC | 60.3M BTC | −98.6% |
Microsoft | 2.70 billion BTC | 41.3M BTC | −98.5% |
Alphabet | 2.48 billion BTC | 61.1M BTC | −97.5% |
Amazon | 1.23 billion BTC | 38.1M BTC | −96.9% |
Strategy | 10.6M BTC | 764,162 BTC | −92.8% |
Every company in the table shrank in hard money terms since 2013. Gold's dollar market cap went from $7.2 trillion to $31 trillion — four times larger — while its BTC weight collapsed 99.4%. Apple in 2013 represented 4.42 billion BTC and on May 23, 2026: 60.3 million BTC. Still 2.87 times total supply, but a fraction of what it was.
Strategy shrank too, from 10.6 million BTC weight, in 2013, to 764,162 BTC. Strategy converted its shrinking Bitcoin-denominated valuation into actual Bitcoin. It now holds 818,871 BTC on its balance sheet, more than its entire BTC weight market cap.
Strategy Is Now Trading Below Its Bitcoin Holdings
Strategy began accumulating Bitcoin in August 2020. The market priced that conviction at a significant premium to the underlying Bitcoin held peaking at +227% in May 2024. By May 2026 that premium had inverted. Strategy's market cap in May 2026, sits below the value of the Bitcoin it directly holds.
Date | Market cap in BTC | BTC held | Premium / discount |
May 2022 | 183,482 BTC | 129,218 BTC | +42% premium |
May 2024 | 700,396 BTC | 214,400 BTC | +227% premium |
May 23 2026 | 764,162 BTC | 818,871 BTC | −6.7% discount |
Commodities Versus Bitcoin Since 2020
Commodity | May 2020 | May 23 2026 | Hard money change |
Gold (oz) | 0.197 BTC | 0.060 BTC | −70% |
Silver (oz) | 0.00167 BTC | 0.00101 BTC | −40% |
Platinum (oz) | 0.083 BTC | 0.0257 BTC | −69% |
Corn (bushel) | 0.000356 BTC | 0.000047 BTC | −87% |
Rubber (kg) | 0.000156 BTC | 0.000018 BTC | −88% |
Gold hit $5,400 an ounce in March 2026 before pulling back to $4,510 by May 23. In dollar terms, an all-time high. In Bitcoin terms, down 70% since 2020.
Silver at $75 per ounce carries a market cap of $4.273 trillion, larger than Bitcoin's $1.507 trillion. Silver has lost 40% in hard money terms since 2020, outperforming gold on this measure, but still losing ground to the fixed denominator every cycle.
Corn lost 87%. Rubber lost 88%. Agricultural commodities rose in dollar terms while losing substantial ground against Bitcoin.
Which Crypto Assets Beat Bitcoin Since 2020?
Three assets passed. A memecoin with staying power. A payments network freed by a court ruling. An exchange token backed by the world's largest crypto platform.
Asset | 2020 BTC weight | 2026 BTC weight | Change | Result |
DOGE | 35,659 | 204,137 | +472% | Pass |
XRP | 1,029,653 | 1,088,180 | +6% | Pass |
BNB | 278,513 | 1,146,688 | +312% | Pass |
ETH | 2,606,583 | 3,258,593 | +25% | Partial |
ADA | 188,069 | 117,393 | −38% | Fail |
Dogecoin has no strict hard cap but its inflation rate shrinks over time as the fixed 10,000 DOGE per block reward becomes a smaller percentage of the growing supply. Dogecoin is inflationary but decreasingly so.
Cardano launched in October 2017 worth 123,619 BTC weight. In May 2026 it was worth 121,032 BTC. Nine years of development, four hard forks, and hundreds of research papers later the network commands essentially the same amount of hard money as the day the protocol began.
ETH grew 25% in BTC Weight terms since 2020. It is listed as partial because ETH functions closer to infrastructure fuel than a monetary asset, the gas that runs a global settlement layer. Measuring it against a hard money benchmark may be the wrong frame.
Bitcoin as a Global Unit of Account: The Satoshi Price of Everything
The calculation works at every scale. Take any price, divide by the BTC price at that moment, then multiply by 100,000,000. The result is the satoshi cost of anything, anywhere, at any point in time.
Priced in the same unit across every city and currency, the tables below become something no fiat metric can offer: a precise comparison of the real cost of living anywhere in the world. A New York lifestyle costs 7.7 million satoshis per month. Tbilisi costs 598,003. That gap is a financial decision worth hundreds of thousands of dollars over a decade.
Where you choose to live is now one of the most financially precise decisions you can make.
Cost of living — 11 Locations — Snapshot Taken May 23 2026
At $75,257 per BTC:
One million satoshis is worth: $752
Two and a half million satoshis: $1,881
Urban
City | Monthly groceries | Coffee | 3-bed rent | Monthly total | Sat cost (monthly) |
New York, USA | $600 | $7 | $4,500 | $5,800 | 7,706,227 |
London, UK | $660 | $5.72 | $4,064 | $5,207 | 6,920,863 |
Zurich, Switzerland | $814 | $6.78 | $4,746 | $6,107 | 8,114,860 |
Lagos, Nigeria | $90 | $1.50 | $400 | $520 | 691,057 |
Tokyo, Japan | $380 | $4 | $1,400 | $1,900 | 2,524,752 |
Rural / Lower Cost
Location | Monthly groceries | Coffee | 3-bed rent | Monthly total | Sat cost (monthly) |
Udaipur, India | $59 | $0.54 | $194 | $275 | 365,633 |
Chiang Mai, Thailand | $120 | $1.50 | $350 | $520 | 691,057 |
Rural Malta | $400 | $1.94 | $972 | $1,512 | 2,009,396 |
Backpacker
Location | Monthly groceries | Coffee | Hostel dorm | Monthly total | Sat cost (monthly) |
Hawaii, USA | $300 | $6 | $1,800 | $2,200 | 2,924,950 |
Pai, Thailand | $80 | $1 | $250 | $380 | 505,009 |
Tbilisi, Georgia | $100 | $1.50 | $300 | $450 | 598,003 |
Coffee and 3-bed apartment: Satoshi cost across locations
Location | Coffee (sats) | 3-bed rent (sats) |
New York | 9,302 | 5,981,308 |
London | 7,601 | 5,402,654 |
Zurich | 9,009 | 6,307,819 |
Tokyo | 5,316 | 1,860,574 |
Lagos | 1,993 | 531,592 |
Udaipur | 718 | 257,924 |
Chiang Mai | 1,993 | 465,191 |
Rural Malta | 2,579 | 1,292,299 |
Hawaii | 7,970 | 2,392,892 |
Pai, Thailand | 1,329 | 332,181 |
Tbilisi, Georgia | 1,993 | 398,617 |
A coffee in Zurich costs 9,009 sats. The same coffee in Udaipur costs 718 sats. Same Bitcoin. Same ruler. 13× difference depending on where you sit when you drink it.
Prices have risen almost everywhere since 2020. The fixed denominator at 21 million does not adjust or smooth. It simply measures. What 21 million reveals is that the same Bitcoin buys more life in some parts of the world than others.
Conclusion
A hard money audit has been run across equities, commodities and crypto. The fixed supply denominator was applied throughout and the results were consistent.
NVIDIA proved that a once-in-a-generation demand shock can outrun the denominator. Strategy proved that accumulating the denominator itself works. Dogecoin demonstrated that cultural network effects can persist longer than many investors expected. Almost nothing else passed.
Every major equity, commodity, and alternative monetary network lost Bitcoin-denominated value since 2020. In several cases by more than gold. Dollar market caps grew. Hard money value compressed. Both things happened simultaneously and the dollar made only one of them visible.
The dollar measured nominal growth. Bitcoin measured relative scarcity. Between the two, the divergence was material. This framework measures what happened. It does not predict what comes next.
Strategy proved that accumulating the denominator itself works. If you want a framework for accumulating without leverage, the Coinjuice trading ebook covers that.
Data sourced from DeFiLlama, Valyu, SEC filings, BitcoinTreasuries.net, and CoinMarketCap. All figures represent approximate values at snapshot dates. May 23 2026. NFA. DYOR.
FAQ
What does it mean to price assets in Bitcoin and what is BTC weight?
Pricing assets in Bitcoin means dividing an asset’s market cap by the Bitcoin price at a given date. The result, called BTC weight, is how many Bitcoin that asset was worth at that moment in time. Rising BTC weight means the asset became more expensive in hard money terms; falling BTC weight means it lost ground against Bitcoin’s fixed supply.
Why is Bitcoin used as the denominator instead of fiat currencies or other assets?
Bitcoin is used as the denominator because it has a hard cap of 21 million coins and sufficient market consensus to function as a reliable unit of hard money measurement. Fiat currencies, gold, silver, equities, and other assets have supplies that grow or inflate, and even hard-capped assets like Litecoin lack the consensus that makes Bitcoin a consistent ruler over time.
Which major stocks and commodities outperformed or underperformed Bitcoin between 2020 and 2026?
Between 2020 and 2026, NVIDIA and Strategy gained BTC weight, meaning they outperformed Bitcoin in hard money terms. All other listed companies, including Apple, Microsoft, Alphabet, Amazon, Meta, Tesla, and Saudi Aramco, lost BTC weight even as their dollar market caps grew. All five tracked commodities—gold, silver, platinum, corn, and rubber—also lost ground to Bitcoin, with corn down 87%, rubber down 88%, gold down 70%, and silver down 40% in Bitcoin terms.
How does using Bitcoin and satoshis reveal global cost-of-living differences?
By expressing any price as satoshis—price divided by BTC price, then multiplied by 100,000,000—costs can be compared directly across countries without currency conversion. For example, a month in New York costs 7.7 million satoshis while Tbilisi costs 598,003 satoshis, and Zurich costs 8.1 million. The same Bitcoin buys more or less “life” depending on location, making where you live a financially precise decision.
Disclaimer
The information provided in this article is for informational purposes only. It is not intended to be, nor should it be construed as, financial advice. We do not make any warranties regarding the completeness, reliability, or accuracy of this information. All investments involve risk, and past performance does not guarantee future results. We recommend consulting a financial advisor before making any investment decisions.
Written by

Andrew Kamsky
Andrew Kamsky is a Bitcoin analyst. He spent a decade in traditional finance across a Big Four firm and a listed fintech bank before going deep on Bitcoin full-time.


