






Quick summary
Bitcoin hovers near $81,488 , well below all‑time high, while market volatility rises
Altcoins, especially DeFi tokens, drop more sharply as Bitcoin dominance reaches about sixty percent
Derivatives show higher volume but falling open interest, suggesting leveraged positions were closed, not opened
U.S. spot Bitcoin ETFs see 635.6 million dollar daily net outflow, led by IBIT redemptions
Bitcoin trades at $81,488 at about 05:00 UTC on October 23, 2026, 35% below its $126,156 all-time high and 0.20% above the October 22 close. That close, at $81,322, marked a 3.24% drop from October 21 and reversed the push toward $85K recorded in the October 22 Read on the two-fund bid and the $85K cap. BTC’s share of the crypto market rose to its highest level since May, while spot ETFs posted the first net outflow since October 16.
Bitcoin Dominance: BTC Fell Less as DeFi Tokens Led the Slide
CoinDesk tied the October 22 selloff to mixed earnings from Tesla and Meta, and crypto sorted itself by risk:
The trigger: Tesla cut its capital spending outlook while Meta raised its spending guidance, reviving doubts over AI spending, per CoinDesk. Nasdaq 100 futures fell 1.32% and BTC lost as much as 2.9% from midnight UTC, its largest slide in two weeks. The U.S. session closed with the Nasdaq down 2.6% and the S&P 500 down 1.2%, its worst day since July, per Reuters and AP.

The pattern: The move revisits the question of whether Bitcoin trades as an AI hedge or a liquidity trade. AI relief lifted BTC on October 21, and AI doubt pulled it back a day later.
Altcoins fell harder: The CoinDesk 80 index dropped 3.2% against 2.5% for the CoinDesk 5. DeFi led the decline, with the sector index down 5.6%, Curve down 8.2% and Ethena down 7.2%. Monero, up 4.9%, was a rare gainer, per CoinDesk.
Share rose as prices fell: Bitcoin’s share of the total crypto market reached 60% on October 21 and held near that level, its highest since May, per a TradingView chart cited by CoinDesk, and ETH/BTC slipped 0.58% to 0.02934.
Positions closed, not opened: Derivatives volume jumped 19% to $226.6B while open interest fell 2.46% to $141.8B, per CoinDesk, and liquidations rose 52% to $431.1M. Higher volume alongside lower open interest points to traders stepping back from leverage rather than building new bets.
Asia set the tone: China’s CSI 300 fell 2%, taking it 20% below its June peak and into bear market territory. Japan’s Nikkei and Hong Kong’s Hang Seng each fell about 3%, and South Korea’s Kospi 3.5%. Brent crude climbed above $112, its highest since May, and the VIX rose 10% to around 18, per CoinDesk.
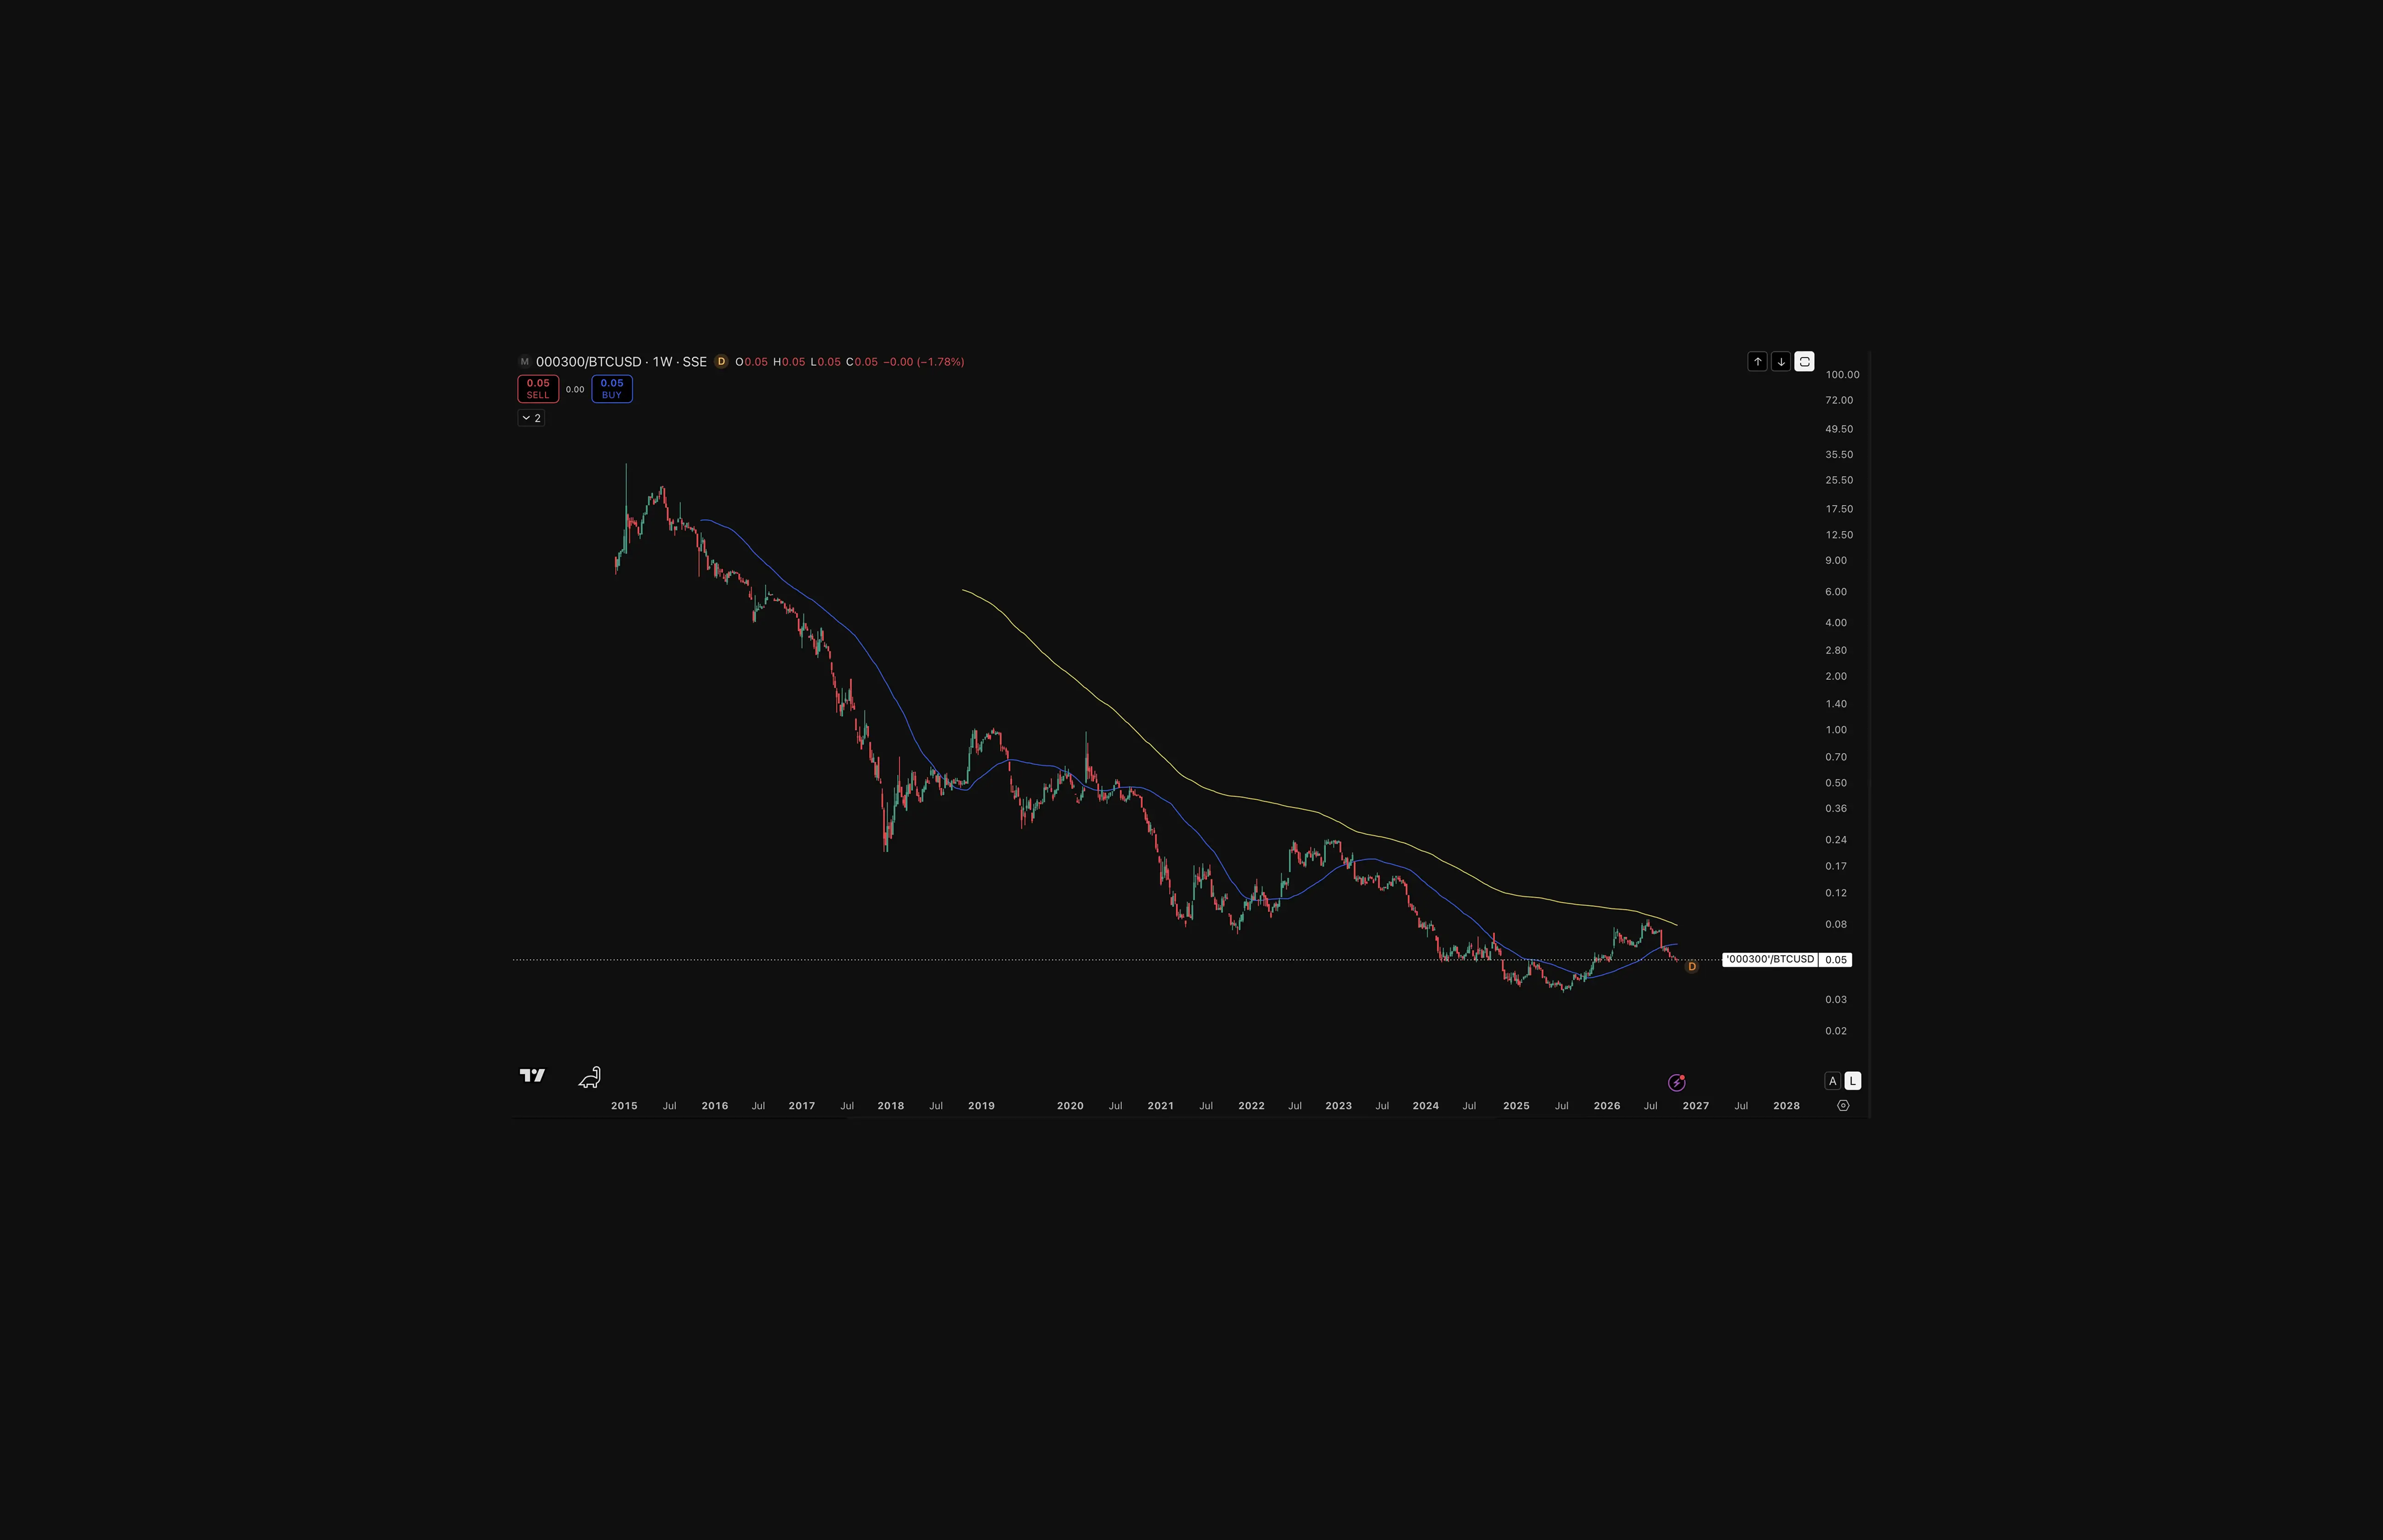
Interpretation: The U.S. 10-year Treasury yield eased to about 5.08% in the same session, per CoinDesk, yet BTC fell with technology shares. On October 22, Bitcoin traded as a risk asset tied to equities rather than a beneficiary of lower yields. Inside crypto, capital moved toward the largest and most liquid asset instead of leaving altogether.
ETF Flows: IBIT Led a $635.6M Exit
U.S. spot Bitcoin ETFs recorded a net outflow on October 22, ending a three-session run of inflows:
ETF | 24h Flow (Oct 22) | 7D Flow (Oct 16 to 22) |
IBIT | −$254.1M | +$604.2M |
FBTC | −$217.5M | −$95.4M |
ARKB | −$109.4M | −$99.6M |
GBTC | −$29.5M | −$51.8M |
Four-fund total | −$610.5M | +$357.4M |
All 12 funds | −$635.6M | +$356.7M |
Source: DefiLlama ETF flow data, latest reported flow day October 22, 2026. The 7D window covers the five trading sessions from October 16 to 22.
The week still leans on IBIT: Even after October 22, IBIT holds +$604.2M across the five sessions, more than the +$356.7M all-fund total, while FBTC, ARKB and GBTC sit negative over the same window.
October turns negative again: The month stood at +$460.0M through October 21. Adding October 22 leaves it at −$175.6M on DefiLlama’s all-fund totals, a Coinjuice calculation.
The pace problem: A CoinDesk analysis finds the funds averaged about $235M a day in net inflows across Bitcoin’s three steep uptrends since January 2024, against roughly $86M a day since July 1. The five sessions to October 22 averaged about $71.3M each on DefiLlama’s totals, a Coinjuice calculation, which sits below even the slower pace.
Bitcoin lost ground but gained market share as ETF buyers stepped back. Crypto traders rotated toward BTC, while the largest fund led the outside selling on October 22.
Technicals: BTC Loses Its 20-Day and 50-Day Averages
Metric (1D) | Reading | Interpretation |
EMA 200 (exponential) | About $76,311, rising; price about 6.8% above | Daily trend intact |
Bollinger position (%B) | 32.3% of band range | Lower third of the band |
Bollinger bandwidth | Below its 60-day median | Squeeze: volatility compressed |
MACD histogram | −$203.39, weakening | Momentum below zero and fading |
MACD divergence | Possible bearish, one-day view | Early, not confirmed |
Source: DefiLlama data, including the live October 23 bar at about 05:00 UTC. EMA and MACD values depend on seeding and indicator settings, so other platforms will show slightly different figures.
Simple Moving Averages Across Timeframes
Timeframe | MA 20 | MA 50 | MA 200 | Price vs MA 20 / MA 50 / MA 200 |
1D | $83,032 | $81,790 | $72,799 | −1.99% / −0.50% / +11.79% |
3D | $81,090 | $71,421 | +0.36% / +13.95% / | |
1W | $71,539 | $76,557 | +13.76% / +6.30% / |
Source: Simple averages calculated on CryptoQuant daily closes (all exchanges, BTC/$spot) through October 22, 2026, against CryptoQuant’s October 22 close of $81,383, with thanks to CryptoQuant for the data. For technical analysis from a wide array of analysts be sure to check out CryptoQuant Quicktake community.
The 3D average is holding, narrowly: Price sits 0.36% above the 3D 20-period average, the nearest support among the listed averages.
Weekly gap still open: The 20-week average remains below the 50-week, a gap the weekly trend has yet to close.
Coinjuice Lens: Market Structure
Across the October 19 to 22 editions, the sequence ran from macro relief to ETF buying to a leveraged push toward $85K. On October 22, renewed AI spending doubts broke the first link, per CoinDesk’s reading, leveraged traders closed positions and ETF buyers stepped aside, led by IBIT. Bitcoin lost ground but gained market share as ETF buyers stepped back.
The network hashrate reached roughly 1,050 EH/s on October 21, about 45% above its July low near 726 EH/s but still below its October 2025 peak of about 1,305 EH/s, per CryptoQuant data reported by Cointelegraph. CryptoQuant CEO Ki Young Ju described the climb as an indirect bullish sign of institutional backing for public miners, a stated view rather than a measured flow. Readers watching the $80K line and the 3D average can apply the steps in Coinjuice’s beginner’s framework for reading charts. The next tests are the U.S. Flash PMI at 13:45 UTC on October 23 and the Fed meeting on October 27 and 28.
Readers looking to prepare for a test of the $80K line can start with the Coinjuice ebook, Bitcoin Trading Without Leverage, now 15% off with the code TRADE15OFF, or go deeper with a Coinjuice subscription, currently 30% off the annual plan, where we start and complete trades and you will learn to snipe them independently.
Something new is about to land: the Coinjuice merchandise store is kicking off very soon, and we are excited to share it with you. Best sign up and we will send you discounts that only our pre-members will gain for our merch!
News Behind Today’s Read
DeFi tokens lead crypto lower as bitcoin (BTC) price gives up Wednesday’s surge (CoinDesk). Source for BTC’s 2.9% intraday drop, the CoinDesk 80 and DeFi index moves, the Curve, Ethena and Monero figures, and the derivatives volume, open interest and liquidation data.
Asian market selloff deepens as oil rises. Bitcoin (BTC) price slips to $82,000 (CoinDesk). Source for the CSI 300 bear market, the Nikkei, Hang Seng and Kospi declines, the Tesla and Meta spending guidance, and the Brent, VIX and Treasury yield levels.
Crypto traders seek shelter in bitcoin as altcoins slide and ETF flows wobble (CoinDesk). Source for Bitcoin’s 60% market share, its highest since May, and analyst views on volatile ETF flows.
CryptoQuant CEO Calls Rising Bitcoin Hashrate ‘Indirect Bullish Signal’ from Institutions (Cointelegraph). Source for the 1,050 EH/s hashrate, the July low, the October 2025 peak and Ki Young Ju’s interpretation.
Continue the read: Oct. 22 · Oct. 21 · Oct. 20 · Oct. 19
Market Snapshot
Asset | Price | Distance from ATH / reference |
BTC | $81,488 | 35% below ATH ($126,156) |
ETH | $2,391 | 51% below ATH ($4,946) |
ETH/BTC | 0.02934 | Spot ratio, DefiLlama |
DeFi TVL | $90.57B | Base TVL, DefiLlama |
BTC share of five-asset basket | 75.43% | BTC/ETH/SOL/BNB/XRP; narrow proxy, not market-wide dominance |
Prices as of about 05:00 UTC, October 23, 2026. ETF flows from DefiLlama; moving averages from CryptoQuant; market-wide dominance and derivatives figures as reported by CoinDesk and not independently verified.
This article was developed with the support of artificial intelligence tools as part of Coinjuice’s editorial process and reviewed by our editorial team before publication.
Disclaimer
The information provided in this article is for informational purposes only. It is not intended to be, nor should it be construed as, financial advice. We do not make any warranties regarding the completeness, reliability, or accuracy of this information. All investments involve risk, and past performance does not guarantee future results. We recommend consulting a financial advisor before making any investment decisions.
FAQ
Why did Bitcoin fall on October 22, 2026?
BTC lost as much as 2.9% from midnight UTC, its largest slide in two weeks, after mixed earnings from Tesla and Meta revived doubts over AI spending, per CoinDesk. The Nasdaq closed down 2.6% and the S&P 500 down 1.2%, its worst day since July, per Reuters and AP. China’s CSI 300 entered a bear market and Brent crude rose above $112. The daily candle closed at $81,322 on DefiLlama, down 3.24% from October 21.
Why did Bitcoin dominance rise while prices fell?
Altcoins fell faster than BTC. The CoinDesk 80 index dropped 3.2% against 2.5% for the CoinDesk 5, and DeFi tokens led the losses, with Curve down 8.2% and Ethena down 7.2%. Bitcoin’s share of the total crypto market reached 60% on October 21, its highest since May, per a TradingView chart cited by CoinDesk. A falling market with a rising BTC share shows capital moving toward the largest asset rather than leaving crypto altogether.
Which Bitcoin ETFs recorded outflows on October 22, 2026?
All 12 U.S. spot Bitcoin ETFs lost a net $635.6M, per DefiLlama, ending three sessions of inflows. BlackRock’s IBIT led with $254.1M, followed by Fidelity’s FBTC at $217.5M, ARKB at $109.4M and GBTC at $29.5M. Those four funds account for about 96% of the outflow. The day left October at about −$175.6M month to date, a Coinjuice calculation from DefiLlama’s totals.
What do Bitcoin’s moving averages show after the October 22 drop?
On CryptoQuant daily closes, the October 22 close of $81,383 sat 1.99% below the 20-day average and 0.50% below the 50-day, but 11.79% above the 200-day. Price held 0.36% above the 3D 20-period average. Daily momentum faded, with the MACD histogram negative and widening and the Bollinger position in the lower third of the band, while bandwidth remains below its 60-day median, a squeeze that does not indicate direction.
Disclaimer
The information provided in this article is for informational purposes only. It is not intended to be, nor should it be construed as, financial advice. We do not make any warranties regarding the completeness, reliability, or accuracy of this information. All investments involve risk, and past performance does not guarantee future results. We recommend consulting a financial advisor before making any investment decisions.
More like this


Written by

Andrew Kamsky
Andrew Kamsky is a Bitcoin analyst. He spent a decade in traditional finance across a Big Four firm and a listed fintech bank before going deep on Bitcoin full-time.