










Quick summary
Bitcoin's 2026 structure centers on four key zones, not routine 10 percent swings
Active support sits between $57,000 and $67,000, anchored by the 200 week moving average
Deep demand floor lies between $50,000 and $55,000, where long term holders historically defend
Major resistance comes from the $126,200 all time high plus round numbers $100,000 and $150,000
Bitcoin can move 10% in a week without changing anything about the long-term structure underneath it. Most retail investors mistake a 10% swing for fresh information. In reality, Bitcoin keeps reacting around a small set of structural levels cycle after cycle, with four standing out most heading into the rest of 2026.
The breakdown below names the four levels that matter most: active support in the mid $60,000s, the deeper demand floor near $50,000 to $55,000, the October 2025 all-time high, and the round-number resistance above and below it. The breakdown below highlights all the levels that matter and how to use the structure without leverage.
Level | Price |
October 2025 all-time high | $126,200 |
200-week moving average | $61,000 |
Active support range (top) | $67,000 |
Active support range (bottom) | $57,000 |
Deep demand floor (top) | $55,000 |
Deep demand floor (bottom) | $50,000 |
Round-number resistance | $100,000 |
Round-number resistance | $150,000 |
If You Only Track Four Bitcoin Levels in 2026, Track These
Four levels do most of the work explaining Bitcoin's 2026 price behavior. Everything else is detail.
1. Active Support: The $57,000 to $67,000 Range
Since stabilizing after the February 2026 low, Bitcoin has built a range roughly between the high $50,000s and mid $60,000s, with price sitting near $65,000 as of July 16, 2026. The range marks active support, the floor worth watching on the next pullback.
The 200-week moving average, near $63,125 as of July 16 2026, after climbing from roughly $60,500 in May, sits inside the lower half of the range and works as the last line of defense. Bitcoin touched the 200-week moving average in June and bounced back above it, a sign the long-term trend is holding.
A weekly close back below the 200-week moving average would be a different story: it's historically the kind of level Bitcoin only cracks during the deepest, most fearful stretches of a bear market.
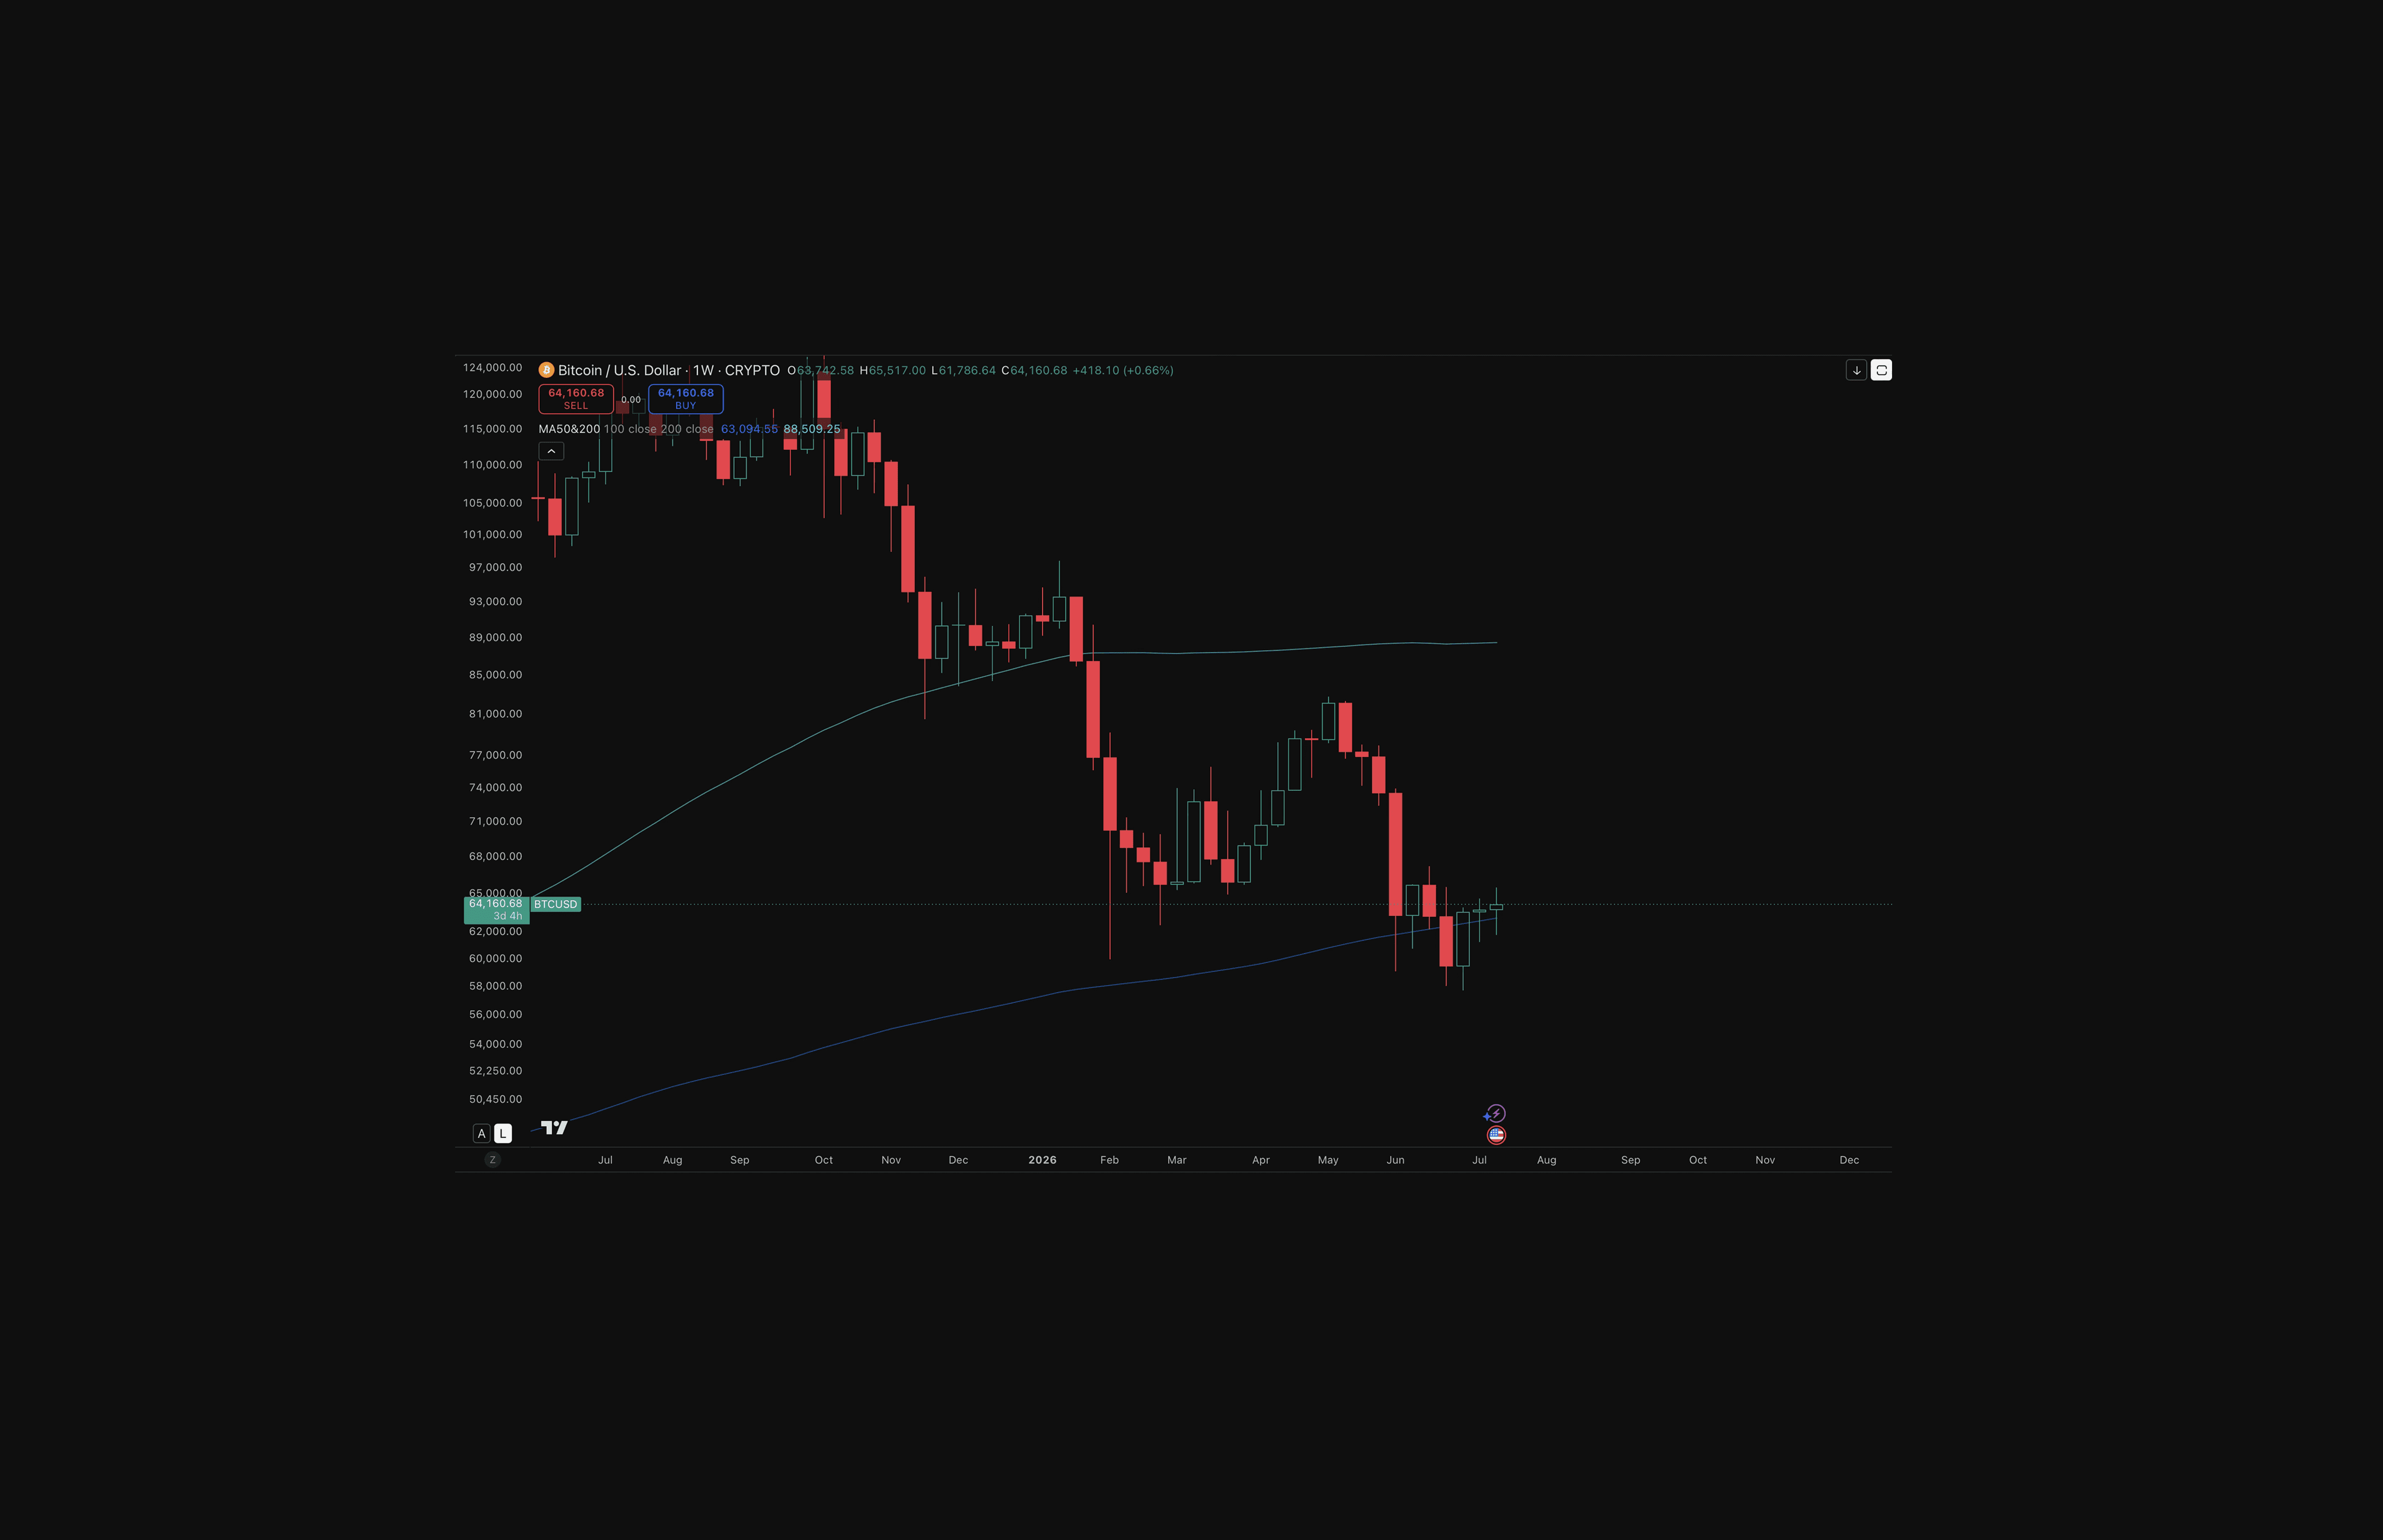
A reclaim after a break below the range is often the more reliable tell, more reliable than the initial break itself.
Weekly closes carry the weight here, not intraday wicks.
2. Deep Support: The $50,000 to $55,000 Demand Floor
Bitcoin peaked near $126,200 on October 6, 2025, then gave up more than half of the peak value inside four months, a decline steep enough to pull price under $60,000 by February 2, 2026. Below current price sits a deeper zone, roughly $50,000 to $55,000, where long-term holders are expected to defend hardest. Analysts studying on-chain cost basis and prior cycle bottoms keep pointing to the same band as the likely floor if the selling gets serious.
If Bitcoin drops sharply, that band is where long-term holders have historically stepped in and bought the hardest. It's not a level worth timing precisely, but ignoring it completely would be a mistake, and if price ever cracks below it, the 2026 pullback would be sitting in the same depth range as past bear markets.
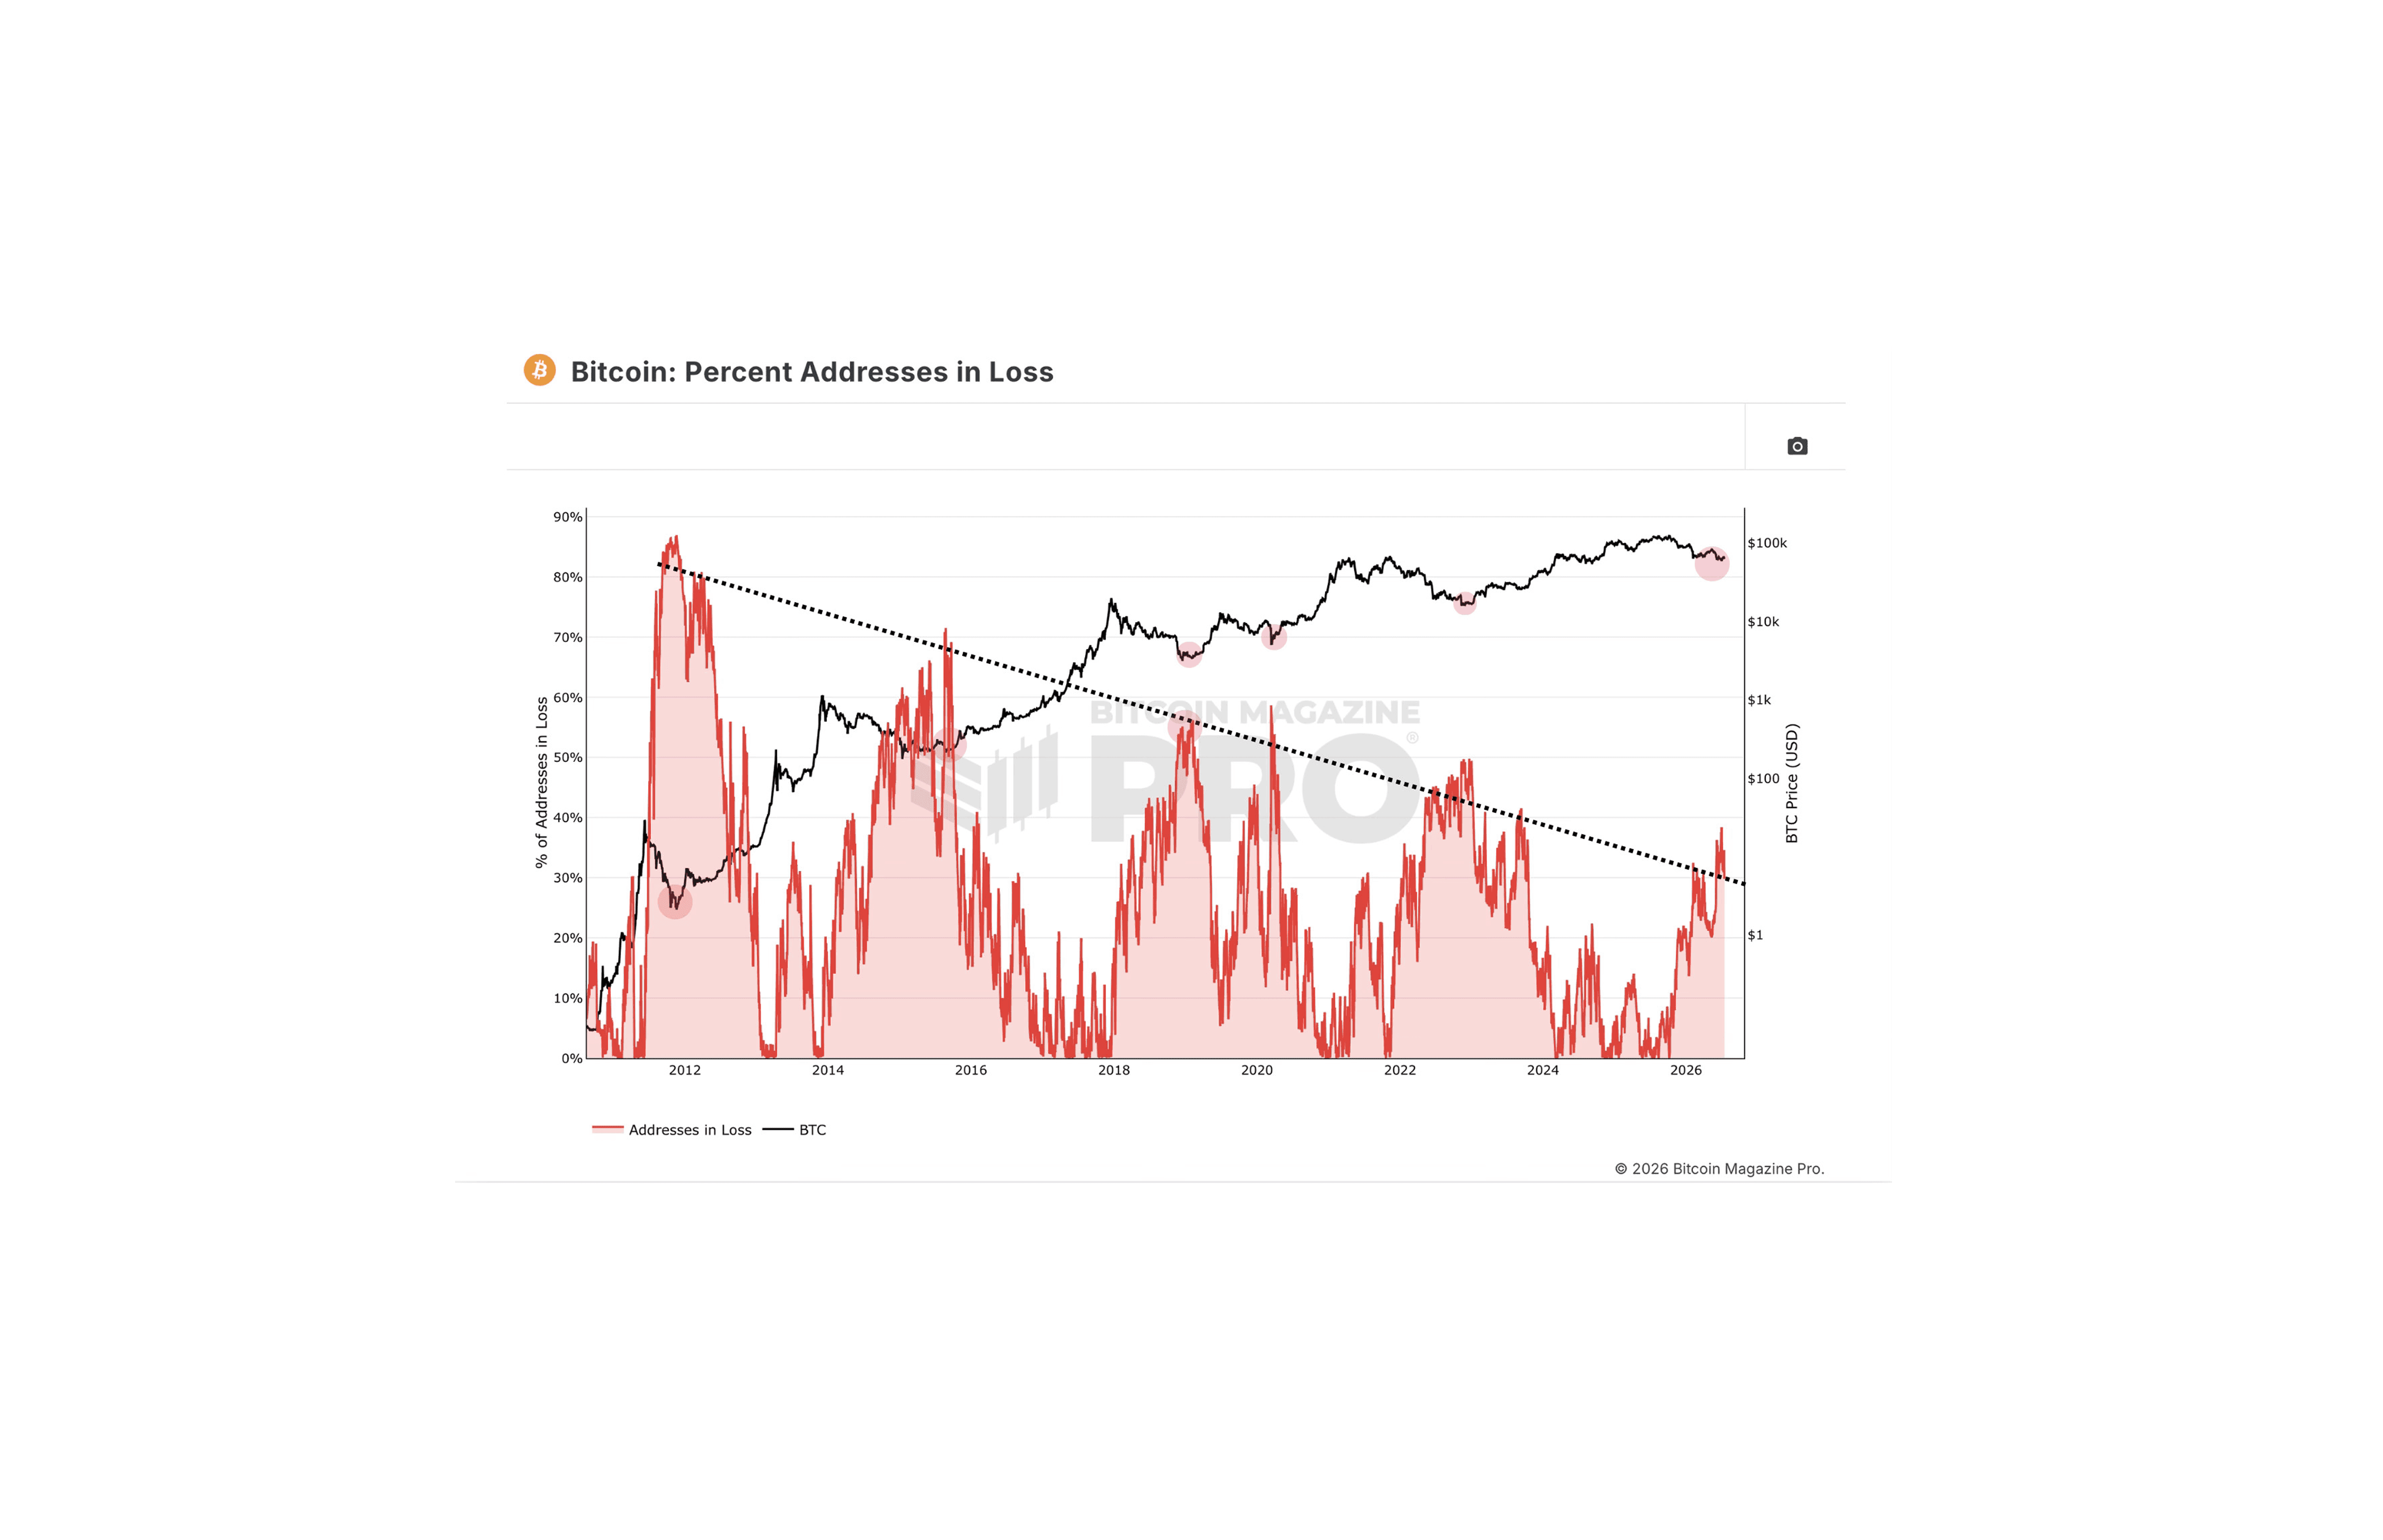
A second on-chain measure adds context to the band: the percentage of Bitcoin addresses sitting in loss has formed a declining ceiling across every cycle since 2011, roughly 82% at the 2011 bottom, dropping through the 50s and 70s across the 2015 through 2022 cycles, and sitting below 40% as of mid-2026. Each cycle appears to need less collective capitulation to mark a bottom. If the pattern holds, the current drawdown could resolve without ever testing the $50,000 to $55,000 band at all, a meaningfully shallower outcome than prior cycles produced.
3. The October 2025 All-Time High
Bitcoin's actual cycle high sits at $126,200, set on October 6, 2025, driven by spot ETF inflows and mounting uncertainty around US fiscal policy, arriving right on schedule with the four-year cycle. The $126,200 level is the resistance overhead for 2026.
Halfway back: Price mid-July 2026, sits close to 50% below the all-time high.
Chase risk: High-volatility zones near a cycle high are exactly where retail investors tend to chase entries, and the pullback following the chase is the most common outcome.
4. Round-Number Resistance: $100,000 and $150,000
Bitcoin first broke $100,000 in December 2024, on a wave of post-election optimism around crypto-friendly regulation. Price spent most of 2025 chopping around the level before breaking above it convincingly on the run to the October 2026 peak.

The history puts $100,000 back in the resistance column for now, the first major round-number level to reclaim on any recovery attempt. The $150,000 has never traded, and even the power law model's more conservative $200,000 target remains untouched. Both stay unclaimed resistance above the current all-time high.
Round number resistance does not always hold, but it almost always produces a reaction. Planning for the reaction beats being surprised by it.
Why These Levels Matter
Four numbers alone do not explain why Bitcoin repeatedly reacts at those levels. Three mechanics do the explaining.
Volume nodes: Price levels where a lot of Bitcoin changed hands in the past. Price often slows down or turns around at these spots because so many buyers and sellers have their cost basis sitting right there.
Previous cycle highs and lows: Bitcoin keeps treating old extremes as important markers. An old all-time high often turns into support once price breaks above it and stays there.
On-chain wallet distribution data: Shows where large groups of holders bought in relative to today's price. Areas with a lot of holders clustered together tend to act like walls, either holding price up or capping it, part of why the deep demand floor matters so much in 2026.
What Drives Bitcoin Volatility Spikes in 2026
The four levels explain where volatility tends to occur. Three catalysts explain what triggers Bitcoin volatility in 2026.
Macro rate decisions: Bitcoin remains sensitive to central bank policy signals. A tariff-related inflation scare in late February 2026 pushed rate cut expectations off the table almost overnight and accelerated the initial leg of the correction.
ETF flow data: Spot Bitcoin ETF inflows and outflows have become a meaningful short-term volatility driver. US spot Bitcoin ETFs saw a five-session outflow streak of roughly $1.7 billion in mid/late-January 2026, followed by another four-day stretch of about $1.5 billion in outflows in late January, pressure that lined up with the early leg of the correction.
Liquidation cascades: Holding spot Bitcoin with no leverage doesn't remove exposure to the broader leveraged market. Forced liquidations from leveraged longs can amplify a move once price cracks a support level, and that dynamic played a role in the February 2026 decline. Separately, the Mt. Gox creditor repayment deadline (now pushed to October 31, 2026) remains a scheduled event worth watching: in June 2026, roughly 10,422 BTC moved out of a long-dormant estate wallet, though it went to a new address rather than an exchange, and analysts stopped short of calling it a sign of imminent selling.
How to Use These Levels Without Leverage
The most common mistake retail investors make treats high volatility as a reason to size up. Higher volatility raises risk per unit of price movement. It does not automatically raise expected return.
A more useful approach:
Reduce position size near resistance zones: a major level like $100,000 or the October 2025 high approaching means a potential reversal sits closer than usual, so smaller size means a reversal costs less. That said, resistance doesn't always hold, Bitcoin has broken clean through prior cycle highs before, and this time could be another case where the level gets blown open rather than defended.
Add near confirmed support, not the first touch: A known support zone, such as active support or the deep demand floor, earns more weight once price produces multiple daily closes holding above a high rather than a single wick into the level. Structural significance combined with a genuine bounce, not a falling knife, defines the entry.
Read volatility compression as a cue: When Bitcoin's daily price swings shrink after a big move, it's often the calm before a breakout. The next breakout tends to continue in the same direction as the move before it, though not always.
Avoid trading through high-impact events without a plan: A scheduled macro event, such as the October 2026 Mt. Gox repayment date or a Fed meeting, calls for pre-defined levels and responses, or staying flat entirely. Reacting in real time to fast-moving news produces most retail losses.
Choosing the right entry levels and setting limit orders in advance is what separates a plan from a guess. The full breakdown, covering position sizing, entries, and exits without a single liquidation risk in the mix, lives in the Coinjuice ebook, Bitcoin Trading Without Leverage.
Short-Term Swings vs Structural Change
Bitcoin produces weeks in 2026 where price moves 10% in either direction without any change to the underlying structural picture. Volatility is simply the cost of participation.
Consistent results come from investors who know which moves matter structurally and which ones do not, not from investors predicting every move correctly.
Tracking the four levels above builds a map. Navigating still takes work, but blind navigation is off the table.
Markets do not reward prediction. They reward preparation. Structure comes first. Price follows.
The same preparation-first approach runs through the Coinjuice Research Hub: more than 150 research articles, weekly video breakdowns, and market analysis built for self-directed Bitcoin investors. PRO access starts at $6.99 per month billed annually.
FAQ
What are the four key Bitcoin price levels to track in 2026?
The four key levels are the active support range at $57,000 to $67,000, the deep demand floor at $50,000 to $55,000, the October 2025 all-time high at $126,200, and the round-number resistance levels at $100,000 and $150,000.
Why is the $50,000 to $55,000 zone considered a deep demand floor?
The $50,000 to $55,000 zone is where long-term holders are expected to defend hardest, based on on-chain cost basis and prior cycle bottoms, and is seen as the likely floor if selling becomes serious.
What factors currently drive major volatility spikes in Bitcoin during 2026?
Major volatility spikes are driven by macro rate decisions, spot Bitcoin ETF inflow and outflow data, and liquidation cascades in the leveraged market, with the Mt. Gox creditor repayment schedule also highlighted as a key event to watch.
How should investors use support and resistance levels without leverage?
Investors are advised to reduce position size near resistance zones, add near confirmed support after multiple daily closes rather than the first touch, treat volatility compression as a cue for potential breakouts, and avoid trading through high-impact events without a predefined plan.
Disclaimer
The information provided in this article is for informational purposes only. It is not intended to be, nor should it be construed as, financial advice. We do not make any warranties regarding the completeness, reliability, or accuracy of this information. All investments involve risk, and past performance does not guarantee future results. We recommend consulting a financial advisor before making any investment decisions.
More like this


Written by

Andrew Kamsky
Andrew Kamsky is a Bitcoin analyst. He spent a decade in traditional finance across a Big Four firm and a listed fintech bank before going deep on Bitcoin full-time.