










Quick summary
Bitcoin trades around $83,226 amid flat price action and rising holder unrealized profits
Dollar strength explains roughly 17 percent of Bitcoin’s daily moves, with fluctuating correlations
Europe gains pound and euro-hedged Bitcoin ETCs to separate Bitcoin and dollar exposure
On-chain data shows profit-taking, cooling demand, yet continued ETF inflows and key supports below
Bitcoin traded at $83,226 on September 30, 2026, the final day of the third quarter, 34.03% below its all-time high of $126,156 and 2.88% above its 20-day average of $80,951. The price has barely moved across the last three days. Beneath the lack of price action, a rising dollar is drawing headlines, while the on-chain data points to a quieter pressure: holders sitting on the widest gains since December 2024.
Bitcoin and the Dollar: A Real Link That Explains 17%
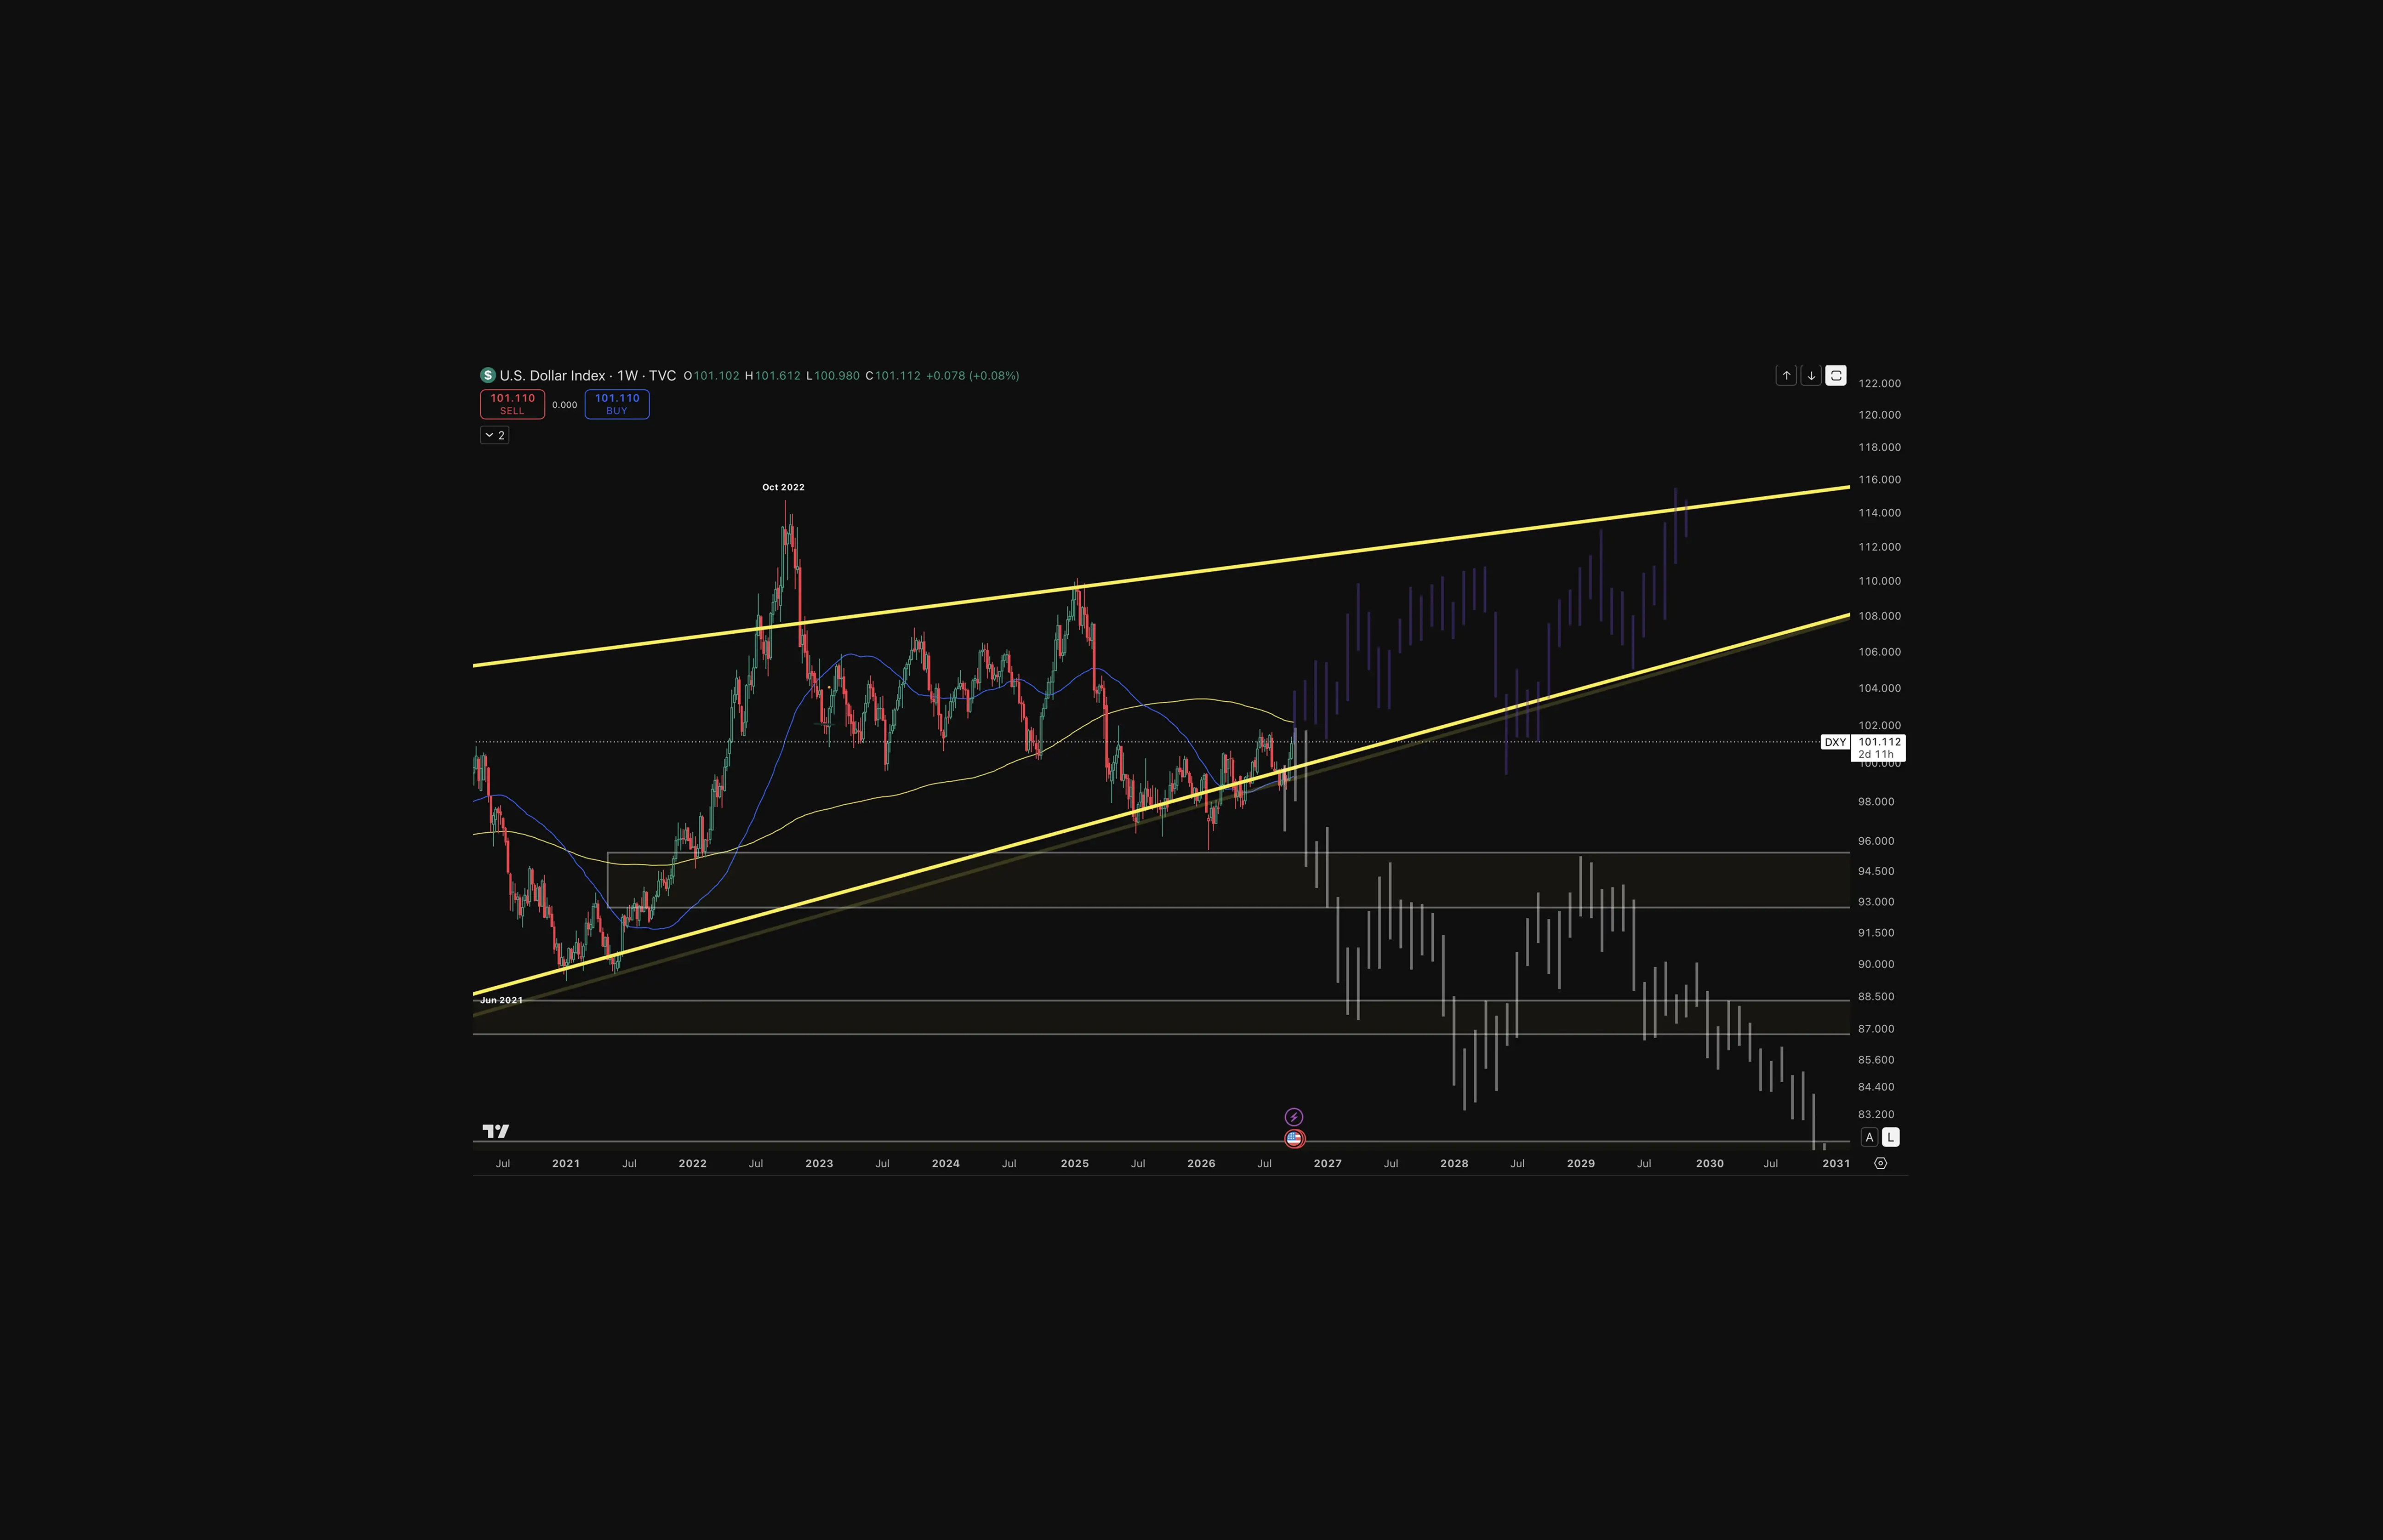
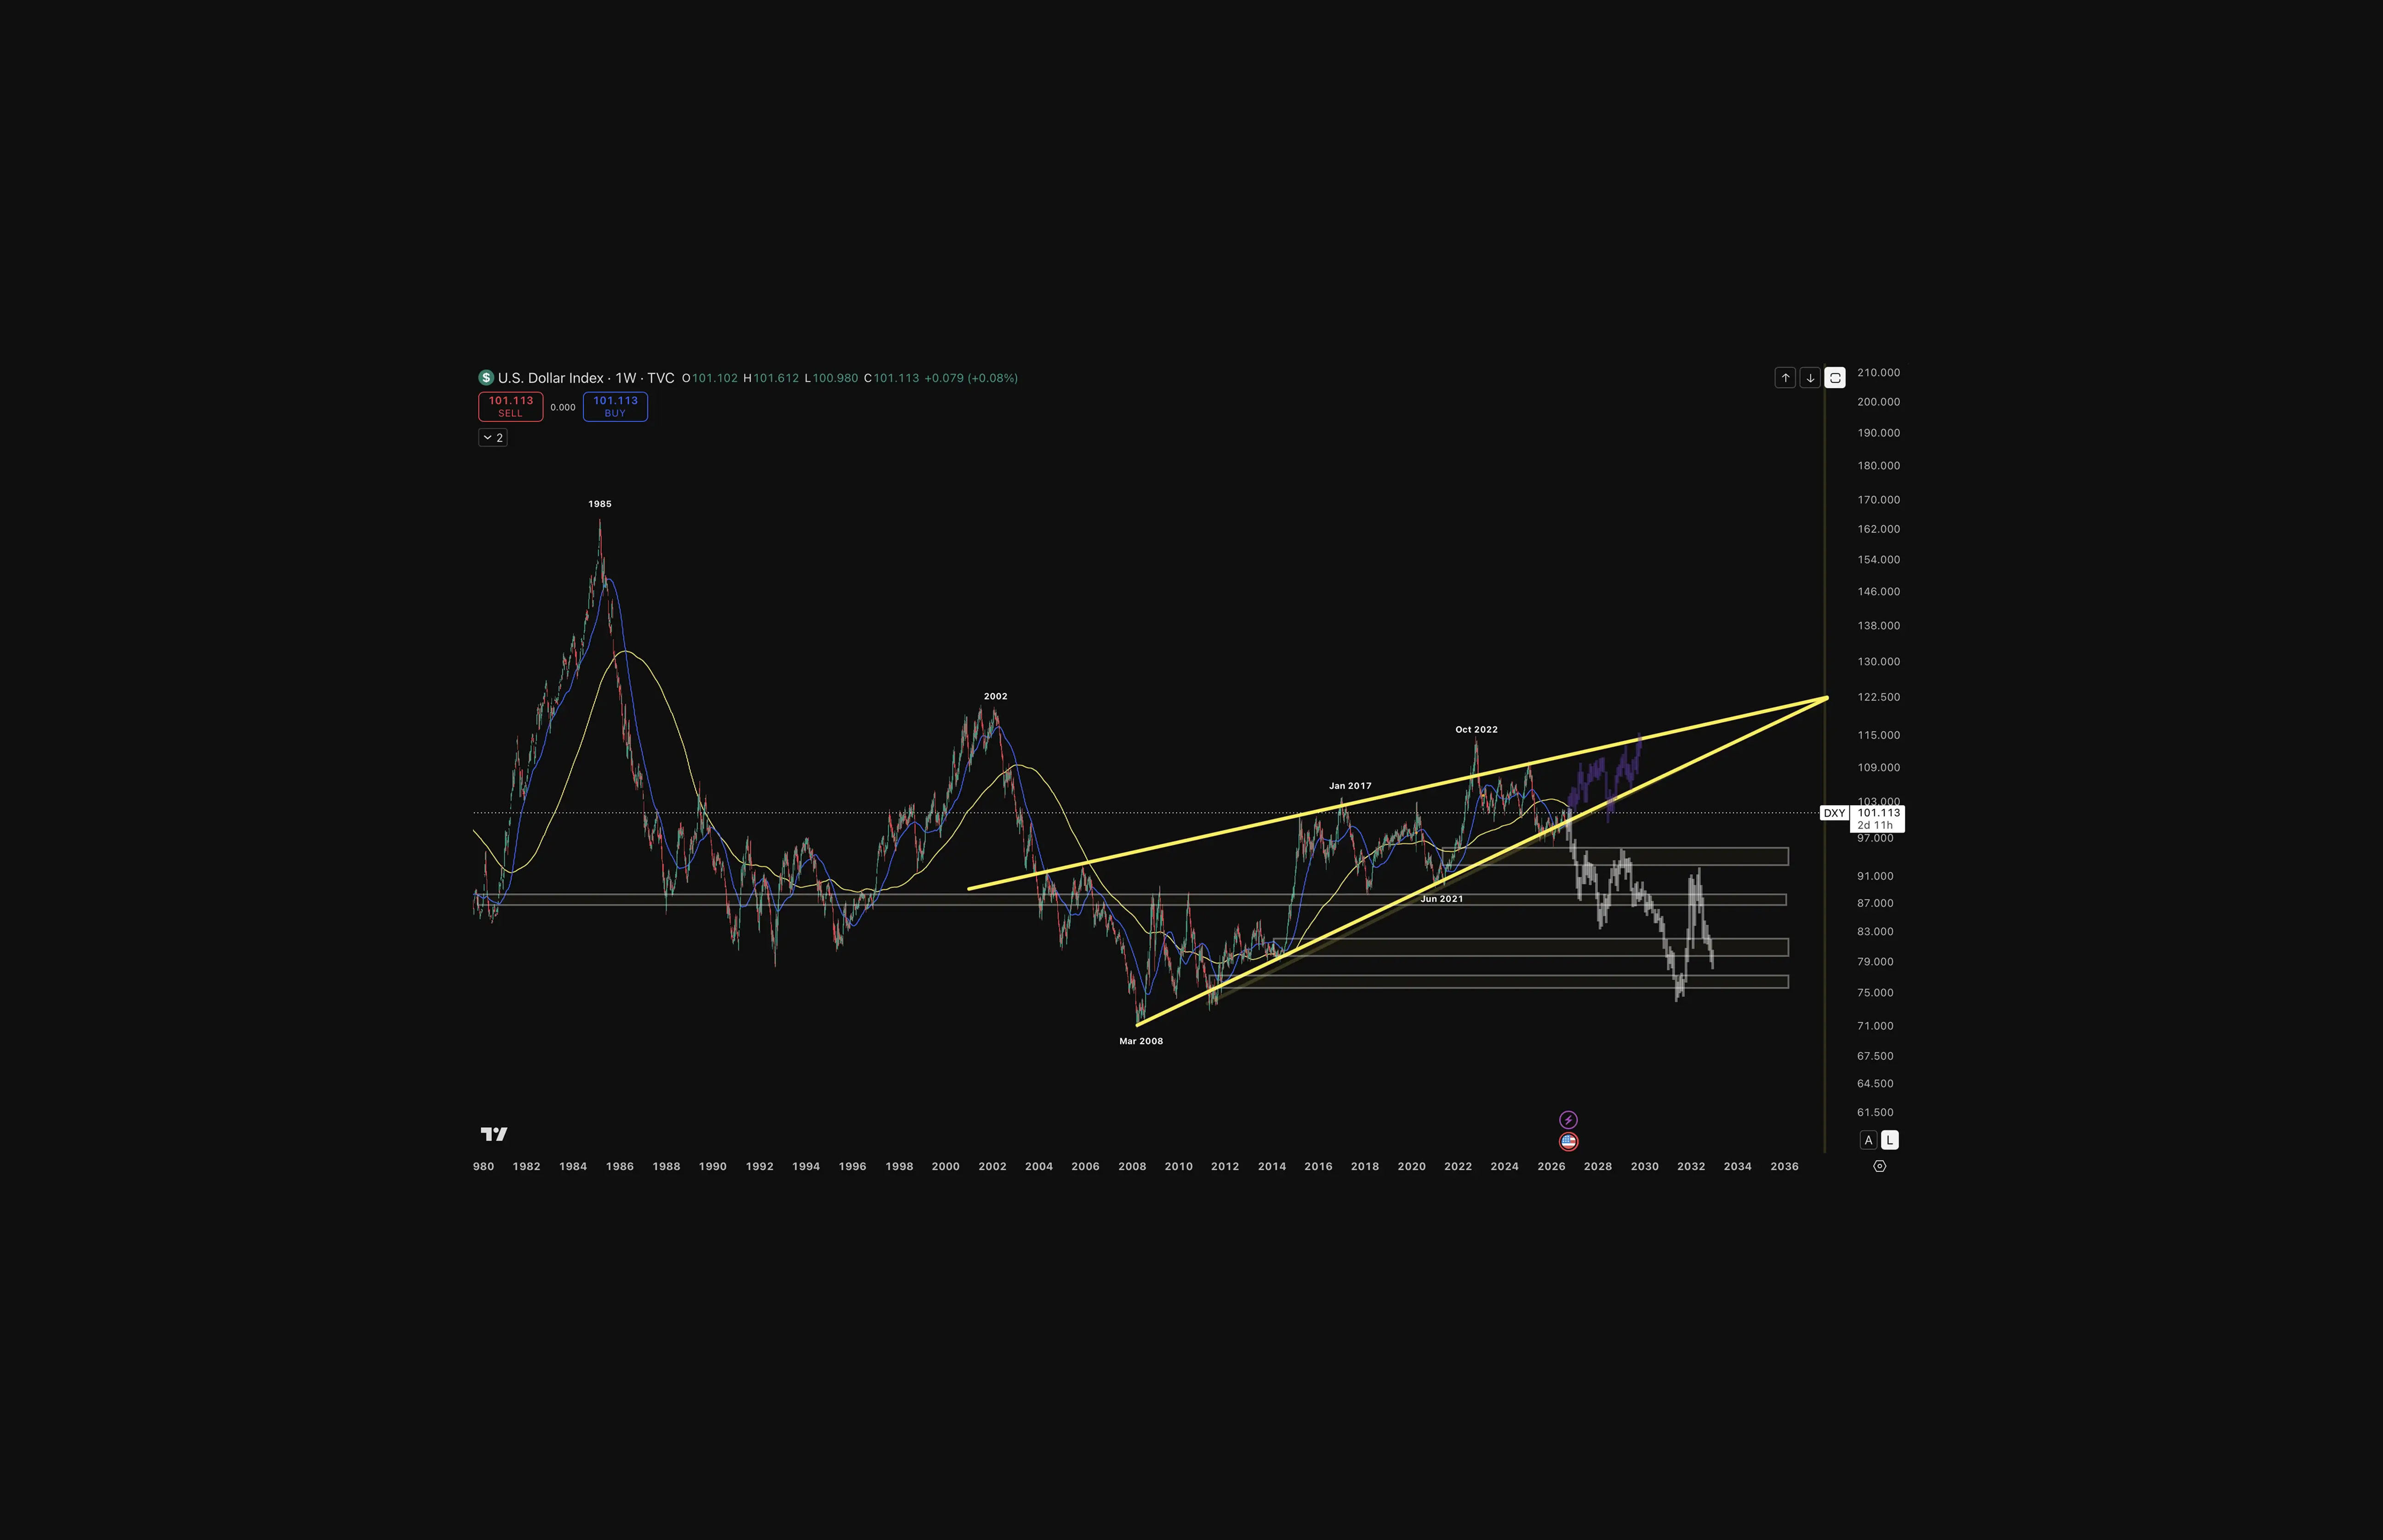
The US Dollar Index (DXY), which tracks the dollar against a basket of major currencies, has climbed through September. The correlation data shows the dollar accounts for about a sixth of Bitcoin's daily price moves, far less than a headline two-month high implies:
The dollar's run: DXY gained about 2.6% since September 9 and reached a two-month high of 101.69 on September 29, per CoinDesk. Bitcoin has stalled over the same stretch, sitting below its $87,291 high of September 21.
A real but modest link: Over 90 trading days, daily moves in Bitcoin and DXY show a correlation of −0.41, the most negative reading since February 2023. That converts to an R-squared of 0.17, meaning the dollar accounts for about 17% of the variation in Bitcoin's daily returns.
The short window leans on two days: The 30-day reading of −0.45 depends heavily on August 19 and September 3, when Bitcoin jumped more than 5% as the dollar fell. Without those two sessions, it drops to −0.19.
The long view is looser still: Since January 2020, the 90-day correlation has averaged −0.14 and has turned positive at times, peaking at +0.22 in November 2024.
Macro checkpoints ahead: The BEA's August personal income and outlays report, which carries the PCE inflation measure, and the Q2 GDP third estimate were scheduled for 8:30 a.m. ET on September 30. The September jobs report follows on October 2.
Europe also gained a new way to separate the two exposures on September 30:
Two hedged products: HANetf listed a pound-hedged Bitcoin ETC (GBTC) on the London Stock Exchange and a euro-hedged version (EBTC) on Xetra and Euronext Paris, with HSBC providing the currency hedges, per CoinDesk. HANetf describes them as the first currency-hedged crypto ETCs. Keep in mind, the London ticker is not to be confused with Grayscale's US-listed Bitcoin Trust, which trades under the same letters.
Why the product exists: Bitcoin is priced almost everywhere in dollars, so a European buyer holds a view on the dollar alongside a view on Bitcoin. HANetf co-CEO Hector McNeil drew the same comparison with gold, per Portfolio Adviser.
The gold precedent: Currency-hedged gold ETCs already hold $23 billion, roughly 13% of Europe's gold ETC market. Crypto-tracking ETCs in Europe held about $12 billion at the end of June 2026, according to ETFBook data cited by Portfolio Adviser.
Interpretation: Because Bitcoin and the dollar tend to move in opposite directions, an unhedged European holder already carries a partial cushion: when the dollar rises and Bitcoin slips in dollar terms, the currency move lifts the position's value in euros or pounds. A hedge removes that cushion along with the drag of a weaker dollar. The hedge only changes how currency swings affect a European holder's return. It does not change how much Bitcoin itself rises or falls, and that part drives most of the result.
The dollar also matters indirectly: it is one of several forces shaping how easy or expensive money is to borrow, and Coinjuice's review of the research on the Fed and Bitcoin found those wider conditions move Bitcoin more than Treasury yields alone.
Bitcoin Holders Take Profits: A Bull Market Showing Fatigue
A September 29 CryptoQuant report, covered by The Block, describes a market that remains in an uptrend while the buyers behind the September rally cash out:
The trend, on CryptoQuant's read: Bitcoin's close above its 365-day moving average the prior week confirmed a new bull market, according to head of research Julio Moreno. The firm's Bull Score Index stands at 90 out of 100.
Traders hold wide gains: Short-term traders' onchain unrealized profit margin reached 33%, its highest level since December 2024. Moreno noted that margins at similar levels have historically encouraged profit-taking.
Profits were already banked: Holders realized 25,700 BTC in profit on September 22, the largest single day of 2026. Moreno said profit-taking of this kind after a strong rally has historically come before local market tops.
Demand is cooling on two fronts: CryptoQuant's measure of apparent spot demand shrank by 170,000 BTC over 30 days. Growth in speculative futures demand, which Moreno described as the main driver of the rally, slowed from 164,000 BTC on September 14 to 16,000 BTC on September 29.
ETF buyers have not left: Spot Bitcoin ETFs took in $66.2 million on September 29, per DefiLlama's tracked data, extending the inflow run that began on September 17 to nine days. The six reporting dates from September 22 to September 29 total $1.484 billion, a slower pace than the $999.0 million recorded on September 21 alone.
Two measures, different ground: ETF flows track one buyer channel, while apparent demand is CryptoQuant's network-wide estimate. The two readings point in different directions, and neither settles the other.
Selling pressure beyond Bitcoin: The seven-day count of altcoin exchange inflow transactions rose to 76,000, the highest since October 17, 2025. Moreno noted that date fell 11 days after Bitcoin's previous all-time high.
Where support sits, per CryptoQuant: The 365-day moving average near $80,000 is the first level, followed by the 200-day moving average near $71,000 and the trader onchain realized price around $67,000. Moreno called a pullback toward these levels a "healthy consolidation" provided they hold. The first level sits close to Bitcoin's 20-day average of $80,951, and Coinjuice's map of Bitcoin support and resistance levels in 2026 places the deeper zones in context.
Interpretation: The dollar has pressed on Bitcoin through September without moving it far, while the holders who bought the rally have been selling into it. ETF inflows keep a floor of demand in place, but at a fraction of the September 21 pace. The dollar explains little of Bitcoin's daily moves; holders' profit-taking is the variable to watch.
Coinjuice Lens: Trading Psychology
Stretched profit margins create a familiar pull: sell before the top, or hold for the next leg. CryptoQuant's own support map shows how wide the range of outcomes is, from a shallow dip to $80,000 to a deeper test near $67,000, all within what the firm still calls a bull market. Coinjuice's breakdown of why avoiding liquidation beats timing the top reframes that decision around position size and survival across a full cycle rather than picking the peak. The dollar explains little of Bitcoin's daily moves; holders' profit-taking is the variable to watch.
Readers looking to navigate profit-taking and a firmer dollar can start with the Coinjuice ebook, Bitcoin Trading Without Leverage, or go deeper with a Coinjuice subscription, where we start and complete trades and you will learn to snipe them independently.
News Behind Today's Read
A Stronger Dollar Is a Weaker Threat to Bitcoin Than Traders Think (CoinDesk). Source for the DXY move to 101.69, the 90-day, 30-day and long-run correlation readings, and the 17% R-squared figure.
How European Investors Can Now Buy Bitcoin Without Taking On U.S. Dollar Risk (CoinDesk). Source for HANetf's GBTC and EBTC listings, the HSBC hedging role and the $23 billion hedged gold ETC comparison.
HANetf Launches World's First Euro-Hedged Bitcoin ETC (Portfolio Adviser). Source for Hector McNeil's comments and the ETFBook figure on European crypto ETC assets.
CryptoQuant Says Bitcoin Correction Could Be Near as Traders' Unrealized Profit Hits 21-Month High (The Block). Source for the profit margin, the September 22 realized profit record, the demand readings, altcoin inflows and CryptoQuant's support levels.
Continue the read: Sept. 29 · Sept. 28 · Sept. 25
Market Snapshot
Asset | Price | Distance from ATH |
BTC | $83,226 | 34.03% below ATH ($126,156) |
ETH | $2,671 | 46.01% below ATH ($4,946) |
ETH/BTC | 0.03209 | Spot ratio, DefiLlama |
DeFi TVL | $94.70B | Global aggregate, DefiLlama |
Data as of September 30, 2026, approximately 05:02 UTC. Source: DefiLlama. ETF flow figures are DefiLlama-tracked; dollar correlation, ETC and on-chain figures are externally reported and labeled by source above.
This article was developed with the support of artificial intelligence tools as part of Coinjuice's editorial process and reviewed by our editorial team before publication.
FAQ
How strongly does the U.S. dollar influence Bitcoin’s daily price moves right now?
Over the last 90 trading days, the correlation between Bitcoin and the U.S. Dollar Index (DXY) is −0.41, which translates to an R-squared of 0.17, meaning the dollar explains about 17% of the variation in Bitcoin’s daily returns.
What new currency-hedged Bitcoin products became available to European investors on September 30, 2026?
HANetf listed a pound-hedged Bitcoin ETC (GBTC) on the London Stock Exchange and a euro-hedged Bitcoin ETC (EBTC) on Xetra and Euronext Paris, with HSBC providing the currency hedges.
What on-chain signs suggest Bitcoin’s bull market may be showing fatigue?
Short-term traders’ unrealized profit margin has reached 33%, its highest since December 2024; holders realized 25,700 BTC in profit on September 22, the largest single day of 2026; and CryptoQuant’s apparent spot demand has shrunk by 170,000 BTC over 30 days while speculative futures demand growth has slowed sharply.
Where are the key Bitcoin support levels identified by CryptoQuant?
CryptoQuant highlights the 365-day moving average near $80,000 as the first support, followed by the 200-day moving average near $71,000 and the trader onchain realized price around $67,000, viewing a pullback toward these levels as a healthy consolidation if they hold.
Disclaimer
The information provided in this article is for informational purposes only. It is not intended to be, nor should it be construed as, financial advice. We do not make any warranties regarding the completeness, reliability, or accuracy of this information. All investments involve risk, and past performance does not guarantee future results. We recommend consulting a financial advisor before making any investment decisions.
More like this


Written by

Andrew Kamsky
Andrew Kamsky is a Bitcoin analyst. He spent a decade in traditional finance across a Big Four firm and a listed fintech bank before going deep on Bitcoin full-time.