


Quick summary
PUMP formed a deep correction below a strong base, enabling asymmetric mean reversion entry opportunity
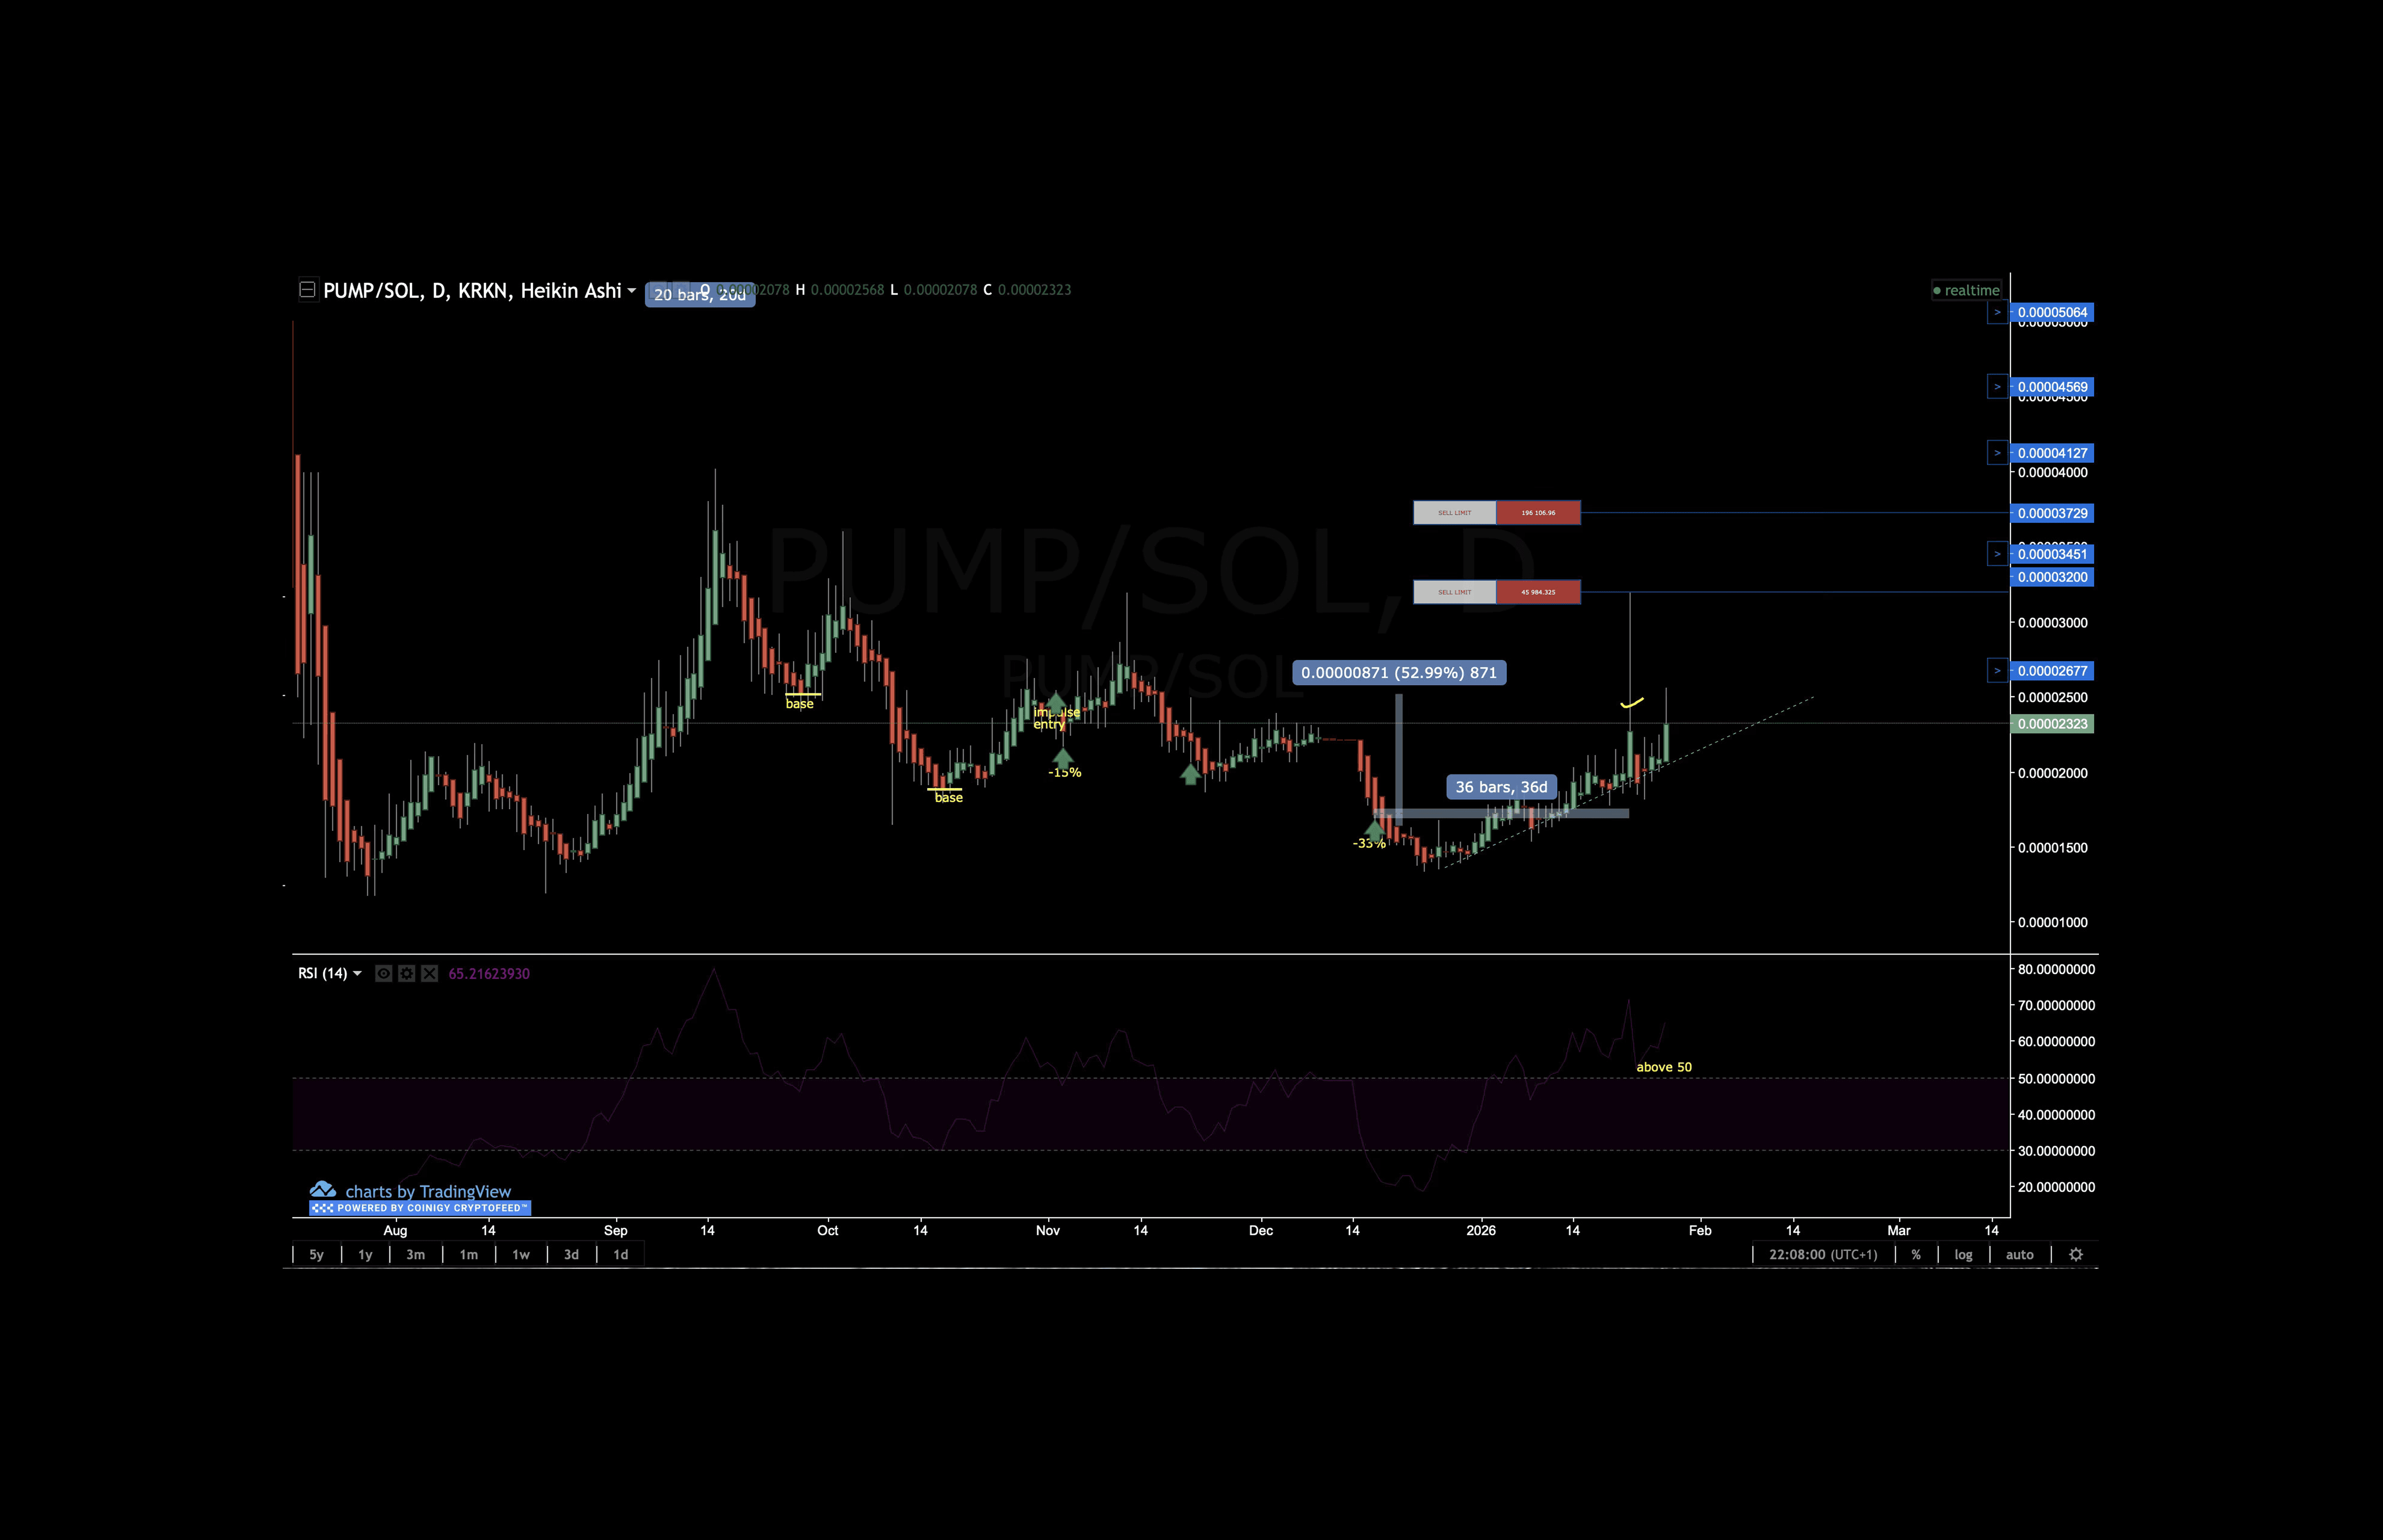
Strcuture has rebounded into higher lows, targeting resistance between roughly 0,42 and 0,45 euro cents
Three day RSI is above 50 since late January 2026, signaling constructive momentum probability signaling higher prices
Versus SOL, PUMP downside pressure has stabilized
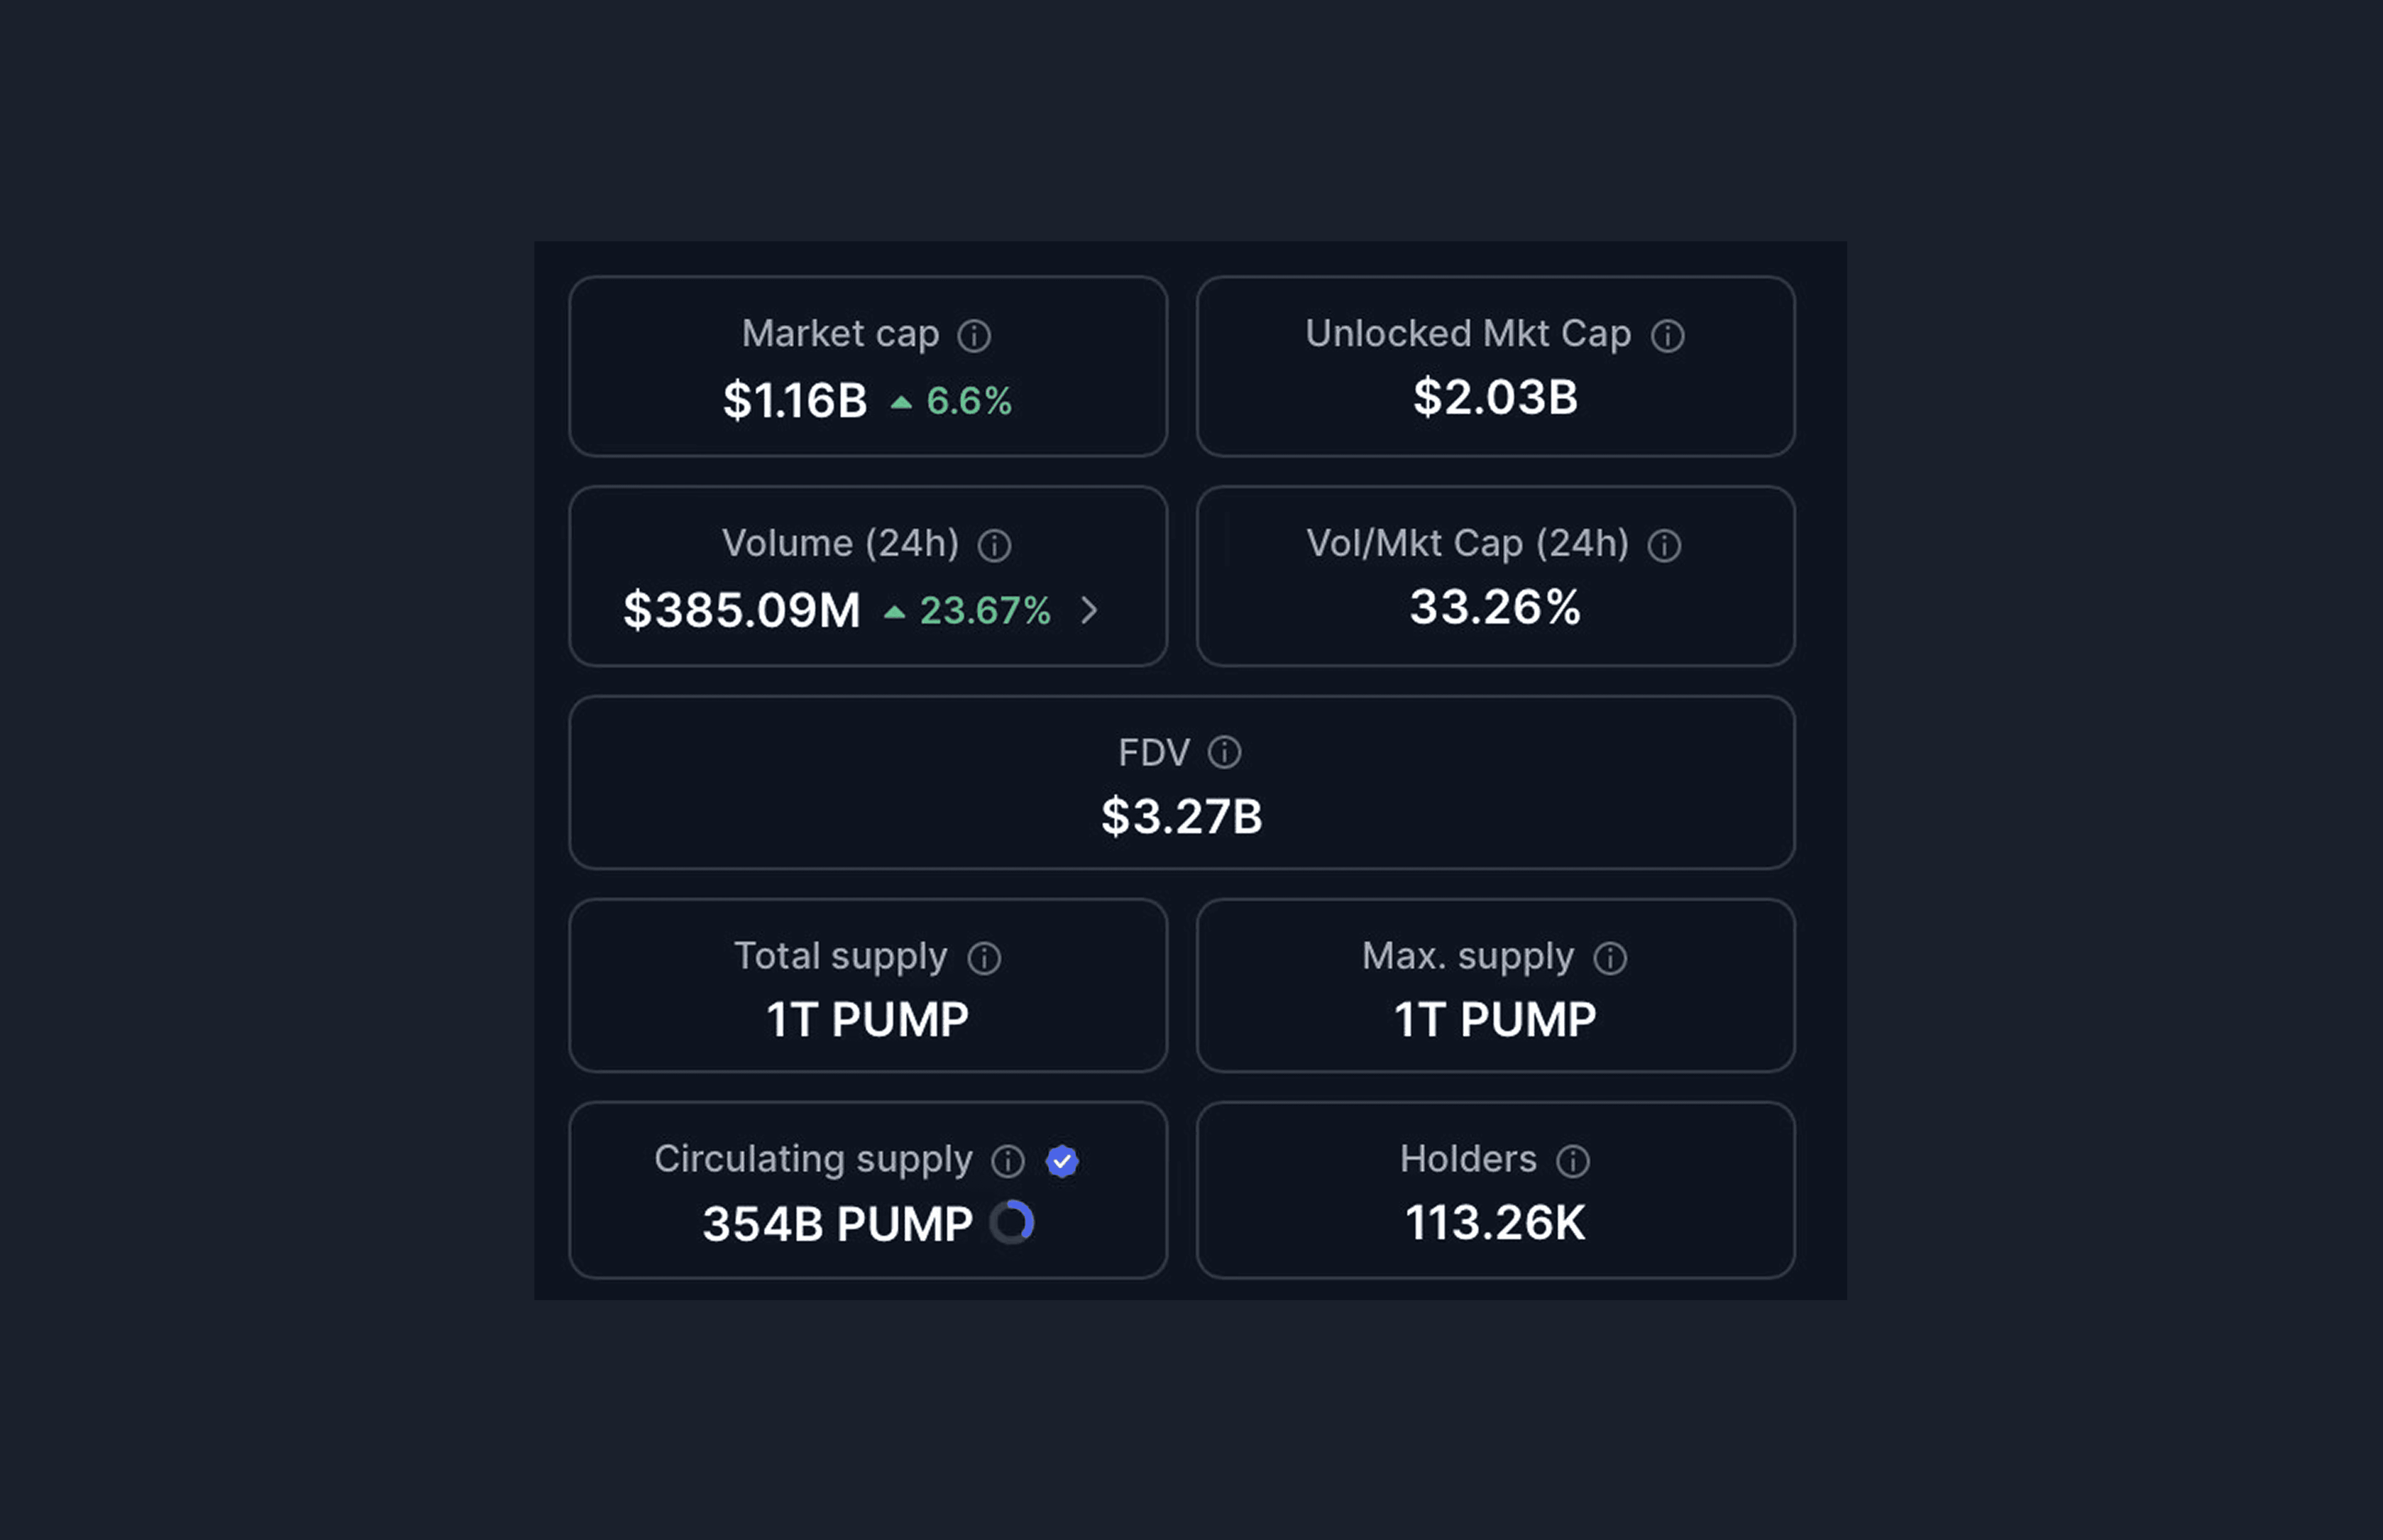
$PUMP Price: €0.00267 | Daily & 3-Day timeframe perspective
This analysis outlines a probability-based technical setup for $PUMP following a corrective phase, with 3-day RSI momentum crossing above 50. The focus is on identifying where risk shifted in favor of the buyer and where logical exits exist.
Starting Point: Entries Below Base
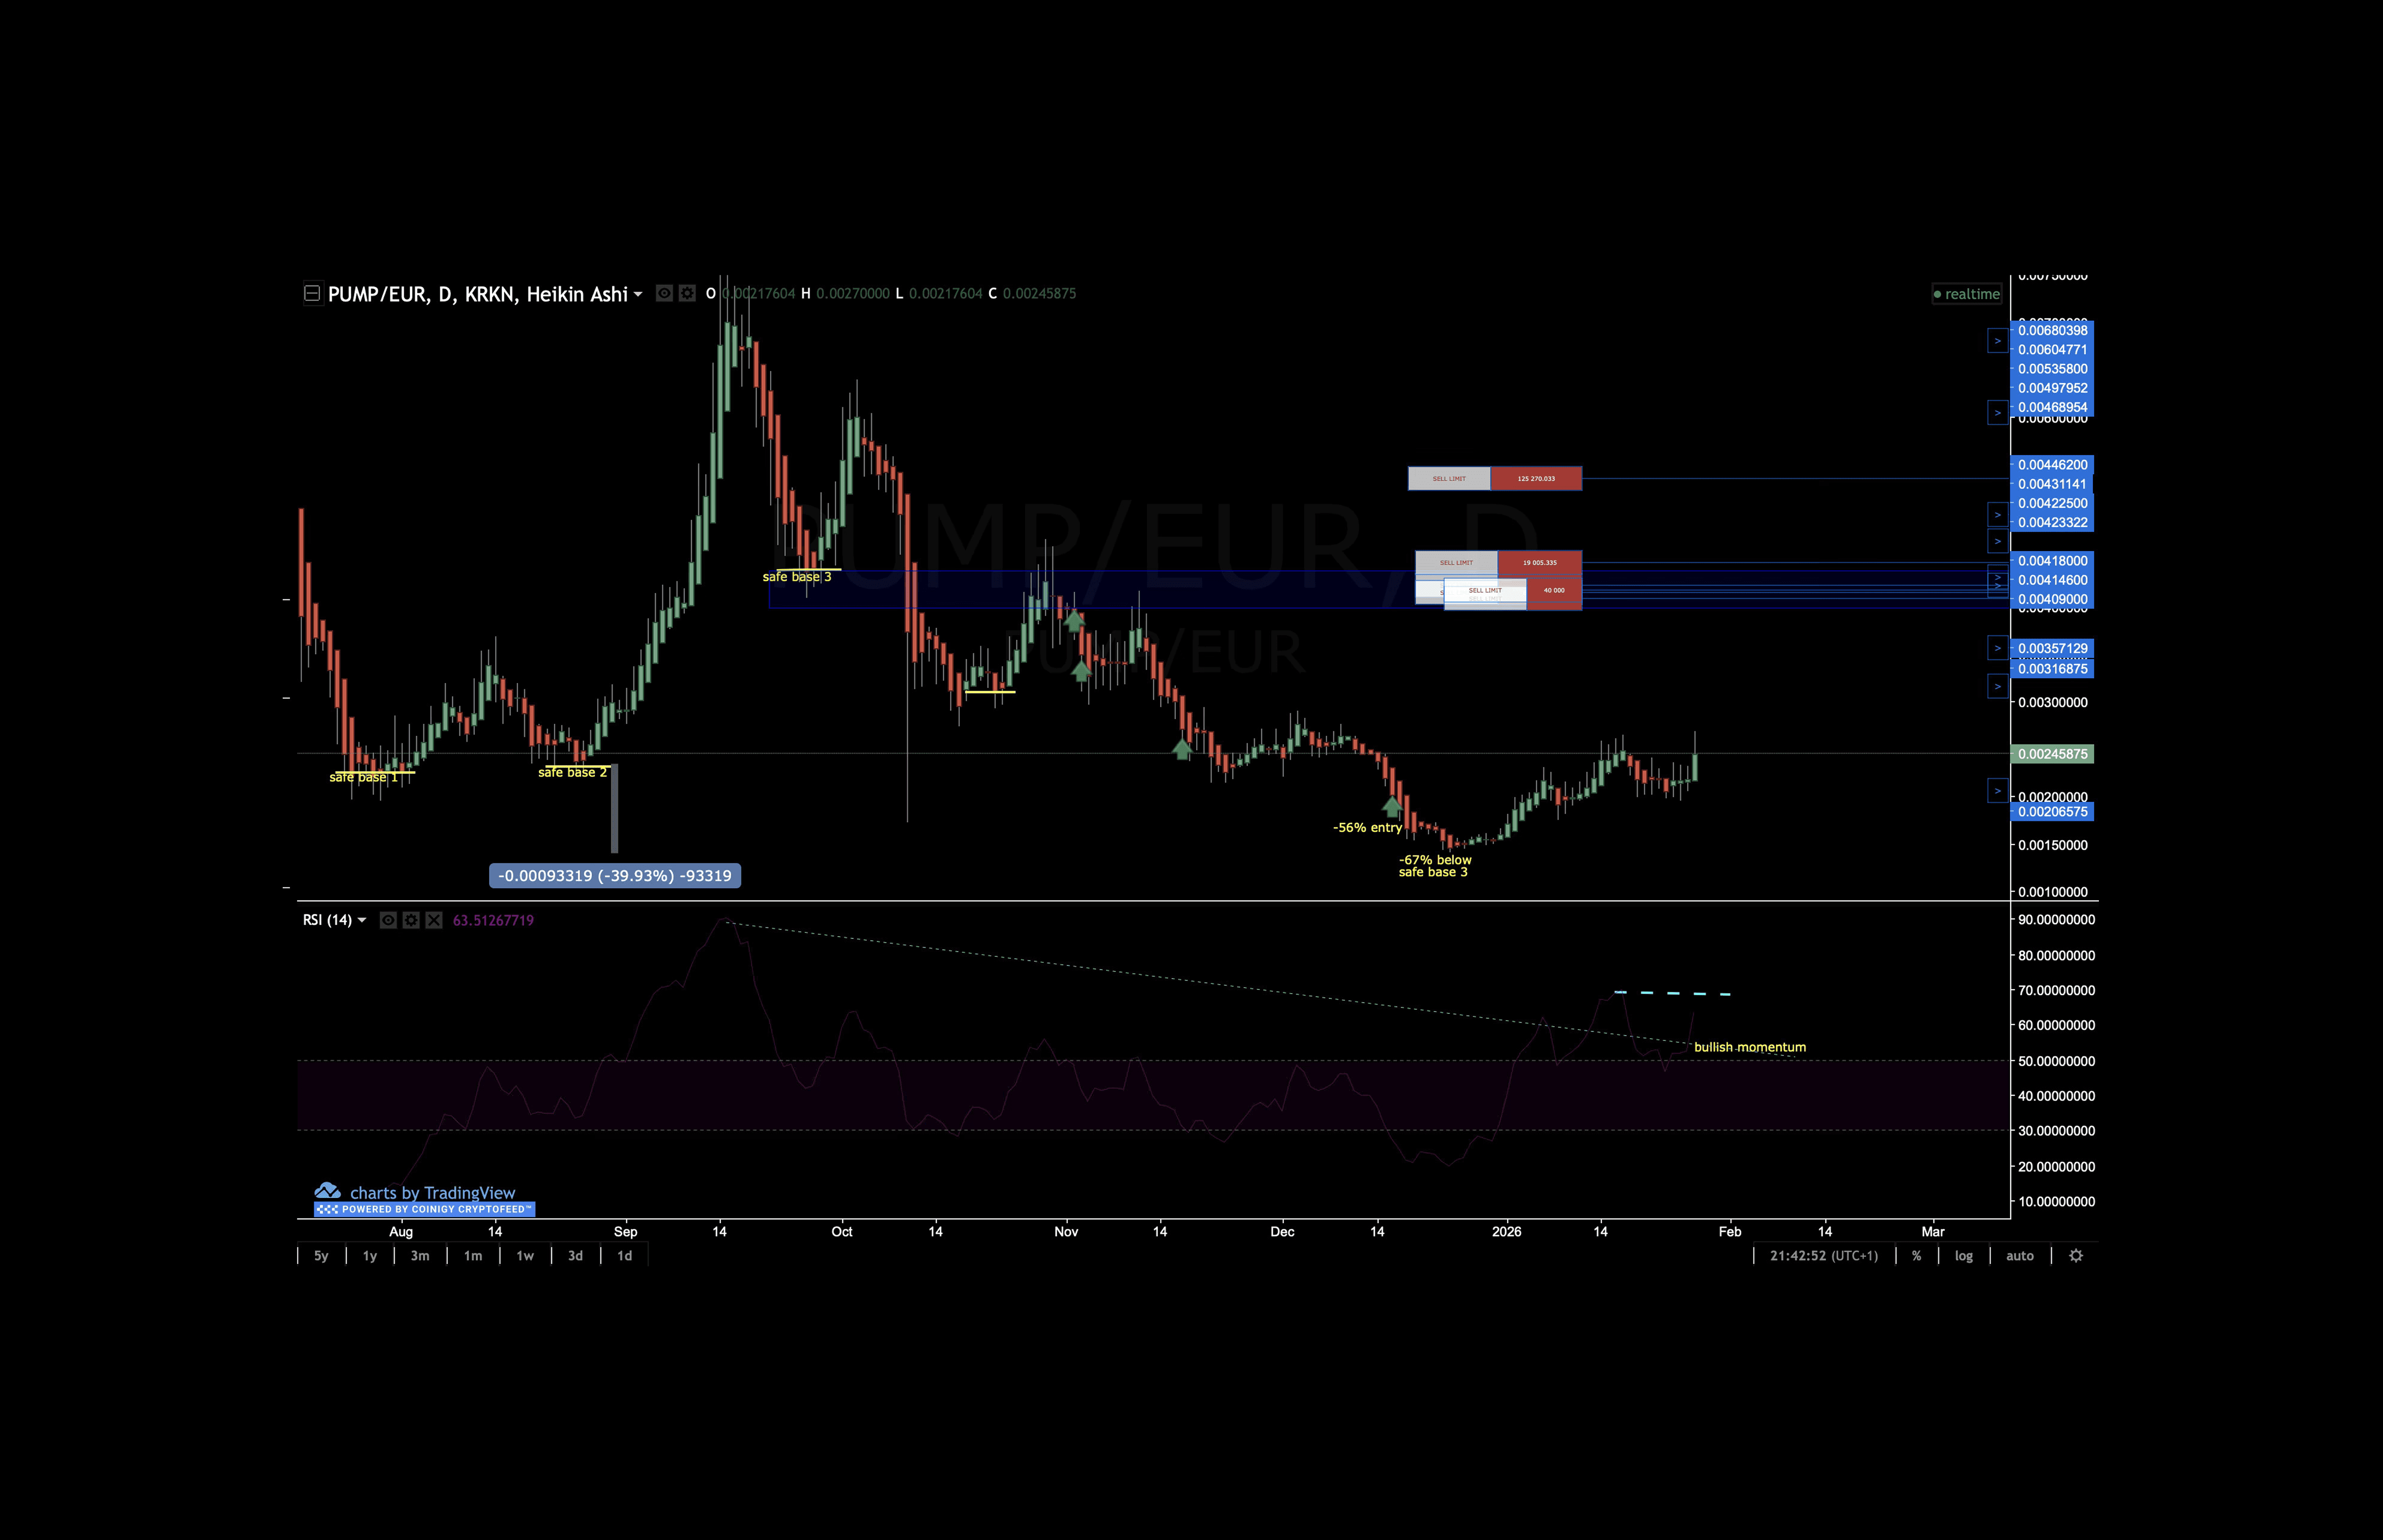
Price spent several months consolidating around three well-defined bases before ultimately breaking down from the highest base level. This breakdown in price triggered a deeper capitulation price move from the €0.00418–€0.00446 base zone, with price bottoming roughly 67% below that base in late December 2025. My lowest entry was taken near -57% below the strong base.
At these low levels, downside risk begins to lessen for the buyer as selling pressure shows signs of exhaustion illustrated in the daily RSI chart below currently above 50.
Breakdown of Entries 1-3
Other separate entries taken at different stages of the decline:
Entry 1: -10% below safe base (An impulsive entry anticipating a pattern breakout)
Entry 2: -21% below safe base
Entry 3: -41% below safe base
Pump.fun Daily Structure & Growth Path
The daily chart above highlights what might be the start of a clean recovery structure forming after the slow panic low end of December 2025. Since then, price has transitioned from lower lows into higher lows and compressing beneath prior resistance.
A projected growth path points toward resistance around the €0.00418–€0.00446 zone, where prior market memory exists.
3-Day RSI Suggest Momentum Shift
The 3-day RSI provides a credible timing signal on $PUMP.
Over months, starting October 2025, the $PUMP 3-day RSI remained below 50 (seen below), indicating weakening sentiment /momentum. During that period, price struggled to sustain upside.
That has now changed toward the end of January 2026 as per the RSI 50 framework.
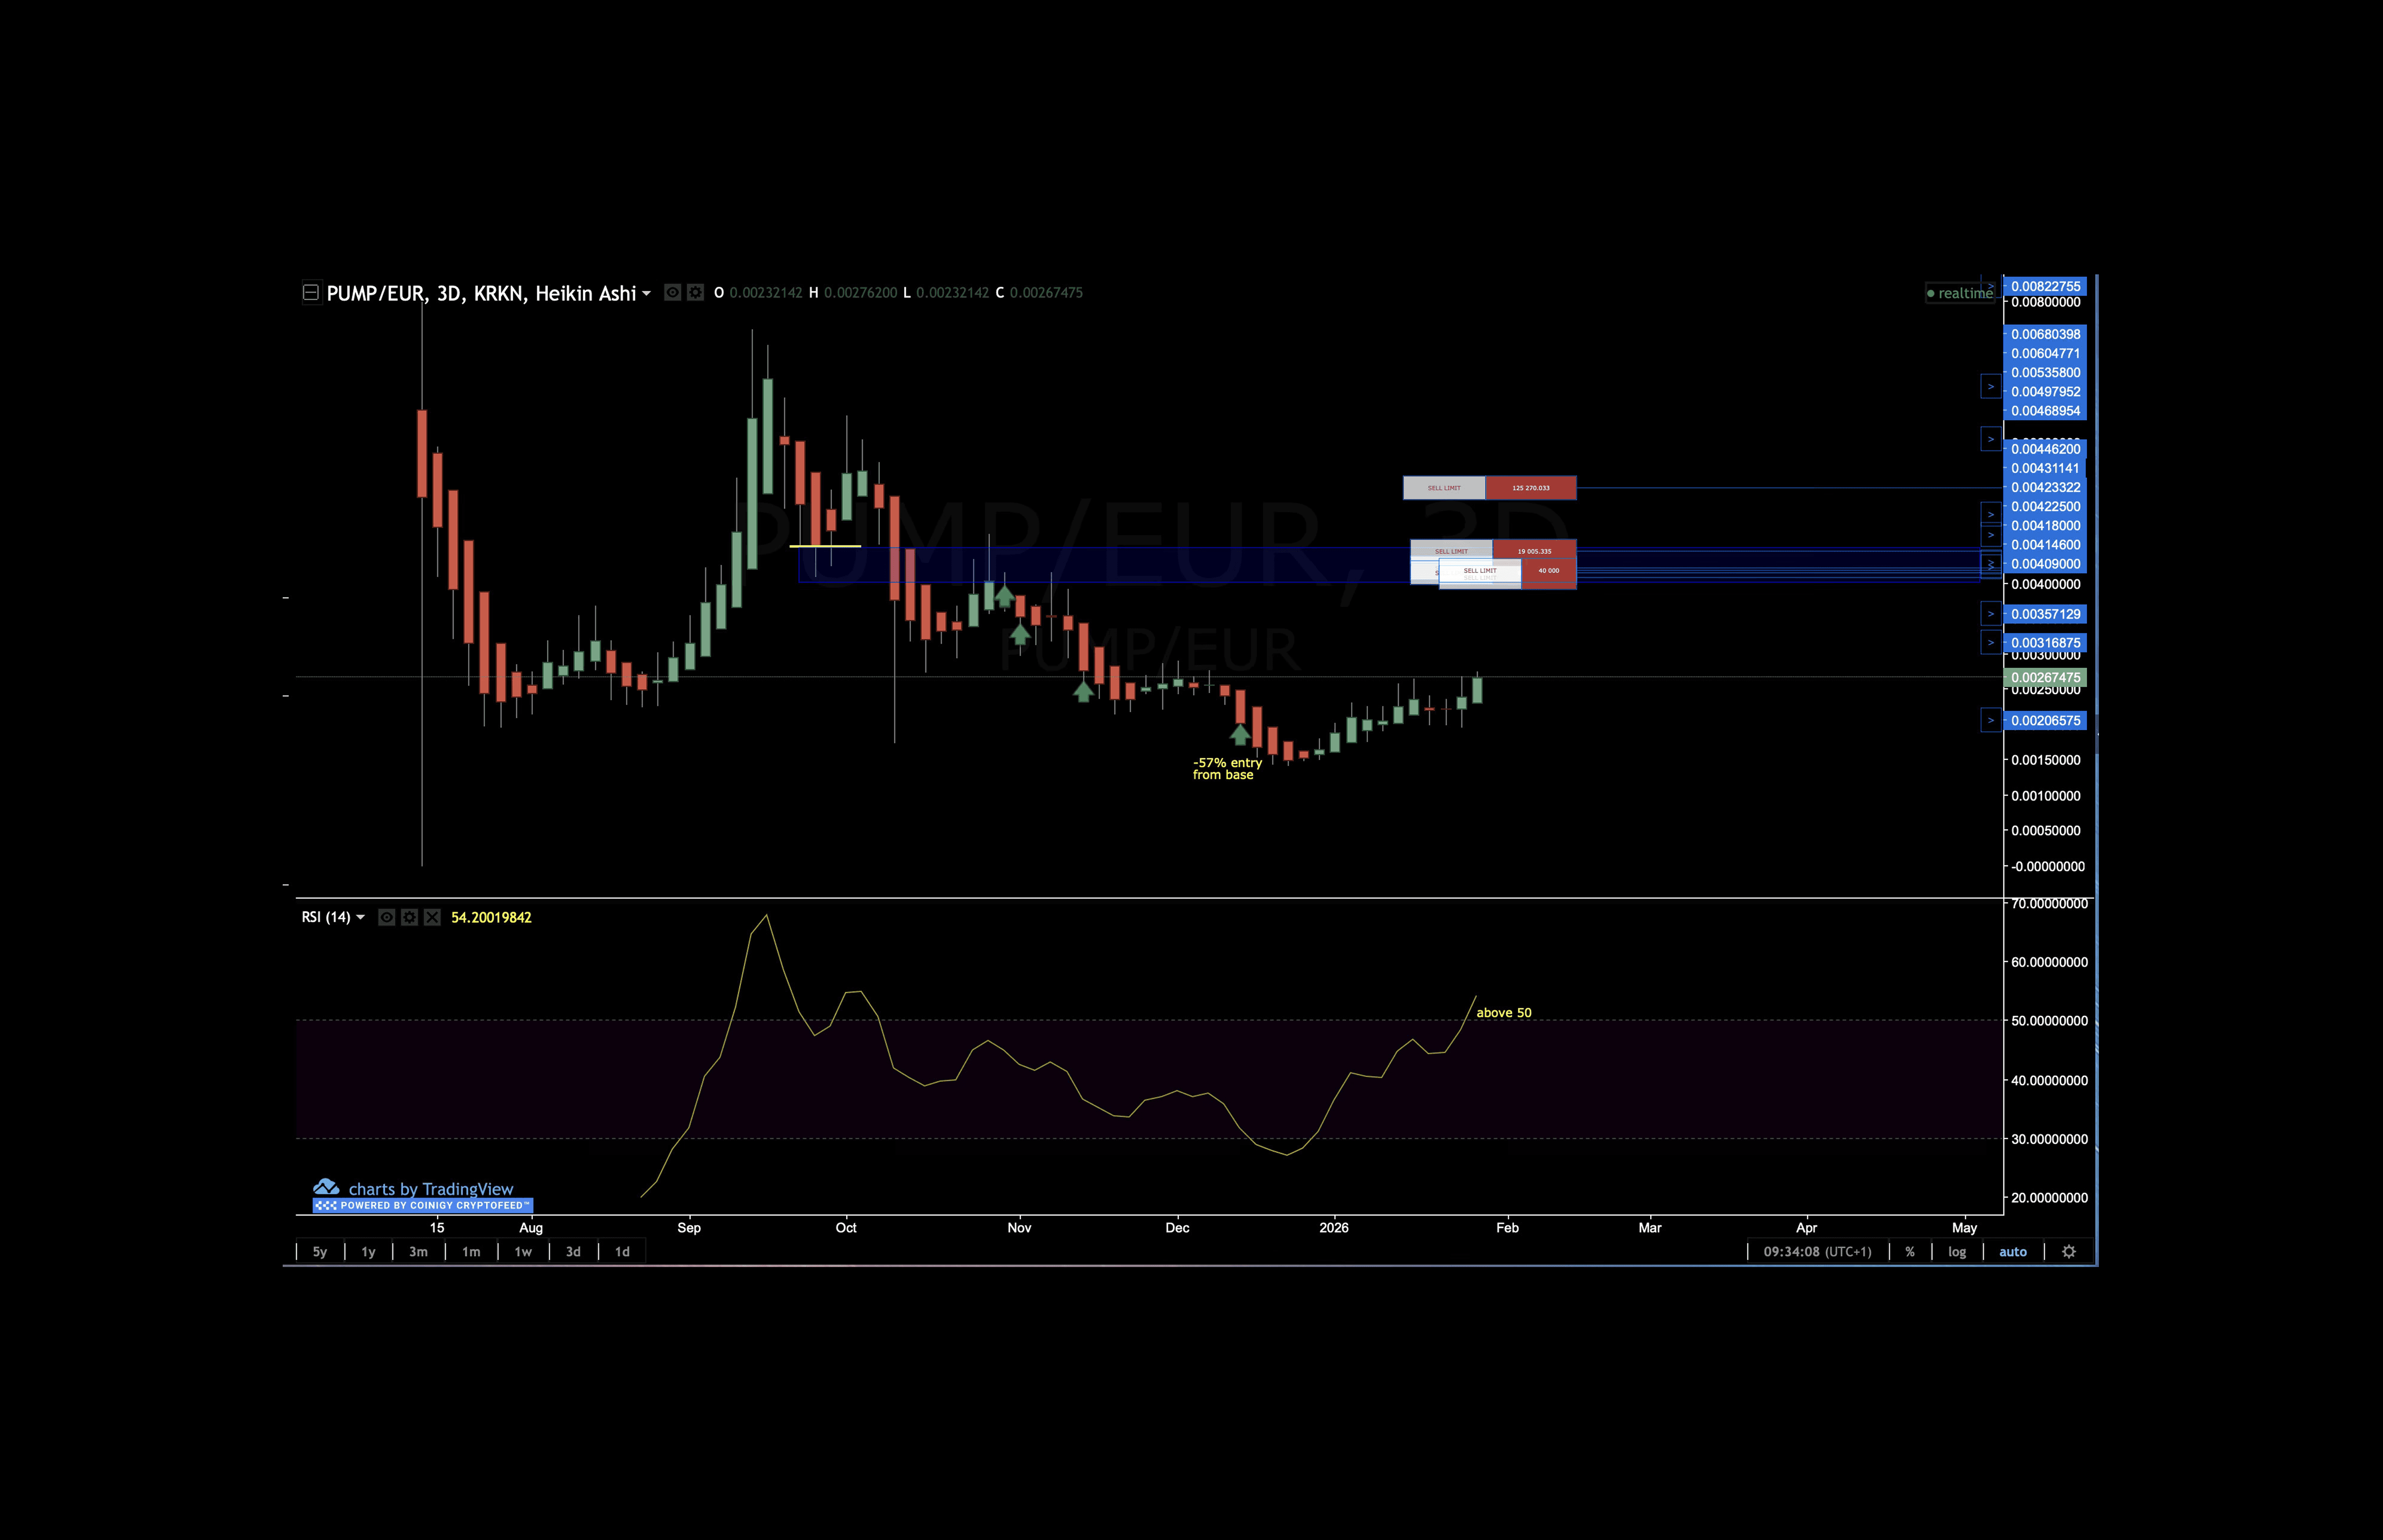
As of late January 2026, the 3-day RSI has crossed above 50 (≈54), a meaningful threshold.
When RSI holds above 50 on higher timeframes, momentum becomes constructive, increasing the probability of higher prices until momentum shows signs of exhaustion.
This does not guarantee higher prices, but it materially increases the probability that price attempts to resolve the unfinished retracement at “safe base 3.” For a deeper explanation of this framework, refer to How to Trade Without Leverage, our 1-hour 30-minute ebook outlining the core techniques behind this approach.
$PUMP vs SOL Relative Context
Against SOL, $PUMP is also in bullish posture, with RSI above 50, stabilized after a prolonged underperformance phase. PUMP is no longer underperforming as severely versus SOL. With structure also resolving prior bases open since December 2025.
If $PUMP Fails to Reach €0.004
As price approaches key resistance, outcomes are predefined to avoid emotional decision-making. Each scenario is planned in advance based on how price interacts with the €0.004 zone.
Rejection at €0.004: Price tests the resistance zone and reverses, resolving the trade with all positions closed in profit.
Breakout in price above €0.004: Price clears resistance with follow-through, all staggered sells execute in profit. Wait for structure to play out.
Failure to Reach €0.004: If momentum stalls below resistance, the trade remains open or sell limits might need to be adjusted lower to lock in partial profits.
Momentum Deterioration: If RSI or price structure weakens materially, exposure is reduced regardless of whether resistance is reached.
Conclusion
Versus EUR sell limits are staged across resistance:
€0.00418
€0.00422
€0.00446
This staggered, small position-sized approach avoids the need to call a top, allowing price to work through resistance naturally while closing trades entered weeks ago.
This is a probability trade, not a narrative trade and the framework remains repeatable.
To keep track of these trades:
Learn the framework: How to Trade Without Leverage
Then subscribe for weekly analysis: CoinJuice PRO
FAQ
Where was the last entry taken for $PUMP and why?
The last entry was taken near €0.00150 in mid-December 2025 as a mean reversion entry at an extreme deviation from the established “safe base 3,” where risk-reward flipped asymmetrically in favor of buyers, going as low as 67% from that “safe base 3.”
What does the current daily structure suggest about $PUMP’s potential growth path?
The daily structure shows a clean recovery after the capitulation low, with price transitioning from lower lows to higher lows and compressing beneath prior resistance, with a projected growth path toward the €0.00418–€0.00446 resistance zone, which is prior consolidation and support likely to act as supply on the first test.
What does the 3-day RSI indicate about $PUMP’s momentum?
After spending weeks below 50 from October 2025, reflecting weak momentum and failed rallies, the 3-day RSI crossed above 50 (≈54) by late January 2026, signaling a shift in momentum from corrective to constructive and increasing the probability that price attempts to resolve the unfinished structure above at the “safe base 3,” though without guaranteeing continuation.
Disclaimer
The information provided in this article is for informational purposes only. It is not intended to be, nor should it be construed as, financial advice. We do not make any warranties regarding the completeness, reliability, or accuracy of this information. All investments involve risk, and past performance does not guarantee future results. We recommend consulting a financial advisor before making any investment decisions.
Written by

Andrew Kamsky
Andrew Kamsky is a Bitcoin analyst. He spent a decade in traditional finance across a Big Four firm and a listed fintech bank before going deep on Bitcoin full-time.


