


Quick summary
Technical analysis interprets market behavior through price and time rather than reacting to news headlines
Core tools include candlestick charts, trends, support and resistance, and indicators to define structure and entries
Trends, key levels, and break-and-retest patterns reflect recurring crowd psychology in bitcoin markets
Effective trading focuses on price behavior, clear rules, risk management, and simplicity to reduce decision fatigue
Technical analysis is often misunderstood as lines, indicators, or guesswork. In reality, it’s a framework for interpreting market behavior using price versus time the only two variables that are always true.
This article breaks down what technical analysis actually means, why it still works in modern bitcoin and altcoin markets, and how bitcoin offers one of the clearest real-world examples of these principles in action. The reader will gain insight into candlestick charts, trend identification, support and resistance, indicators, and entry patterns.
Technical Analysis Starts With One Core Assumption
Technical analysis assumes that every headline, macro shift, sentiment change, and speculative impulse ultimately expresses itself through price action.
By the time news about interest rate changes becomes widely discussed, the market has already priced and reacted to it. Instead of responding to headlines, technical analysis focuses on observable behavior in motion.
Each price level represents a temporary equilibrium between buyers and sellers, making charts a real-time record of crowd psychology rather than opinion.
Technical analysis breaks down into four price-based components:
Candlestick Charts: Visual record of price behavior across timeframes
Trends: Market structure showing directional bias through sequential highs and lows
Support & Resistance: Price levels where buyers and sellers have previously concentrated
Indicators: Calculations derived from historical price movements
Why Candlestick Charts Matter
Before trends, indicators, or patterns, a trader must be able to read what a single candlestick represents.
A candlestick shows price movement throughout a specific period of time. On a bitcoin daily chart, each candlestick in the chart below represents 24 hours of price movement.
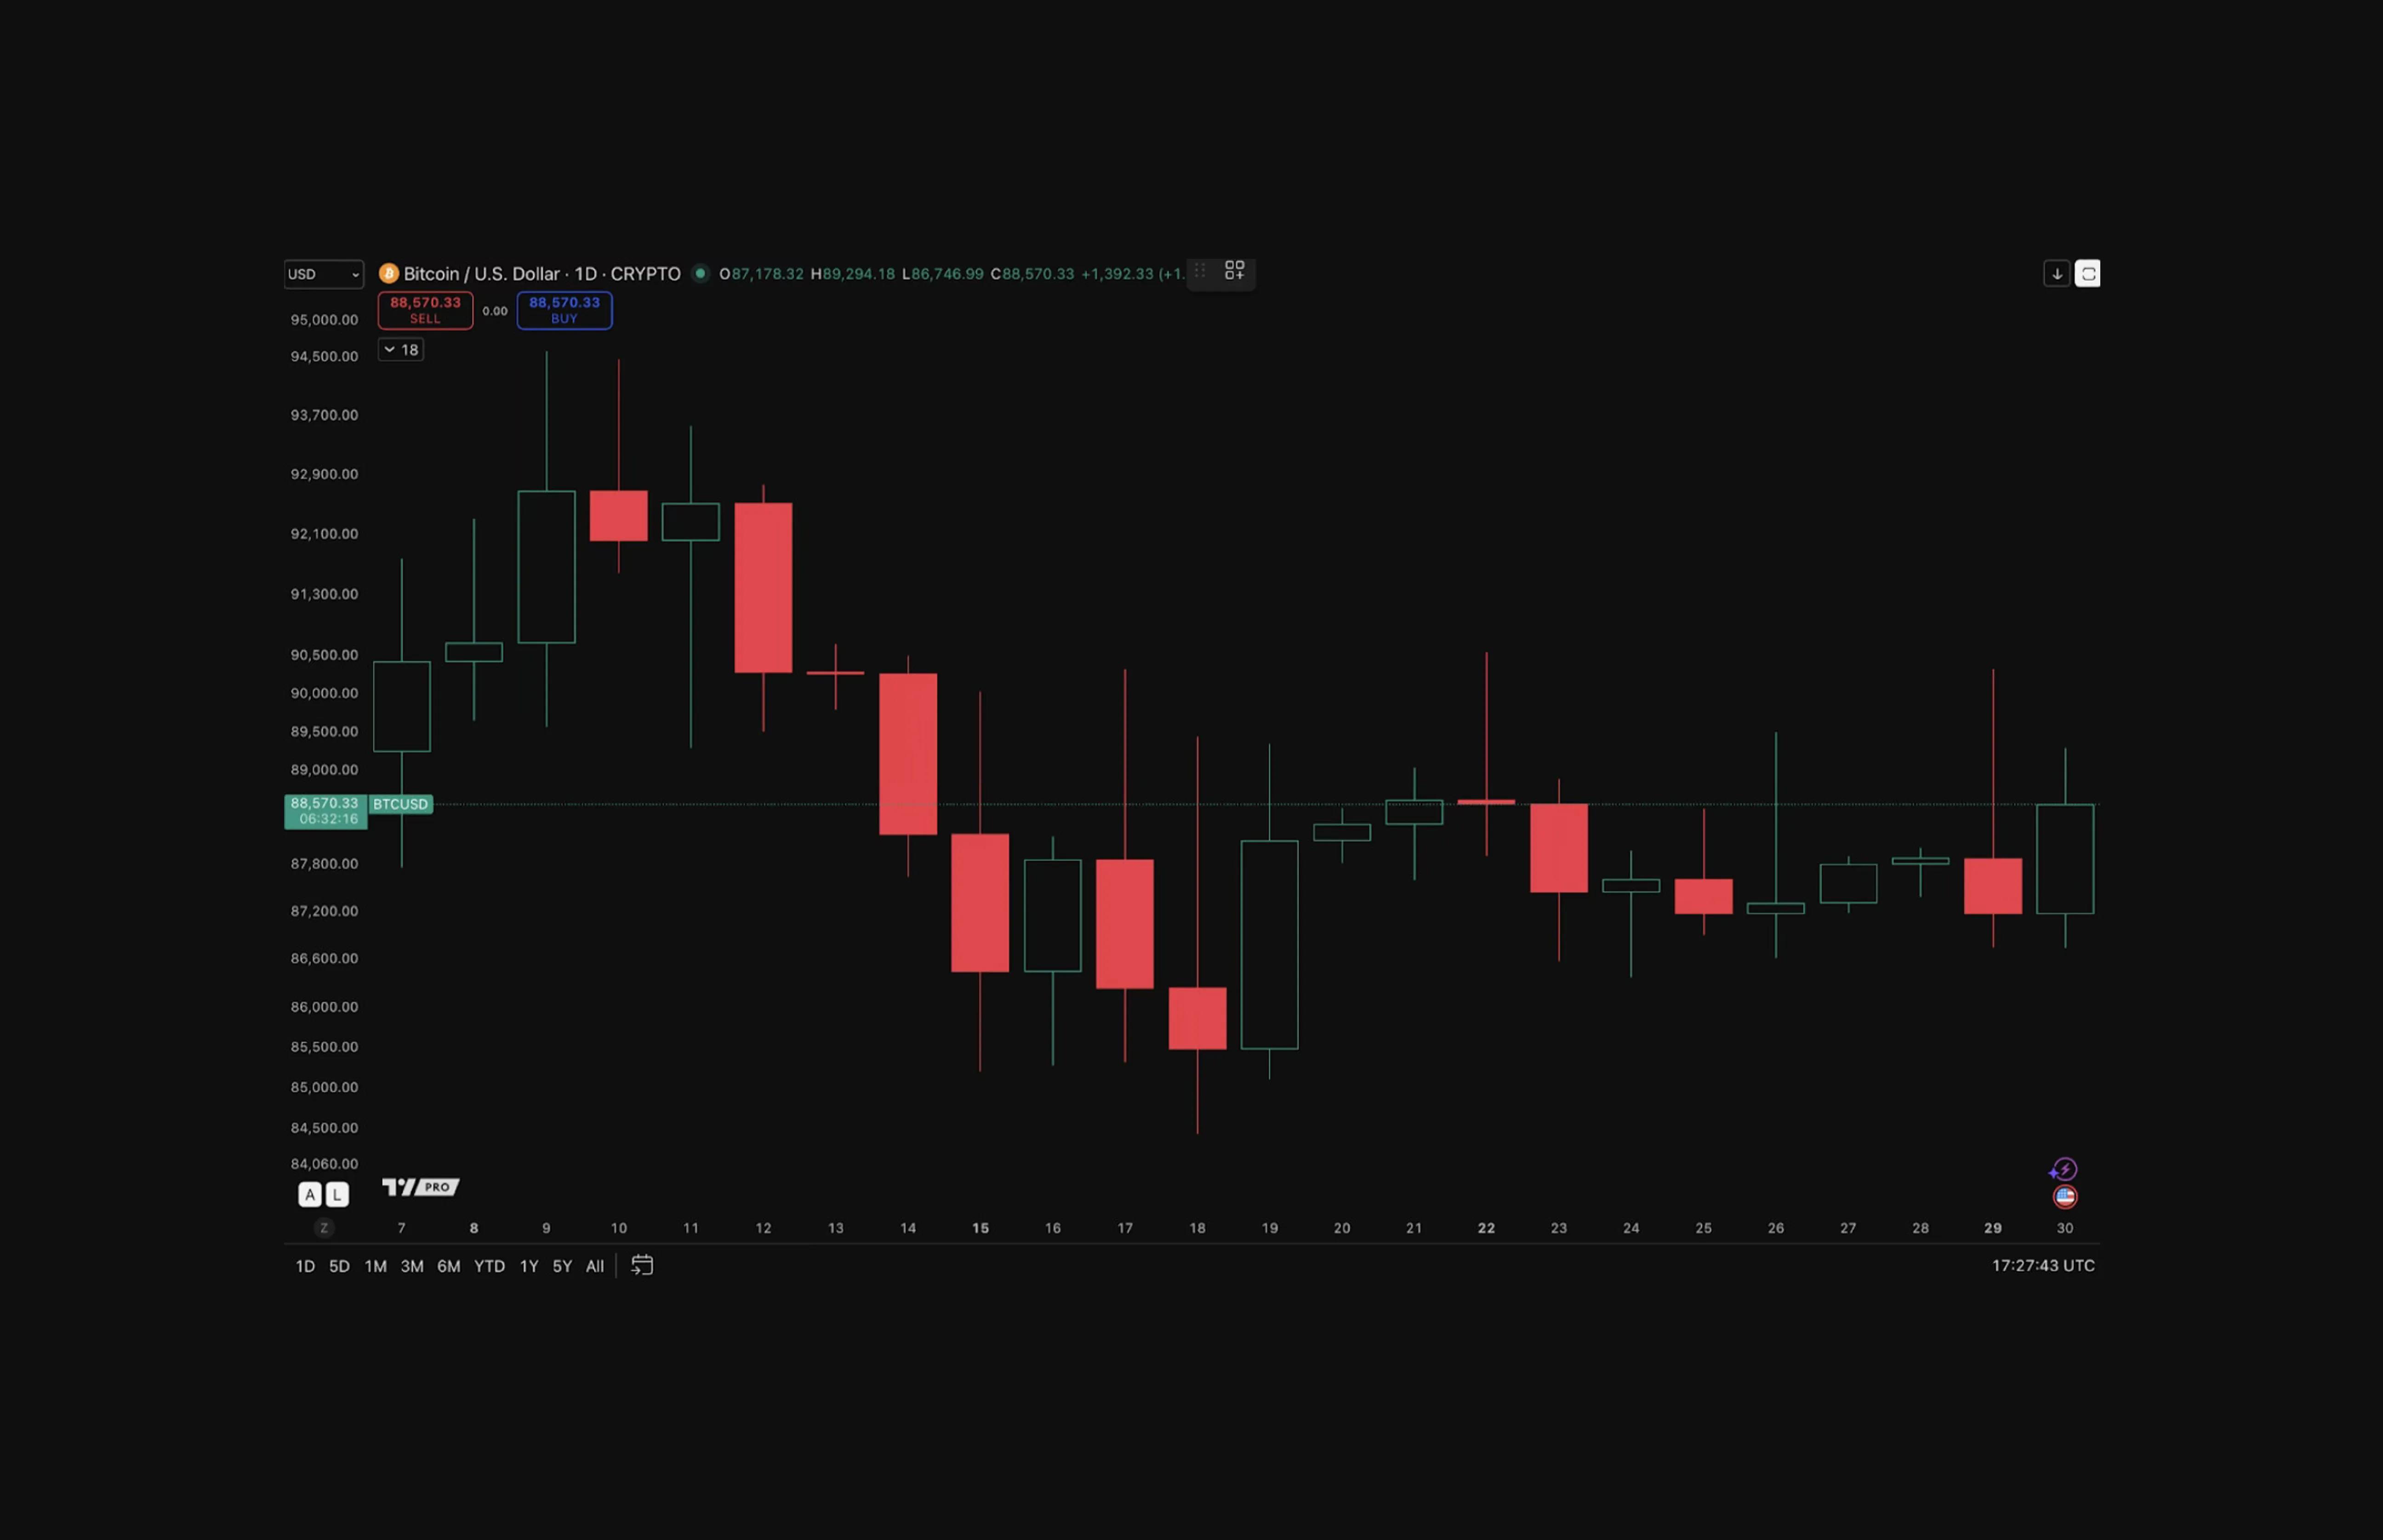
Pick one candle from the above and notice that it has two main components:
Hollow / Red Body: Shows where the price started and ended during that time. If the price ended above where it started, the candle is hollow. If the price ended below where it started, the candle is red.
Wick: Shows how far the price moved in either direction during one candle's period of time.
Each candlestick has four data points:
Open: Where price started during the period
Close: Where price ended during the period
High: The highest point price reached (top of the wick)
Low: The lowest point price reached (bottom of the wick)
Green/hollow: These candles close above where they opened buyers controlled that period.
Red candles: Close below where they opened sellers controlled that period.
Why Trends Exist in Markets Like Bitcoin
Markets trend because human behavior responds in familiar ways to changing conditions. As price moves in one direction, a psychological feedback loop forms and reinforces that move:
During uptrends:
Rising prices: Confidence in holding increases
Growing confidence: Participation expands
Expanding participation: Risk tolerance rises
Rising optimism: Continued buying reinforces the trend
During downtrends:
Falling prices: Confidence deteriorates
Deteriorating confidence: Risk appetite contracts
Contracting risk tolerance: Fear spreads
Escalating fear: Selling accelerates
This behavioral loop explains why trends persist far longer than logic suggests.
How to Objectively Identify Trends
Many traders might struggle with trend identification because there are no objective rules to the traders system.
Here's how beginners can approach trend identification with a strategy:
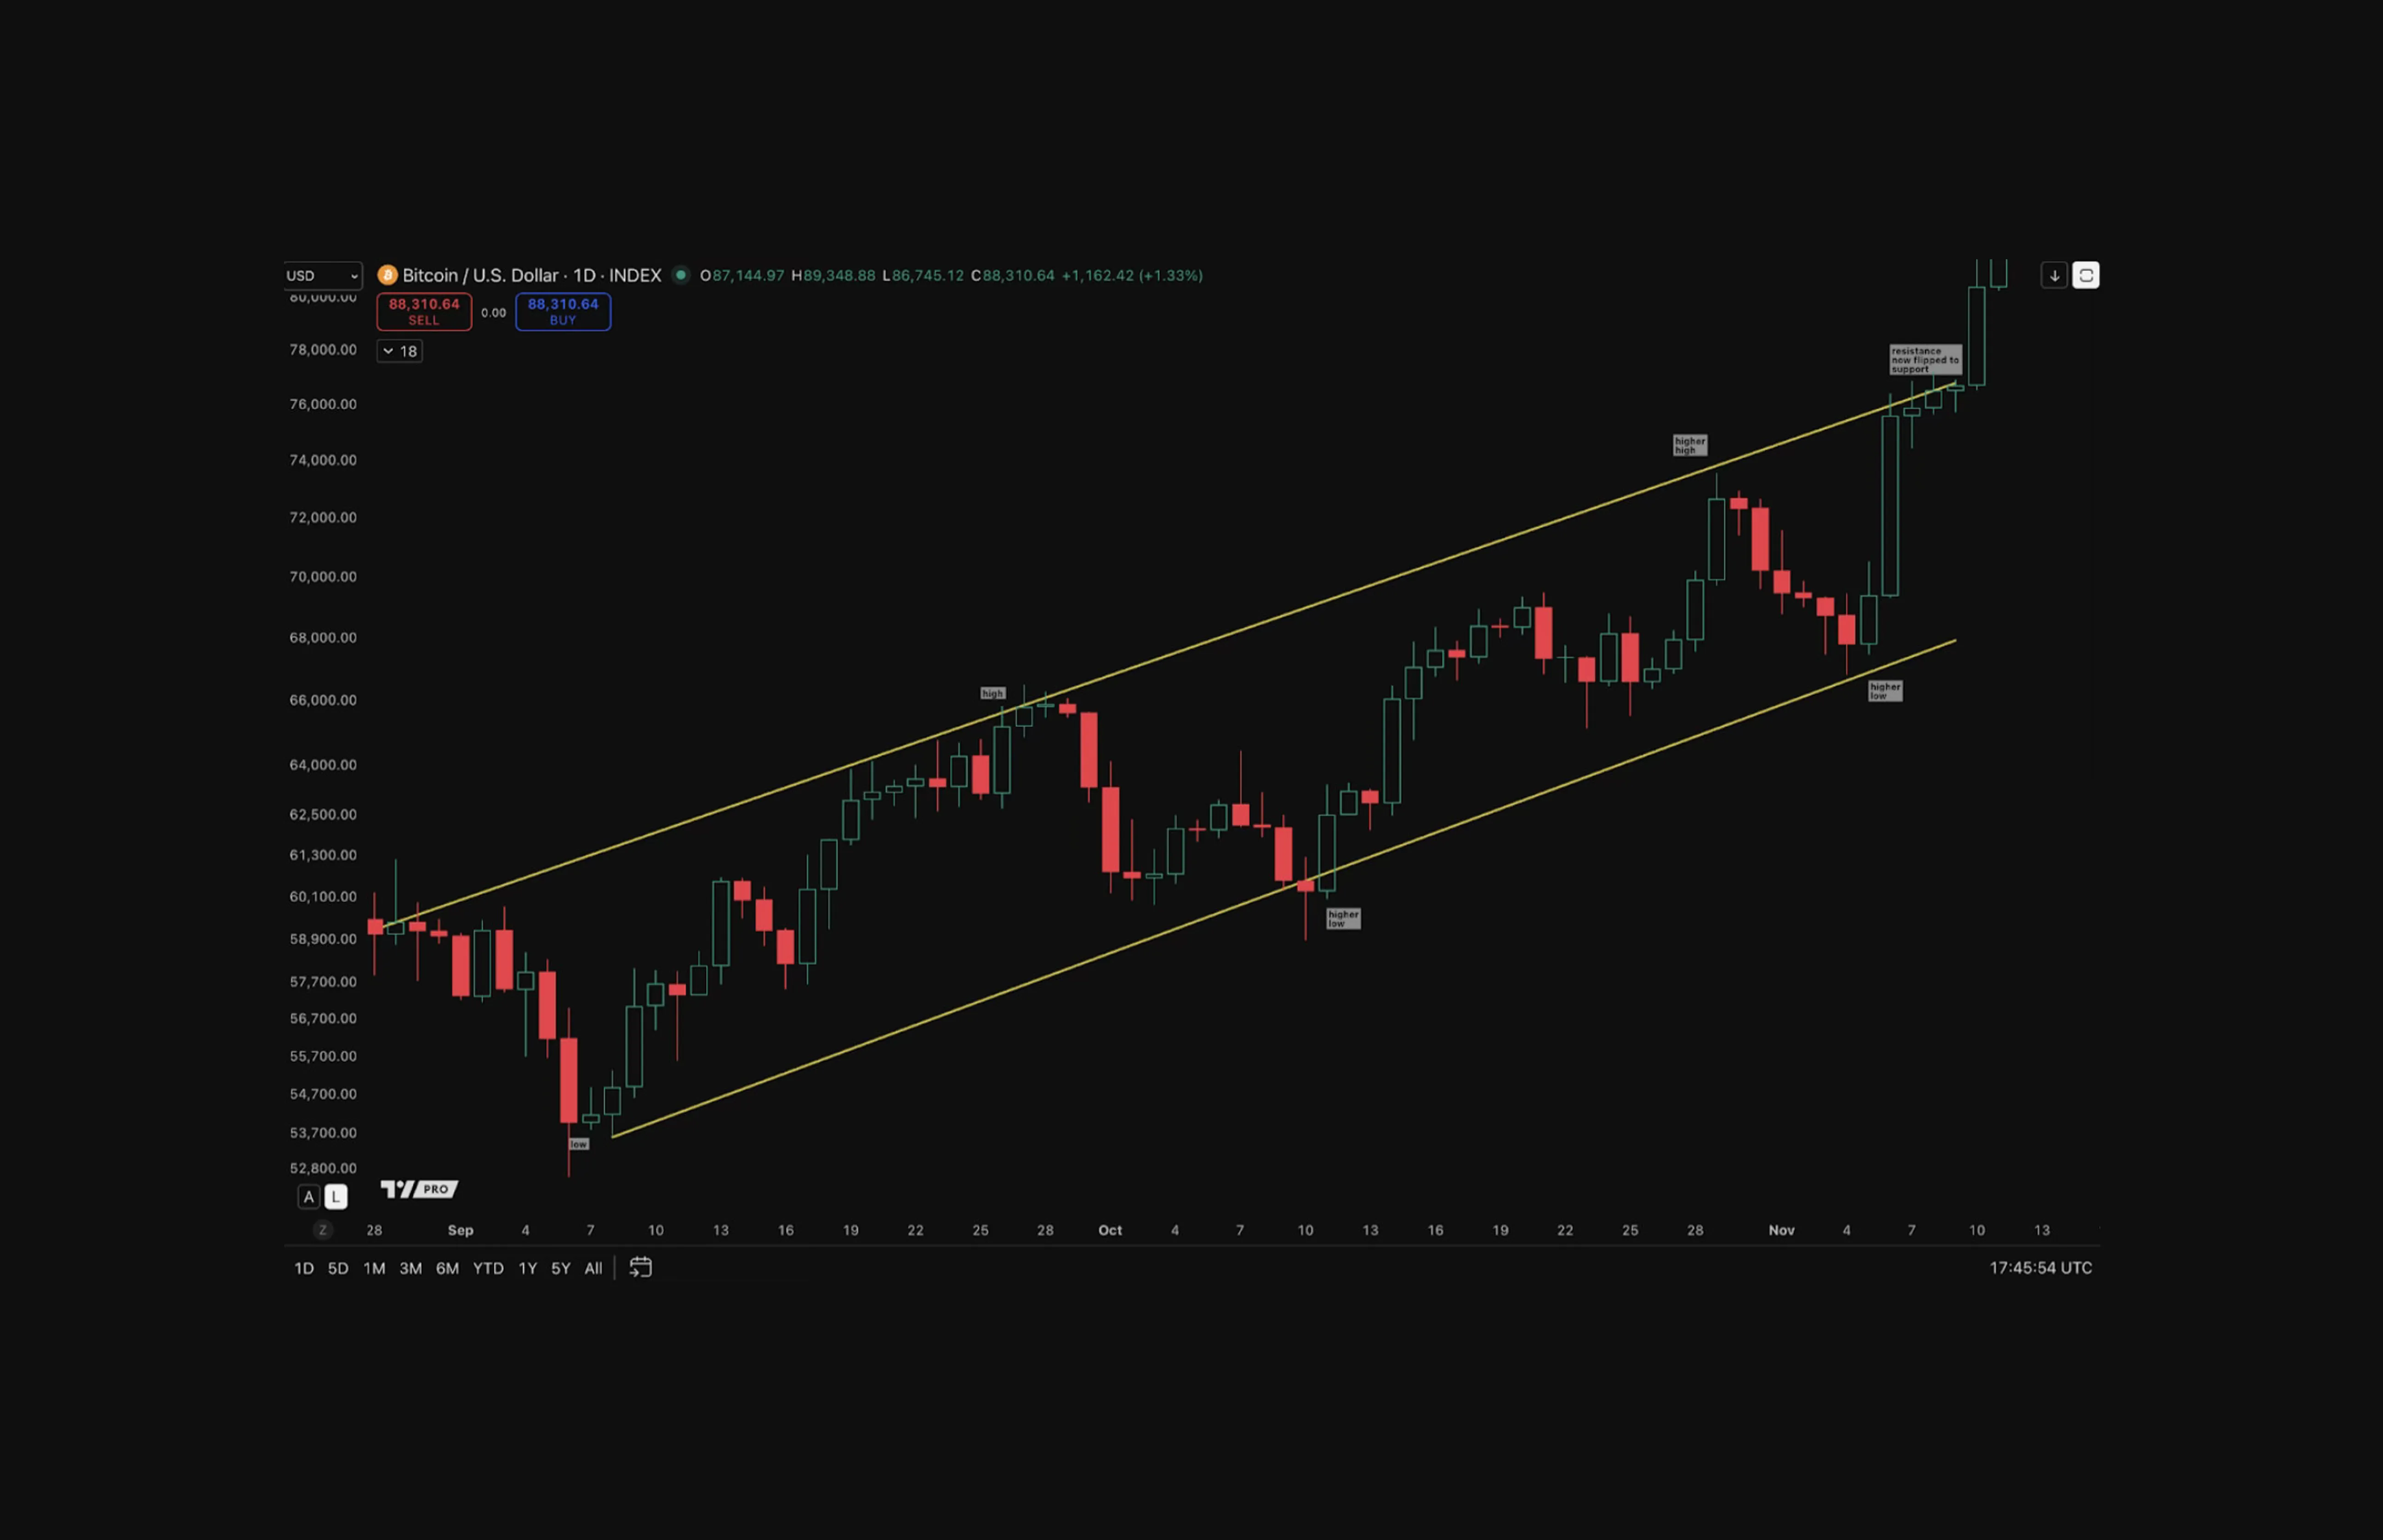
Uptrend rules to identify and confirm:
Higher highs and higher lows: The market consistently creates new peaks above previous peaks and valleys above previous valleys
Sharp rise followed by pullbacks: Large directional moves break into new highs, then pause as the market consolidates
Maintaining an uptrend rule: The uptrend remains valid until price cracks and closes below a lower low of the previous pullback
Trading implication: As long as price holds above that pullback low, continue looking for buying opportunities
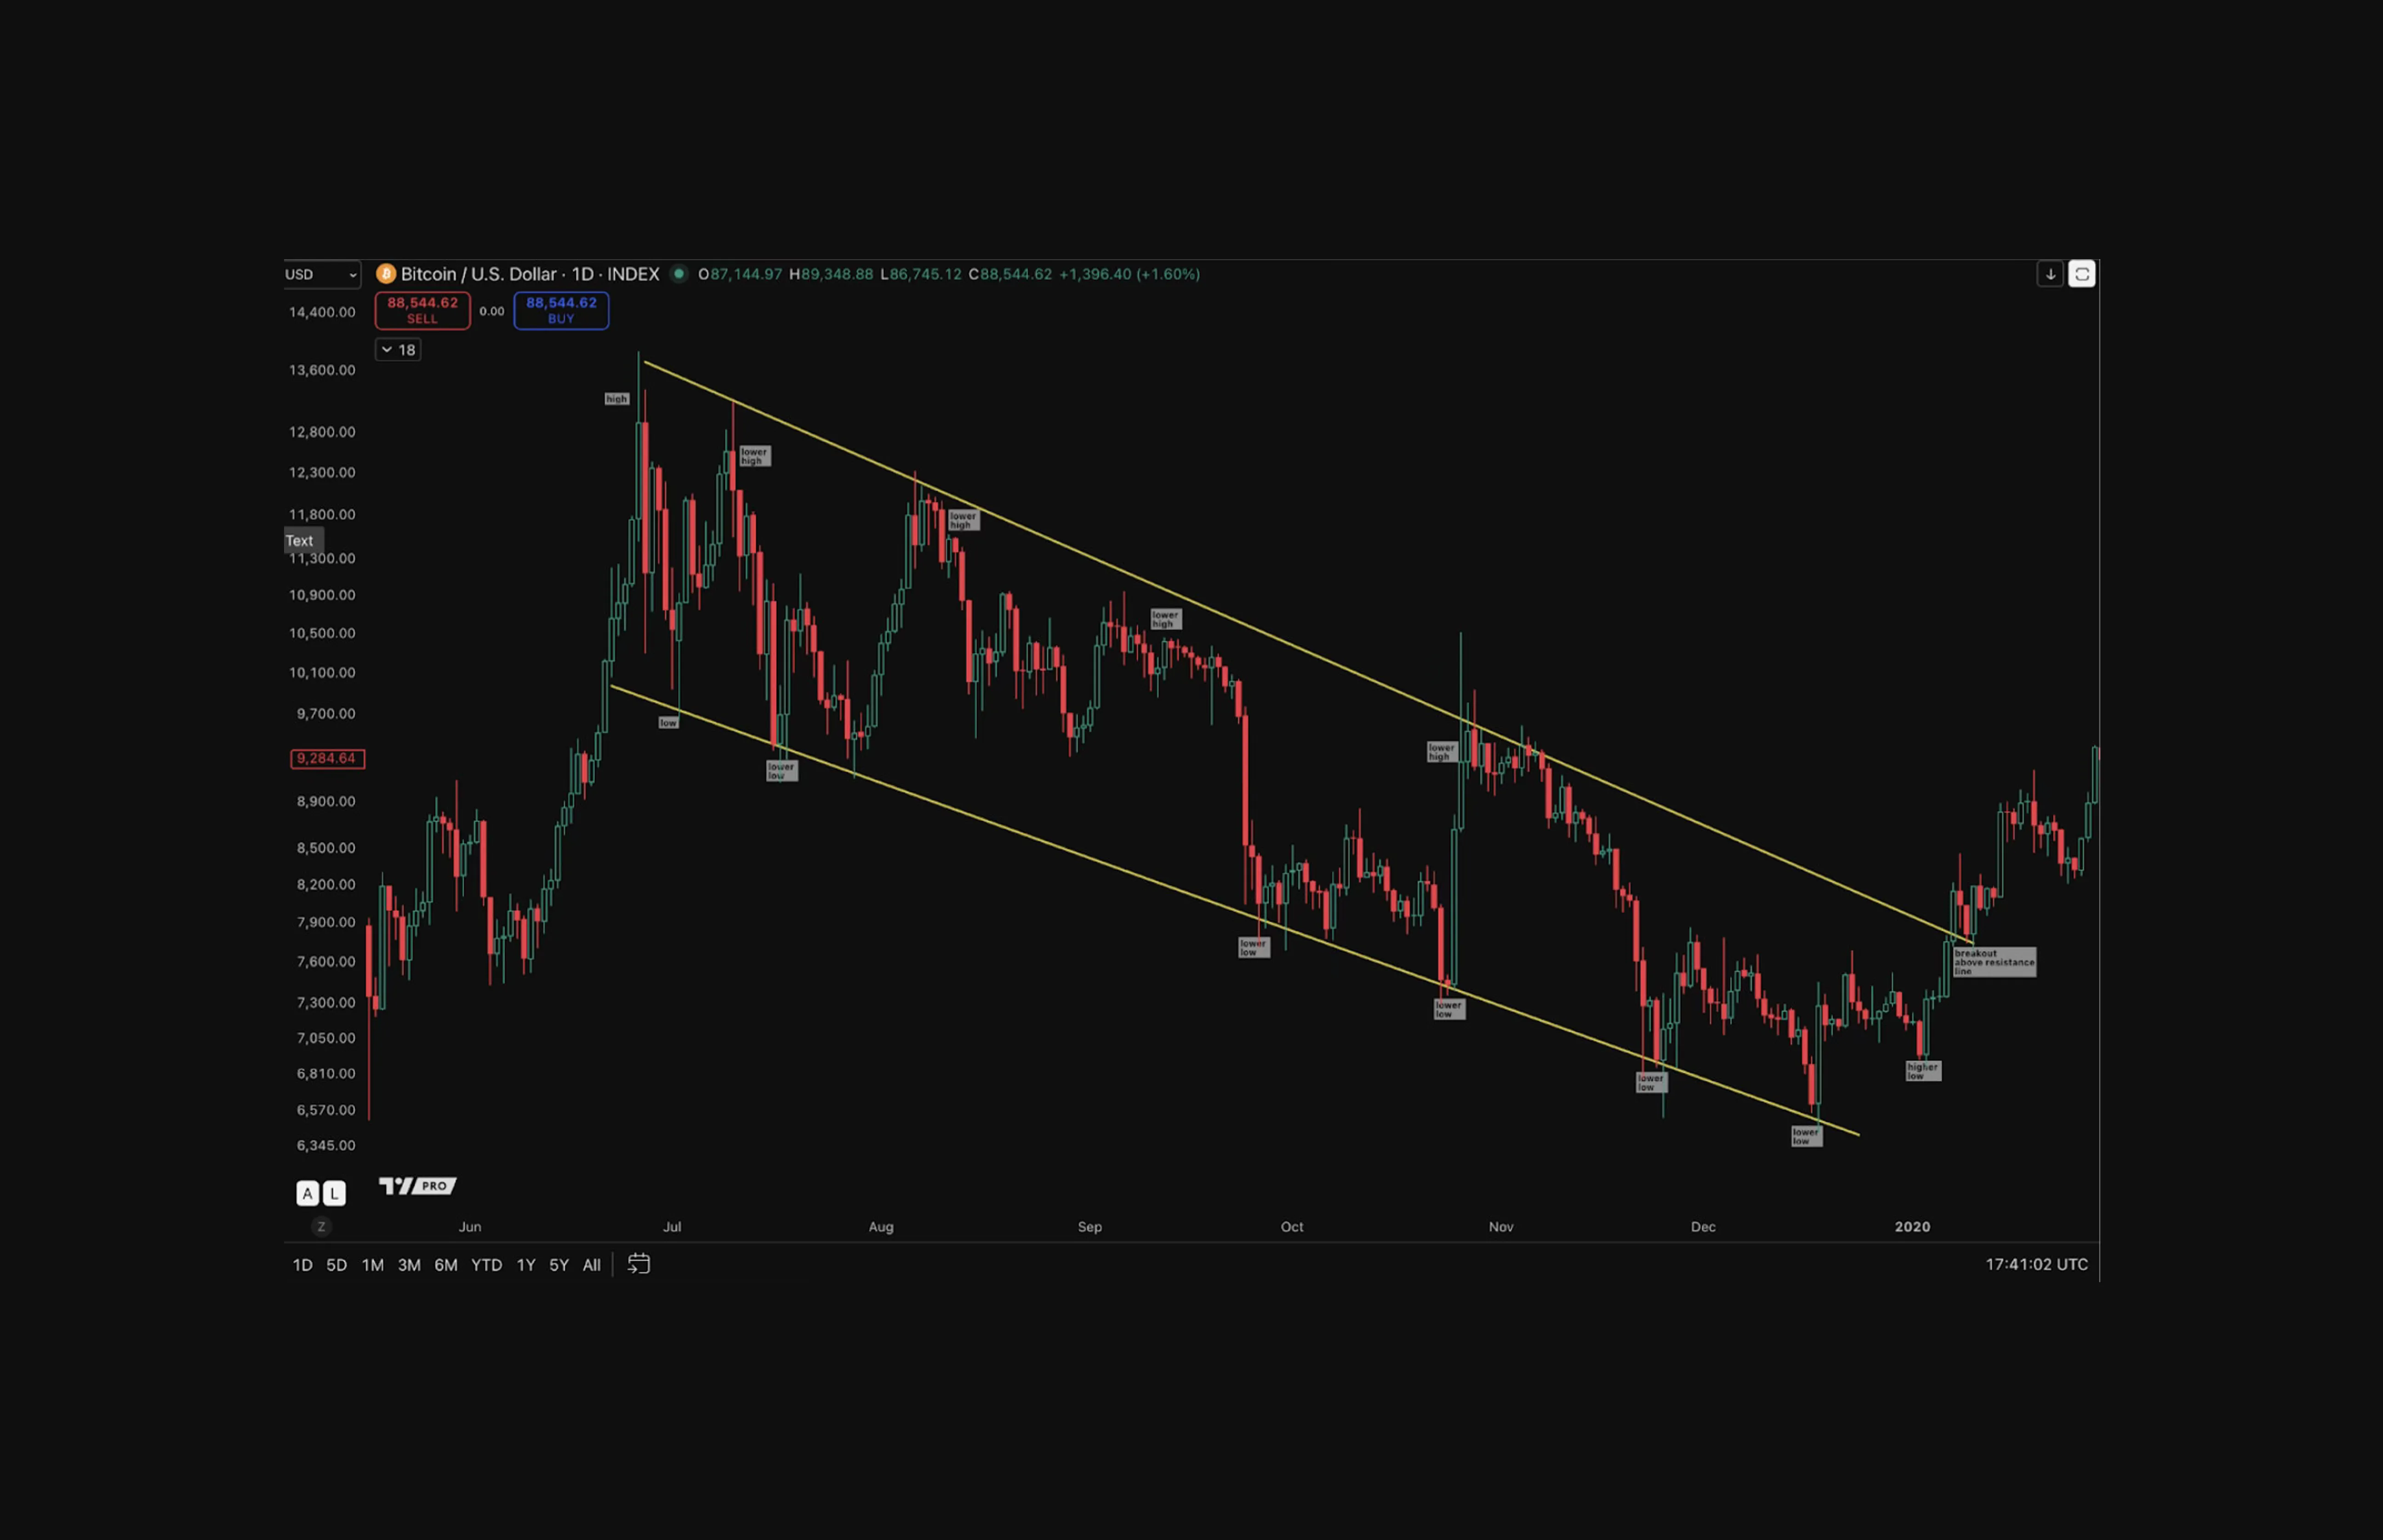
Downtrend rules:
Lower lows and lower highs: The market consistently creates new valleys below previous valleys and peaks below previous peaks
Impulsive moves followed by pullbacks: Large directional moves break into new lows, then pause as the market consolidates
Key rule: The downtrend remains valid until price breaks and closes above the highest high of the previous pullback or breaks above a prior resistance line
Trading implication: As long as price holds below that pullback high, continue looking for selling opportunities
Support and Resistance: Where Price Memory Lives
Support is an area where price is likely to bounce up from. Resistance is an area where price is likely to fall from.
These levels are based on historic price and the decisions of all market participants.
Support and resistance serve three critical functions:
Spot Possible Reversals: Areas where price may change direction
Identify Entry Points: Opportunities within ongoing trends
Determine Stops and Targets: Levels used for risk management and profit goals
The Break and Retest Strategy
In trending markets, previous resistance becomes support after breakouts (in uptrends), and previous support becomes resistance after cracking key levels (in downtrends).
In an uptrend:
Market breaks above previous resistance
Market pulls back to that level (now support)
Market bounces and continues higher
Entry opportunity occurs during the pullback
In a downtrend:
Market breaks below previous support
Market pulls back to that level (now resistance)
Market drops and continues lower
Entry opportunity occurs during the pullback
This is how to use structure to find high-probability entries.
The Two Essential Indicators for Bitcoin Trading
There are many indicators available.
Here are two that can help:
1. Moving Averages
Moving averages represent the average closing price over a set period of time.
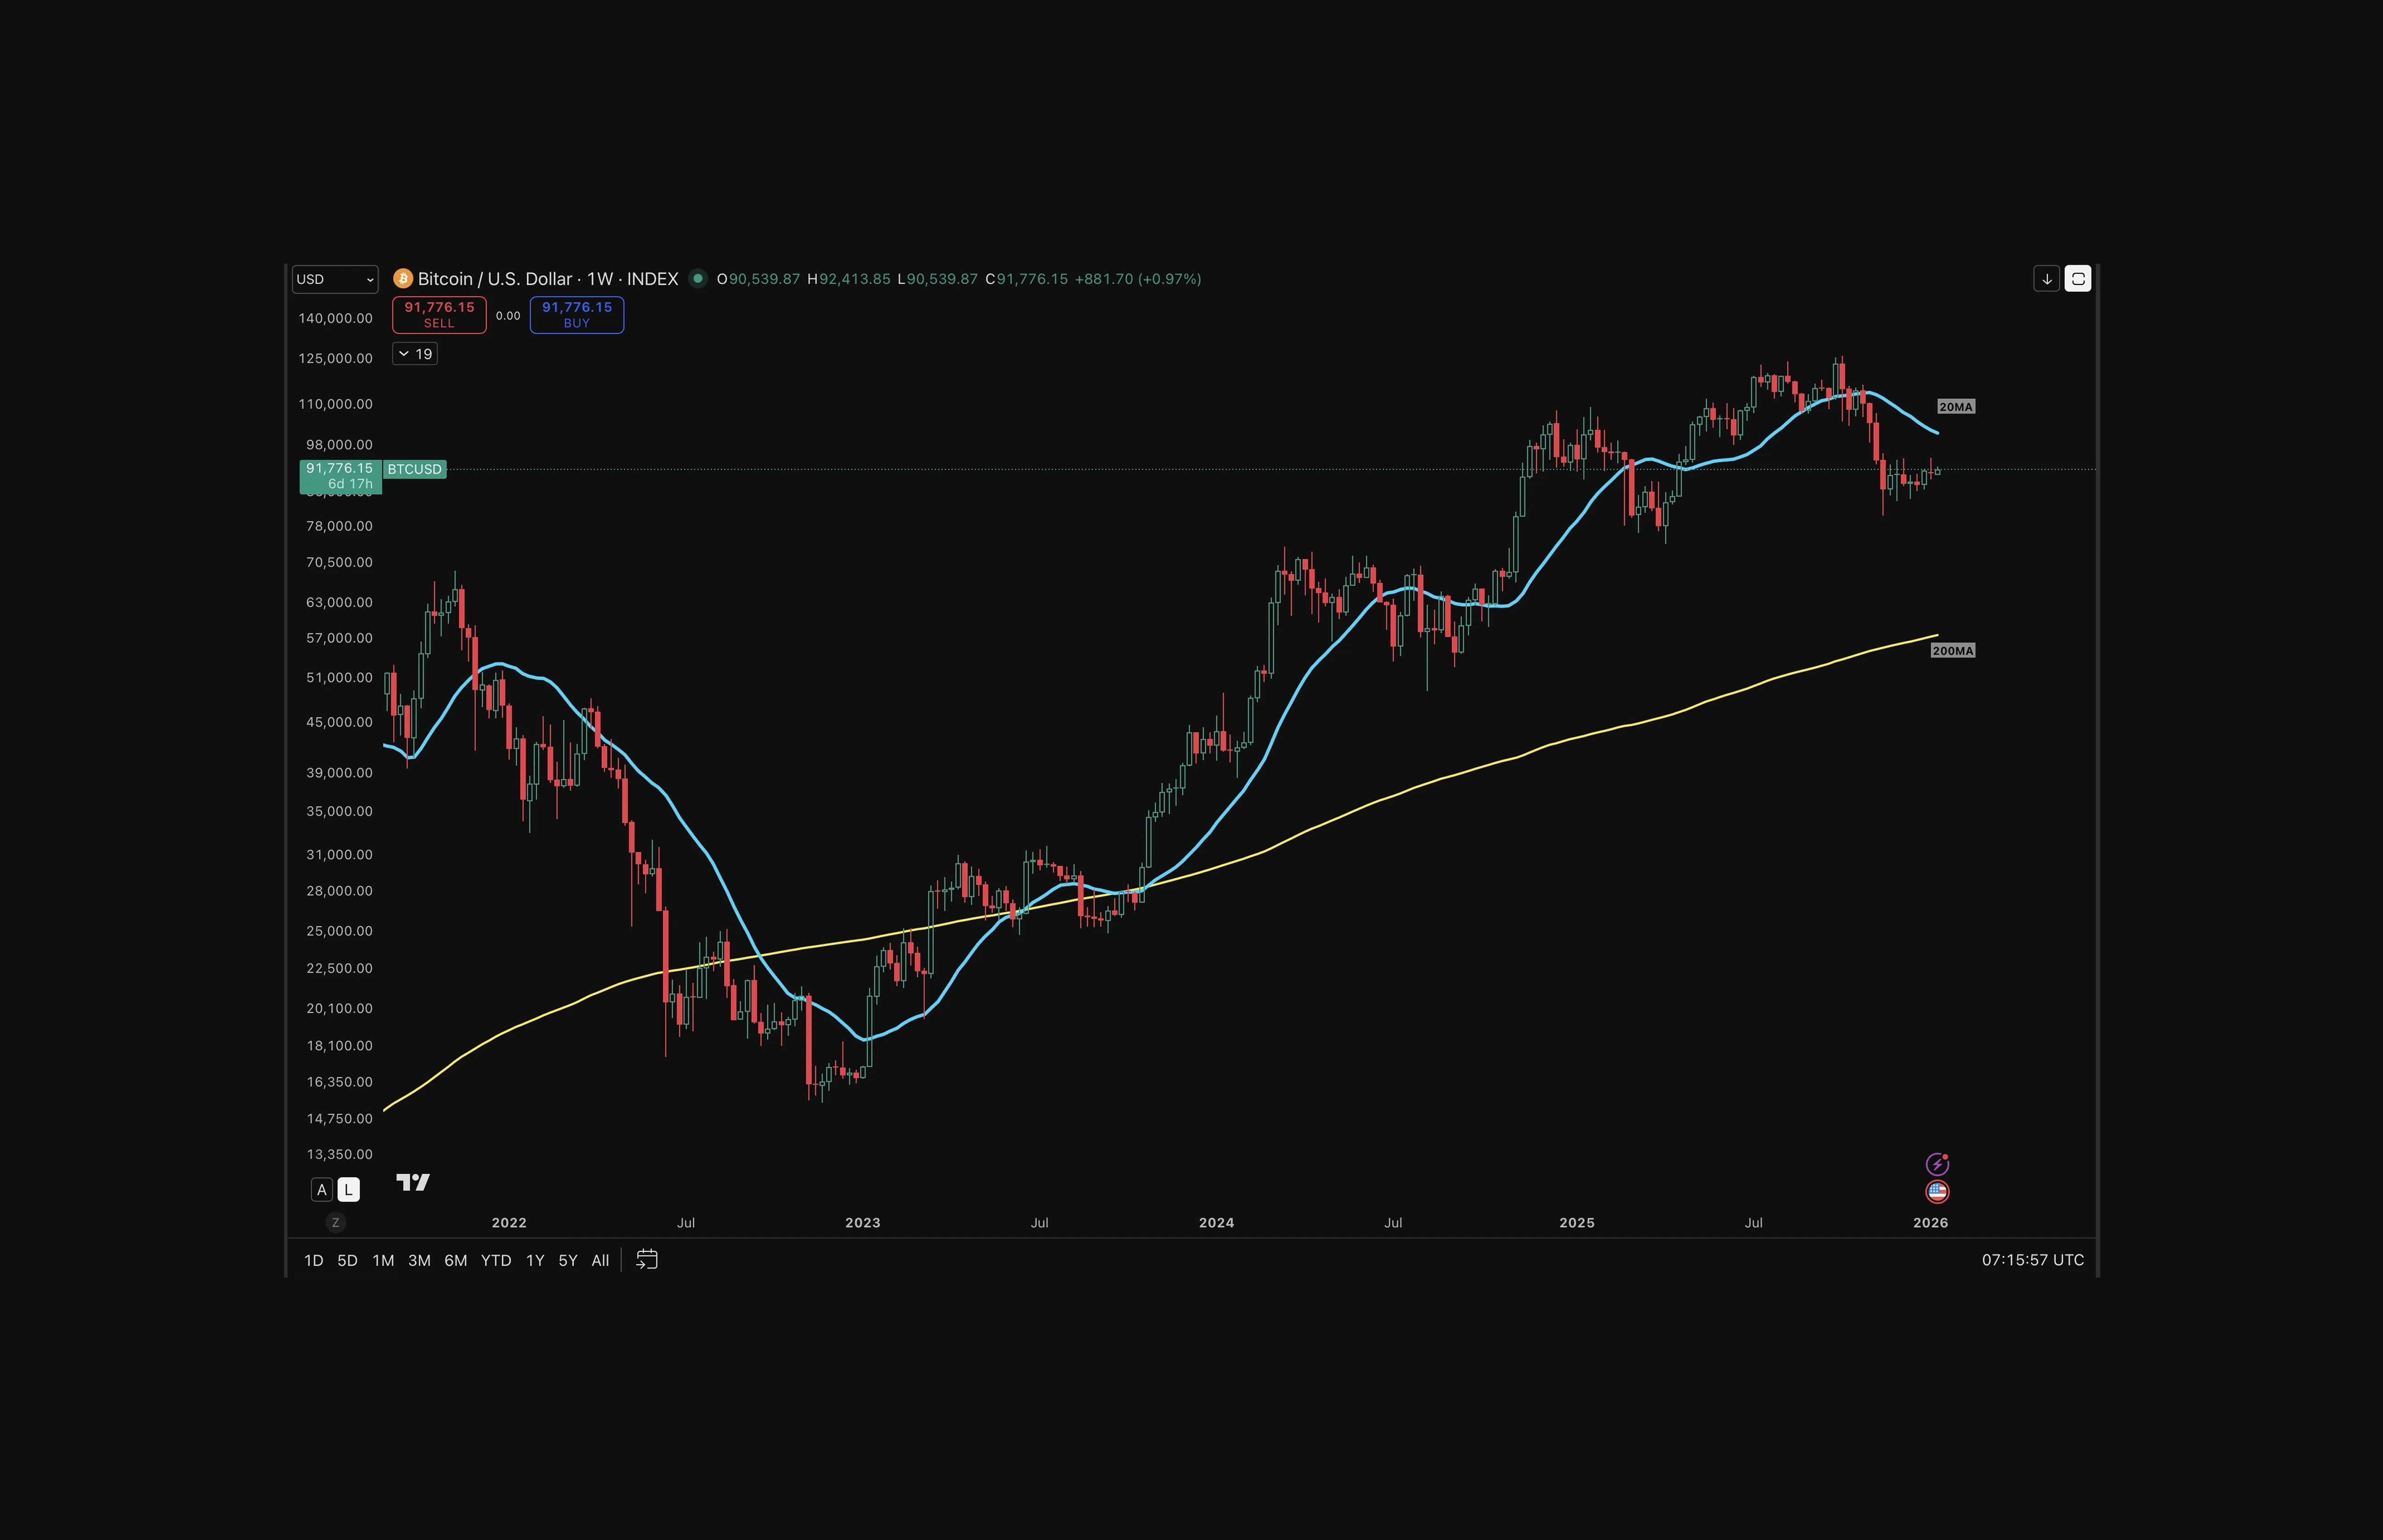
The 20-period moving average is commonly used to identify short-term trends, while the 200-period moving average often acts as a key reference for long-term trends and has historically helped highlight major bitcoin market bottoms.
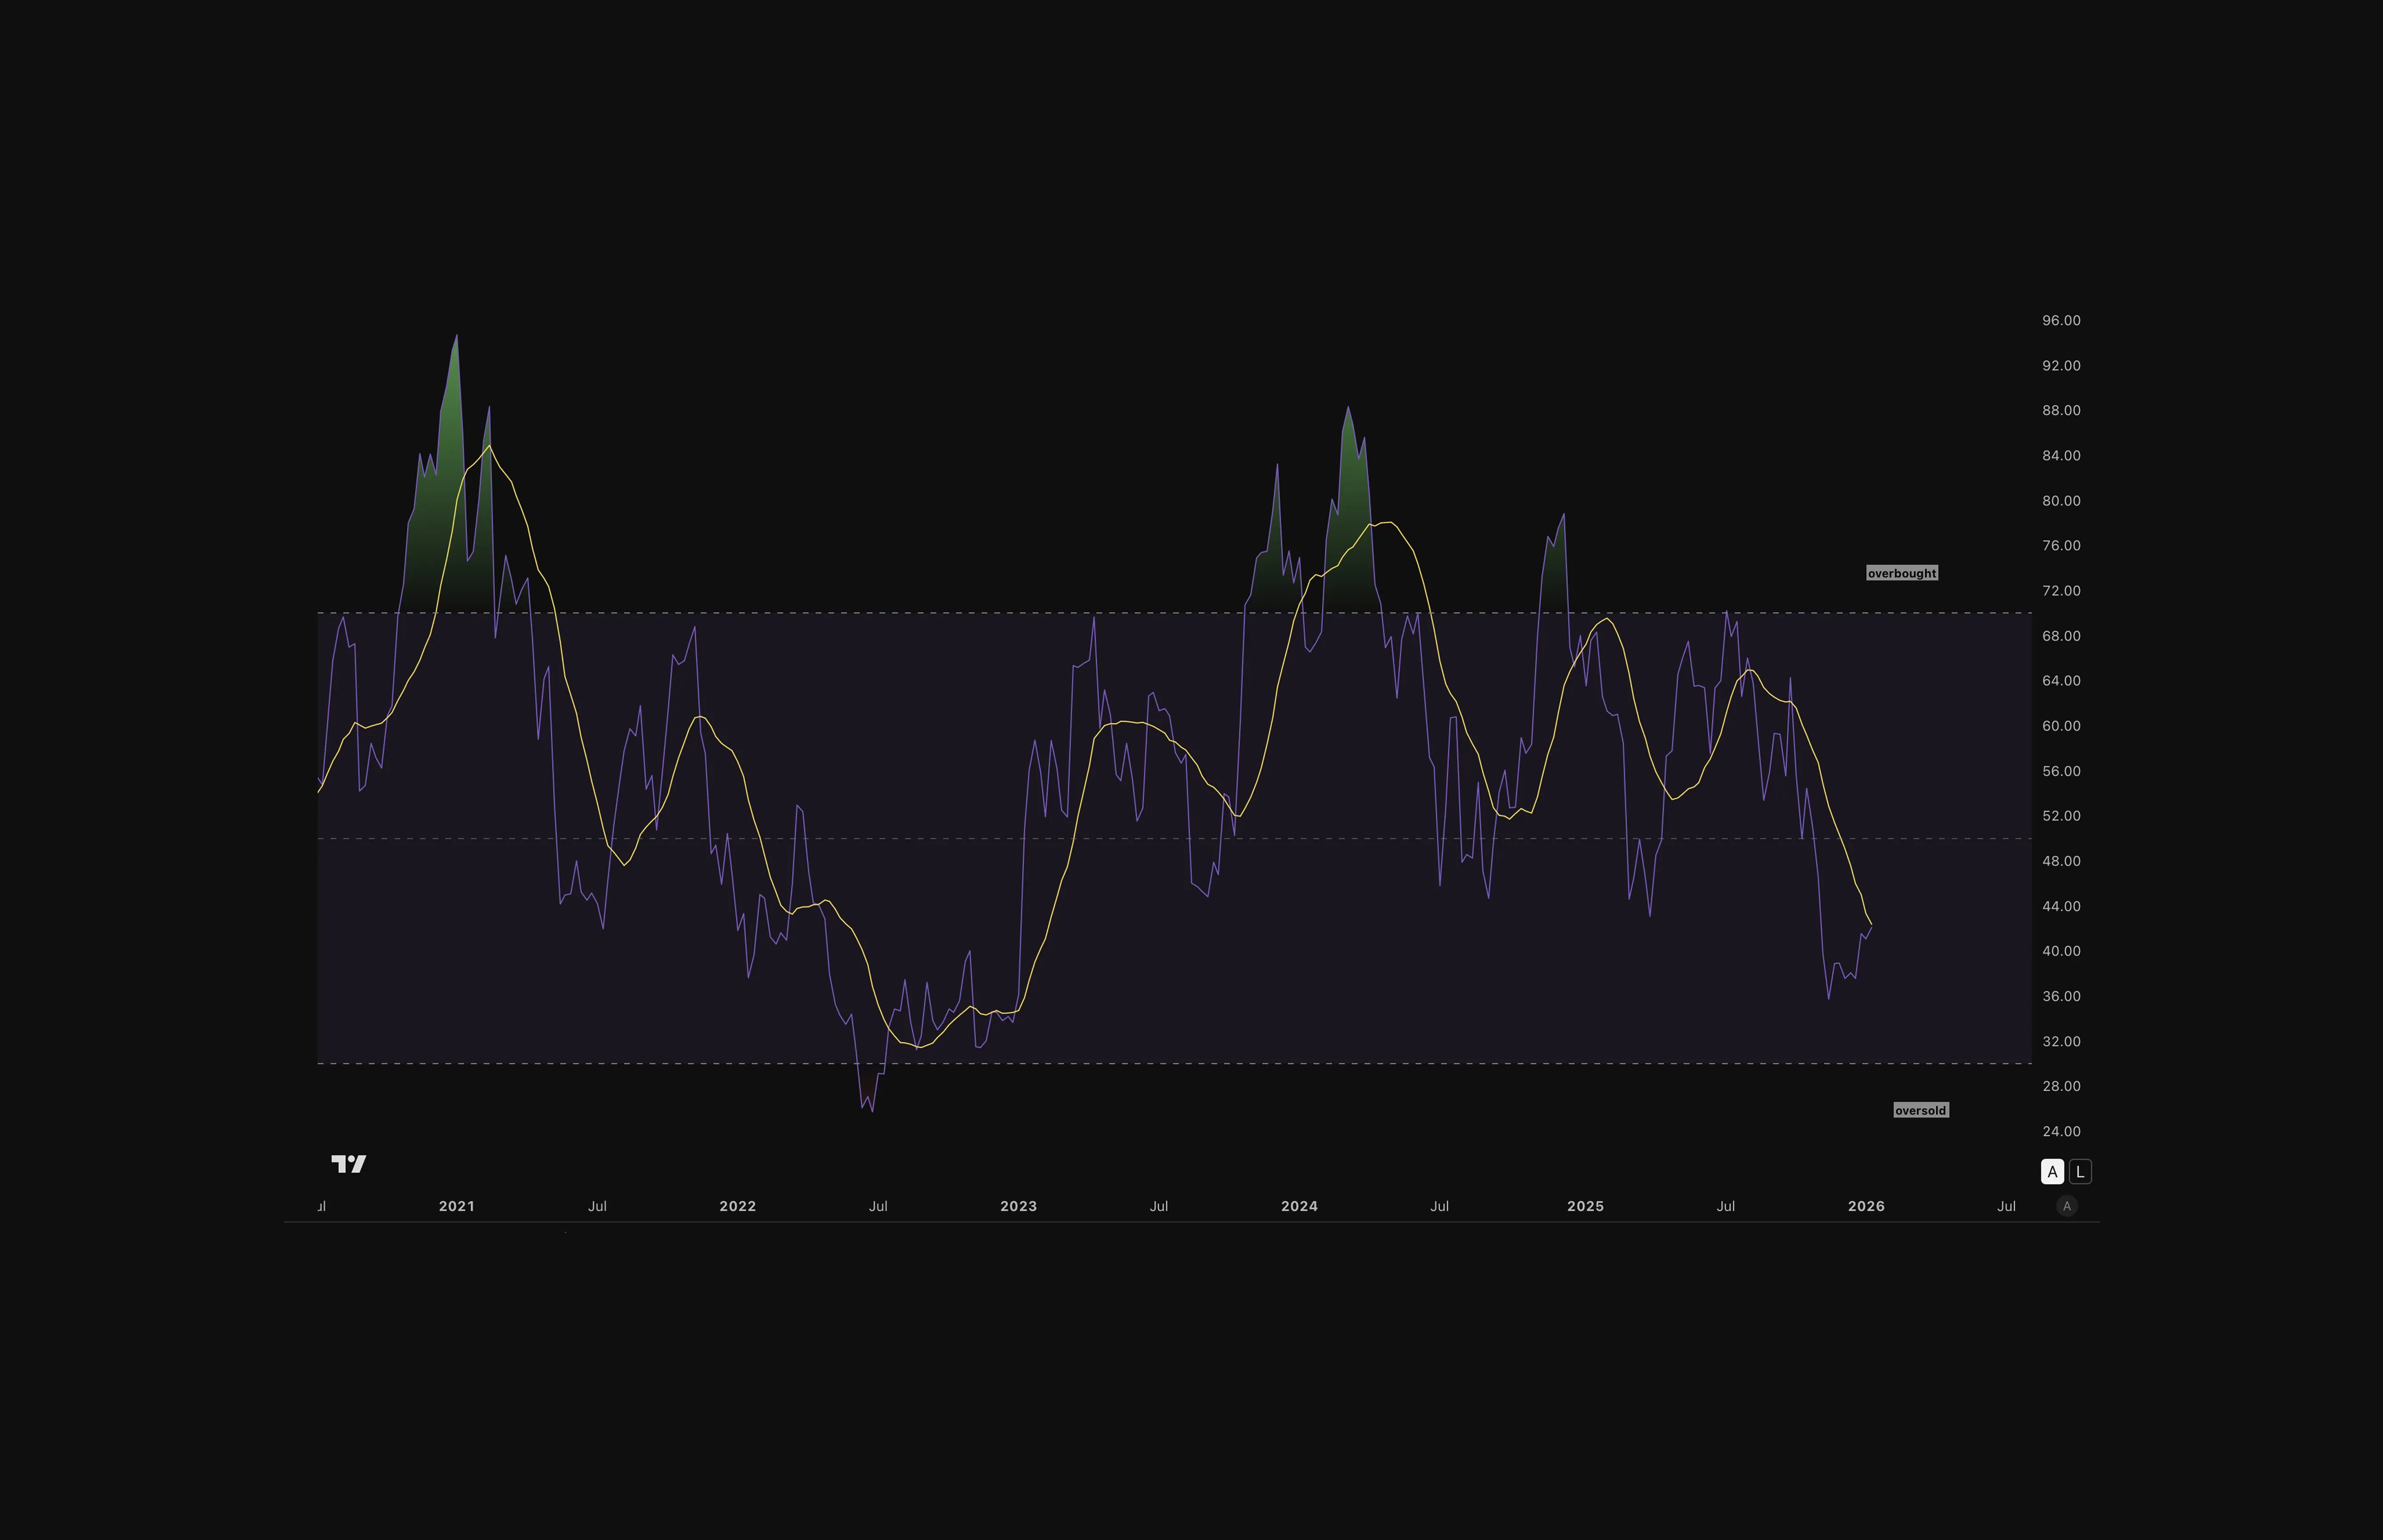
2. RSI (Relative Strength Index)
RSI is a momentum indicator often misused as a reversal signal. Most traders think when RSI goes above 70 (overbought), it's time to sell, and when it drops below 30 (oversold), it's time to buy.
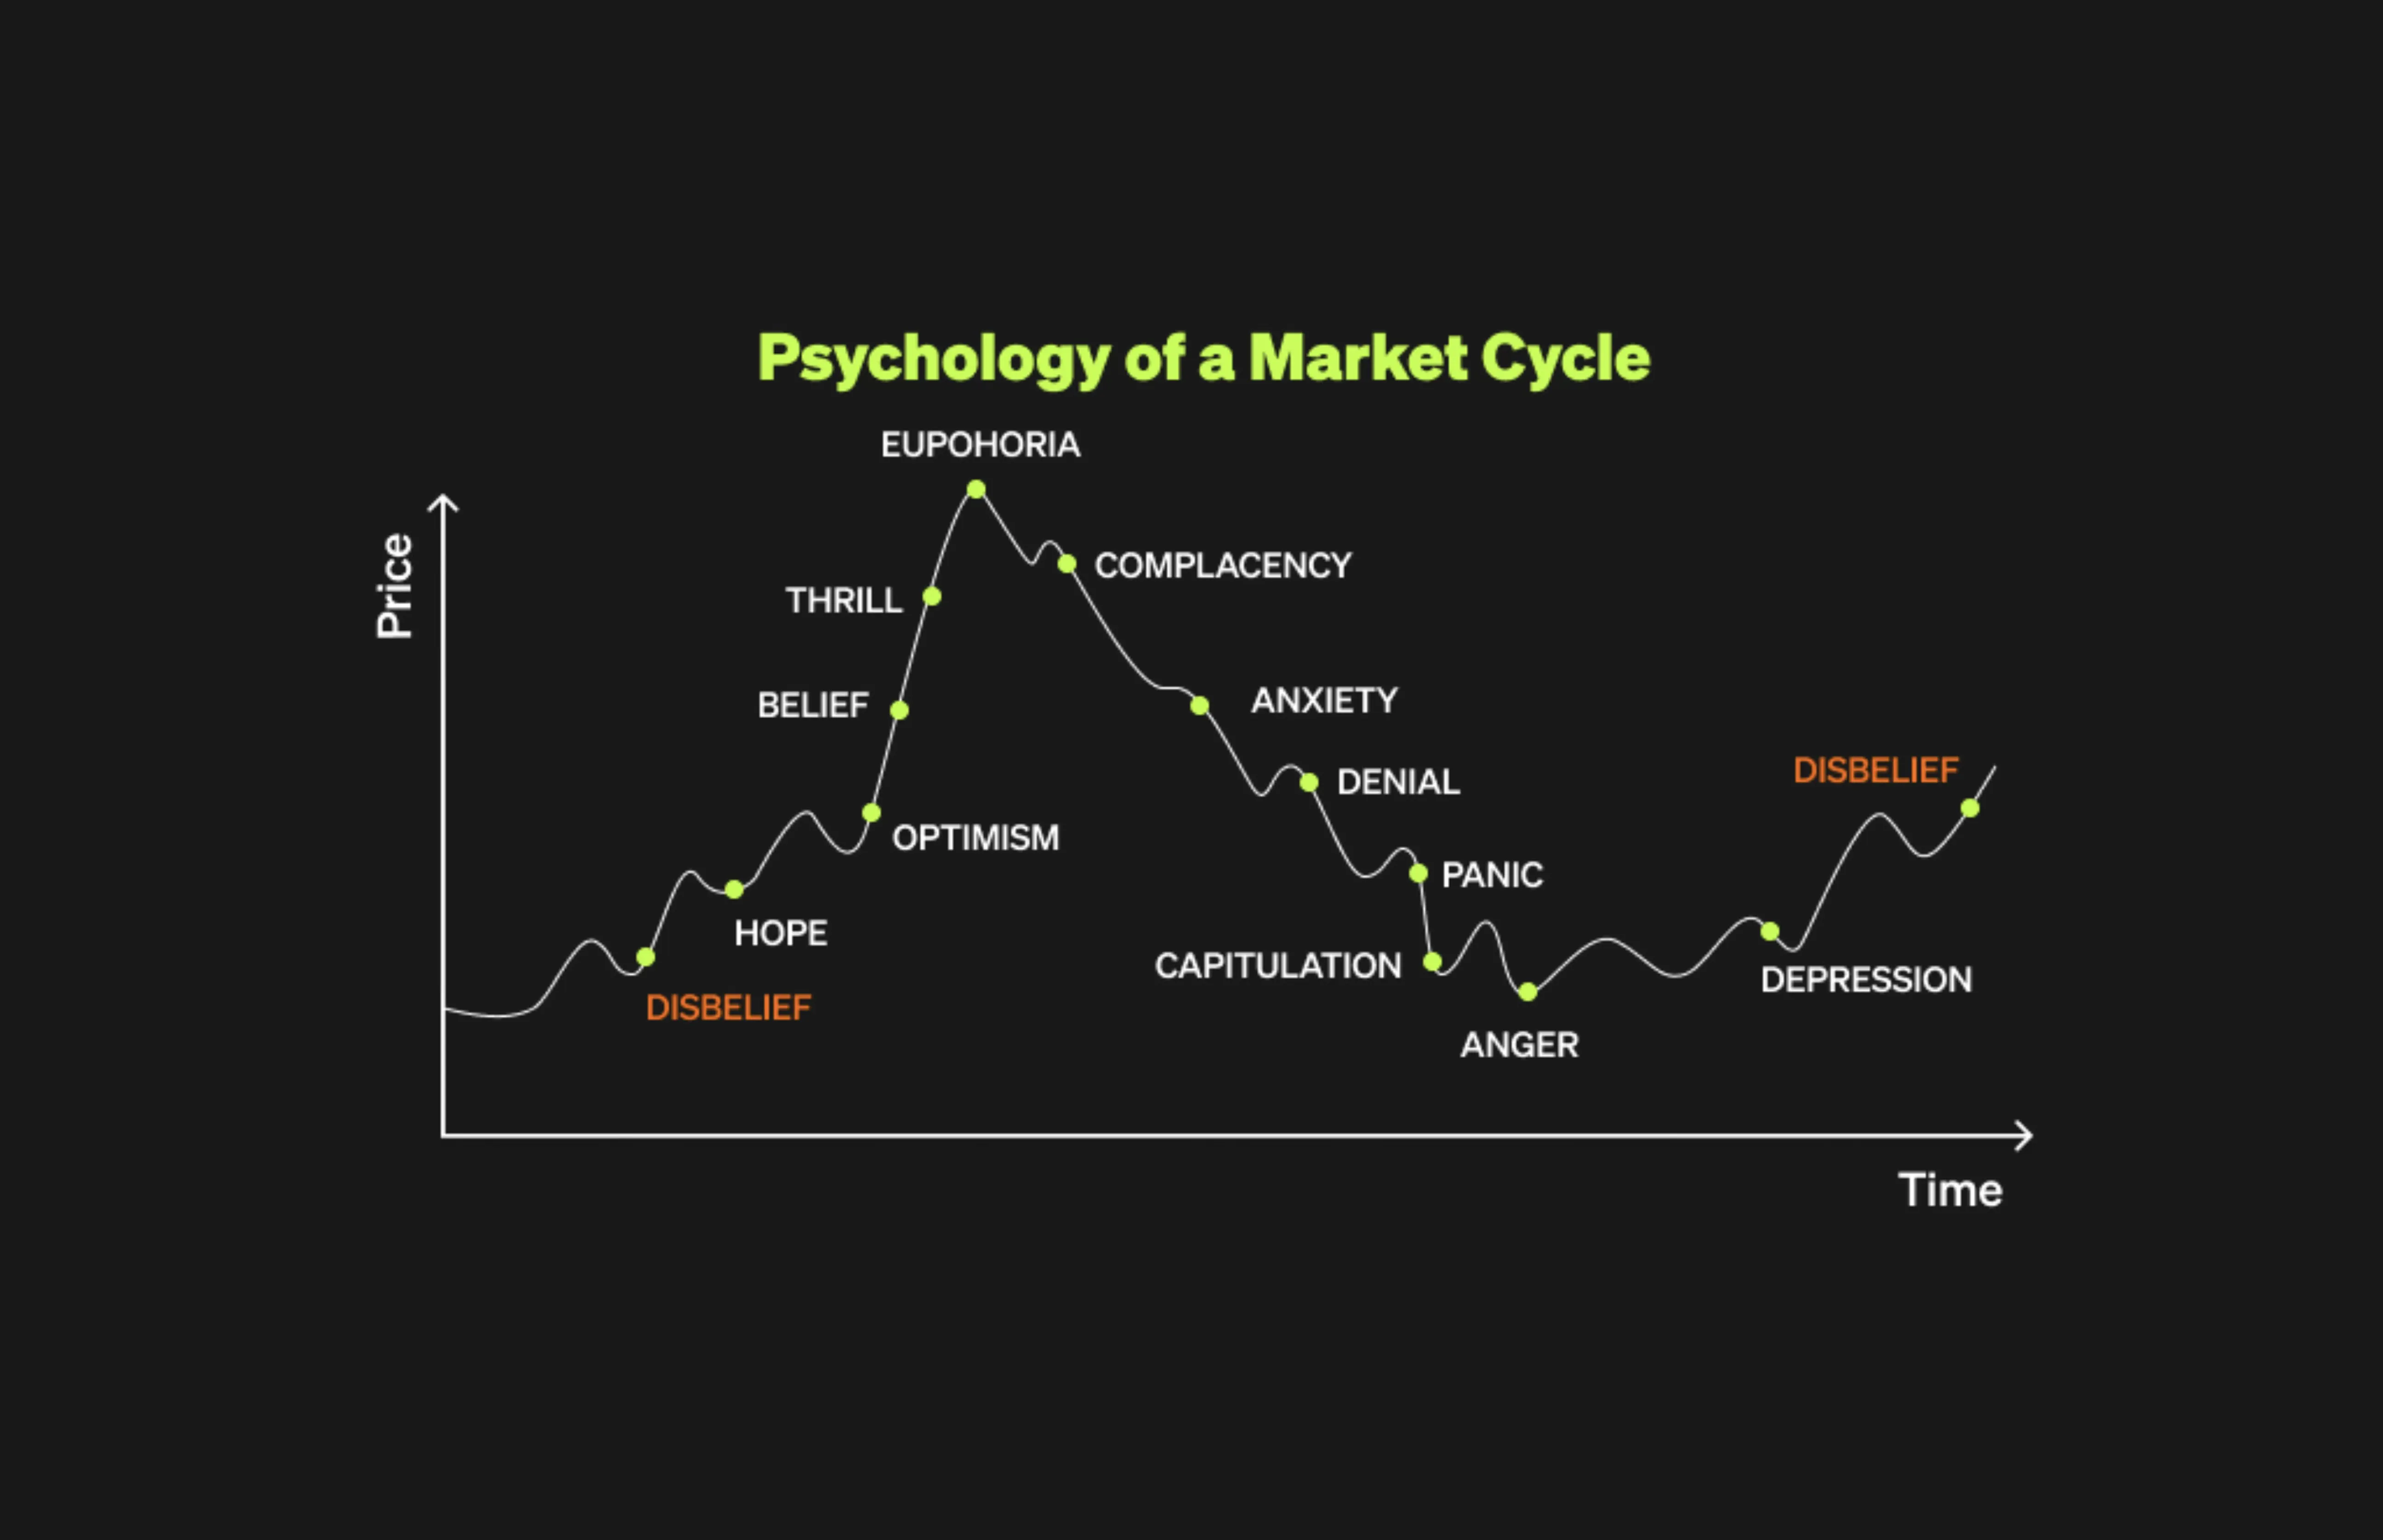
Why Market Psychology Keeps Chart Patterns Alive
Markets evolve, instruments change, and technology advances.
Human behavior does not.
Fear, greed, impatience, and overconfidence remain constant forces shaping decision-making under uncertainty. That consistency is why price patterns identified decades ago still appear in charts today.
The How to Trade Without Leverage eBook breaks down a framework with visual examples, showing exactly how to spot key patterns and filter out low-probability zones that waste time.
Candlestick and chart patterns help identify:
Possible reversals
Market sentiment shifts
High-probability entry points
Price patterns endure not because markets remember the past, but because participants repeat it.
Optimism and pessimism swing can be a pendulum, rarely stopping at balance and often overshooting in both directions.
Technical structures form as a byproduct of those extremes visible evidence of when confidence becomes excessive or caution becomes indiscriminate. The usefulness of charts lies not in forecasting precise outcomes, but in revealing where behavior has become one-sided and risk has quietly shifted.
To stay on top of market structure, be sure to subscribe to Coinjuice.
Simplicity Wins When Execution Matters
Most trading strategies fail not because price structure stops working, but because execution collapses under pressure.
As markets move faster, complexity increases decision fatigue. Decision fatigue leads to hesitation, overrides, and poorly timed risk. When execution degrades, even correct analysis produces poor outcomes.
The Core Principles of Sound Technical Analysis
Technical analysis real strength comes from principles that govern decision-making when under uncertainty:
Price before narrative: Price reflects decisions already made, making it more reliable than headlines or opinions
Trends reflect behavior: Directional movement forms as confidence or fear reinforces itself through participation
Levels hold memory: Areas of heavy past activity influence future behavior through collective recall
Risk defines validity: A trade without a predefined exit remains an opinion, not a strategy
Simplicity preserves execution: Clean rules and structure outperform complexity when volatility rises
Conclusion
Technical analysis is not about predicting the future with accuracy. It's about responding intelligently to what price already communicates. Bitcoin continues to reinforce this lesson. Expansions, corrections, and volatility cycles follow familiar phases that reward preparation and punish impulsive reactions. Structure adapts in real time through trading experience.
For readers interested in extending these ideas, the Coinjuice How to Trade Without Leverage supports a long-term, non-leverage-dependent trading approach, a framework built around longevity instead of excitement, repetition instead of prediction, and takes decisions based on chart structure.
Markets will continue to move. Price will continue to reflect behavior. Structure is what allows participation without falling for chaos and over time, structure is what separates resilience from regret.
Subscribe to Coinjuice PRO for weekly market insights and actionable Bitcoin setups informed by years of real-world trading experience.
FAQ
What is the core assumption of technical analysis?
Technical analysis assumes that every headline, macro shift, sentiment change, and speculative impulse ultimately expresses itself through price action, so it focuses on observable behavior in motion rather than reacting to news.
What are the four main price-based components of technical analysis?
The four components are candlestick charts (visual record of price behavior across timeframes), trends (directional bias through sequential highs and lows), support and resistance (price levels where buyers and sellers have previously concentrated), and indicators (calculations derived from historical price movements).
How can traders objectively identify and validate uptrends and downtrends?
An uptrend shows higher highs and higher lows, with sharp rises followed by pullbacks, and remains valid until price cracks and closes below the lower low of the previous pullback. A downtrend shows lower lows and lower highs, with impulsive moves followed by pullbacks, and remains valid until price breaks and closes above the highest high of the previous pullback or above a prior resistance line.
What is the break and retest strategy in trending markets?
In an uptrend, the market breaks above previous resistance, pulls back to that level (now support), then bounces and continues higher, creating an entry opportunity on the pullback. In a downtrend, the market breaks below previous support, pulls back to that level (now resistance), then drops and continues lower, with the entry opportunity again occurring during the pullback.
Disclaimer
The information provided in this article is for informational purposes only. It is not intended to be, nor should it be construed as, financial advice. We do not make any warranties regarding the completeness, reliability, or accuracy of this information. All investments involve risk, and past performance does not guarantee future results. We recommend consulting a financial advisor before making any investment decisions.
Written by

Andrew Kamsky
Andrew Kamsky is a Bitcoin analyst. He spent a decade in traditional finance across a Big Four firm and a listed fintech bank before going deep on Bitcoin full-time.


