









Quick summary
Fear and Greed Index reading 69 occurs at widely varying Bitcoin prices and cycles
Across nineteen cases, average returns improved over time, boosted by a few big rallies
Pre 2024 readings showed strong three month gains, later readings were weaker or negative
Sample is small and clustered, so a 69 reading is sentiment, not a price predictor
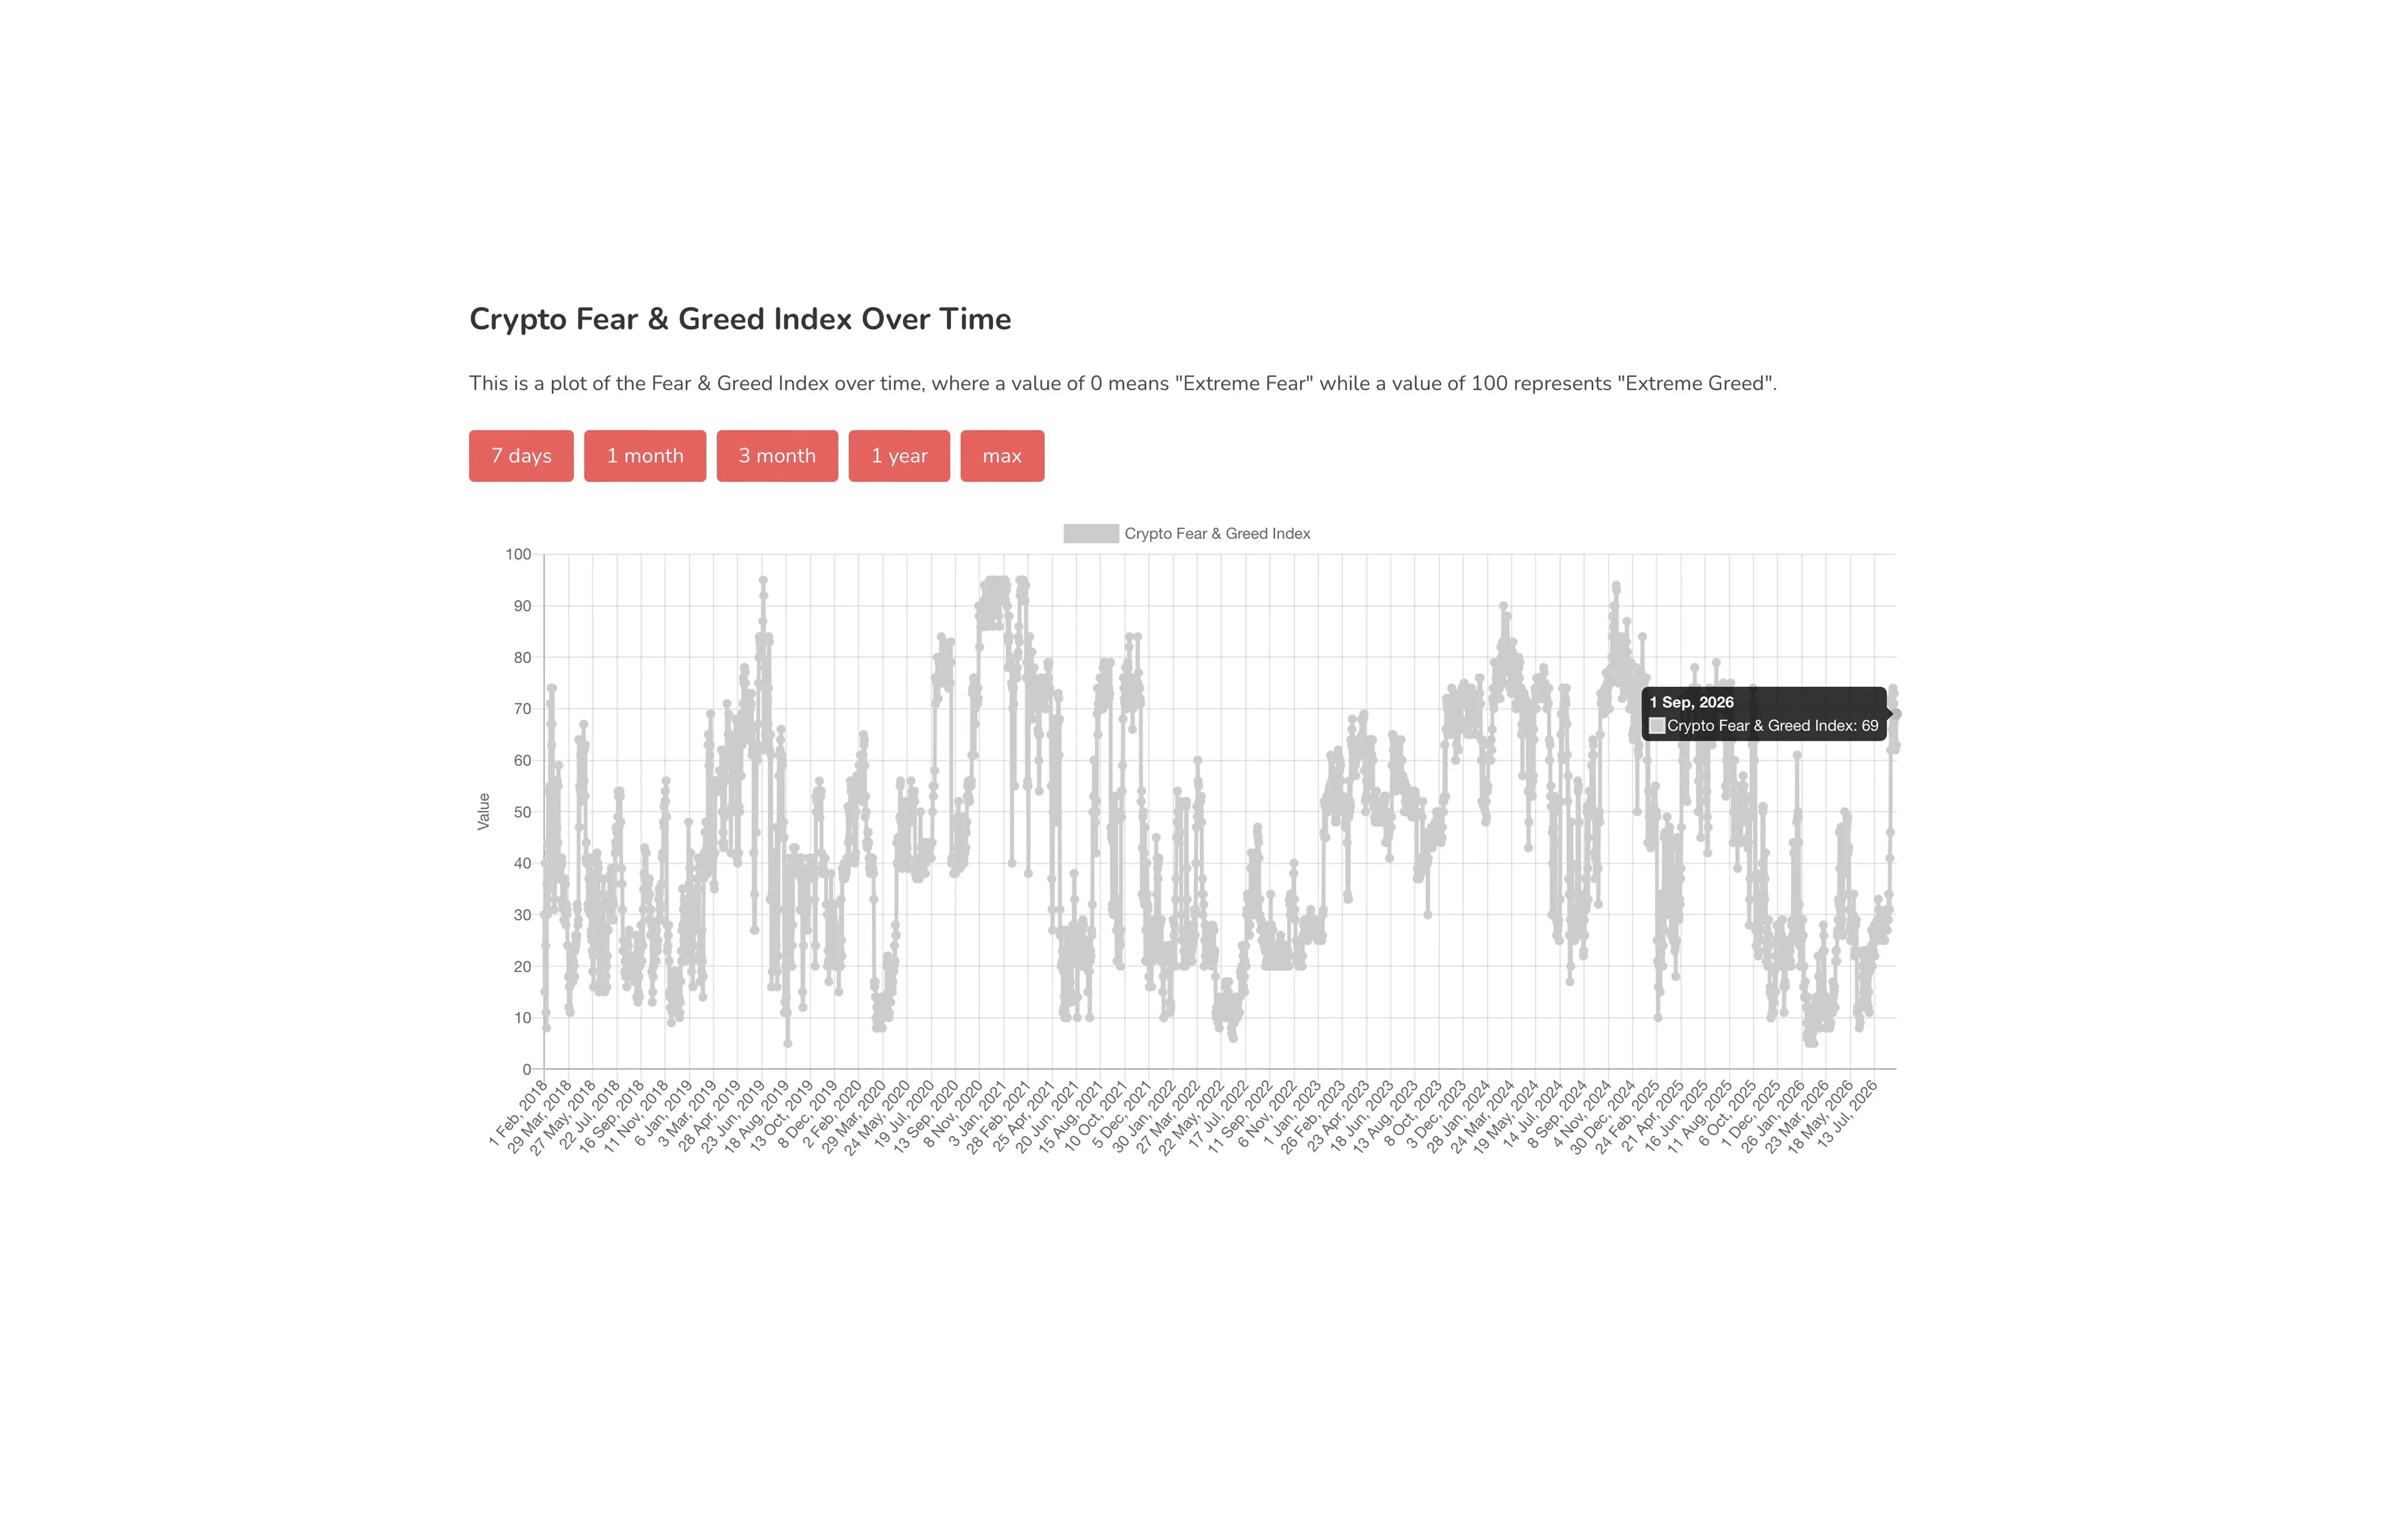
On September 1, 2026, Bitcoin’s Crypto Fear & Greed Index reached 69, classified as “Greed,” while Bitcoin traded near $77,195. The same reading first appeared in this analysis in February 2019, when Bitcoin was worth about $4,113, showing that a score of 69 can occur at very different prices and stages of the market cycle.
In this article, we examine every date the index recorded exactly 69 and how Bitcoin performed afterwards. Bitcoin was higher three months after all 12 readings before 2024, but this was true for only three of the seven readings in 2024 and 2025.
Bitcoin Fear and Greed Index Data and Methodology
This analysis combines two daily datasets:
Fear & greed index: Daily readings from Alternative.me.
Bitcoin price: Historical daily BTC prices from DefiLlama.
Qualifying observation: Any date on which the index recorded exactly 69.
Forward return: Bitcoin’s percentage price change after seven days, 21 days, two months and three months.
Calculation method: Each return is calculated separately and is not compounded.
Incomplete periods: The two 2026 observations are excluded because the required forward periods have not yet elapsed.
Every time Bitcoin’s Fear & Greed Index reached 69
The index recorded exactly 69 on 21 days between February 2019 and September 1, 2026.
Date | BTC price |
Feb. 24, 2019 | $4,113* |
Apr. 7, 2019 | $5,042* |
May 7, 2019 | $5,715* |
May 9, 2019 | $5,957* |
May 22, 2019 | $7,939* |
May 25, 2019 | $7,981* |
Aug. 7, 2021 | $42,813* |
Apr. 17, 2023 | $29,467 |
Nov. 9, 2023 | $36,768 |
Nov. 14, 2023 | $35,545 |
Nov. 18, 2023 | $36,582 |
Nov. 20, 2023 | $37,489 |
May 5, 2024 | $64,010 |
Jul. 17, 2024 | $64,136 |
Jul. 24, 2024 | $65,404 |
Oct. 24, 2024 | $68,214 |
Jan. 9, 2025 | $92,376 |
Jan. 11, 2025 | $94,560 |
Aug. 10, 2025 | $119,267 |
Aug. 30, 2026 | $77,689 |
Sep. 1, 2026 | $77,195 |
*Daily opening price used where a populated closing price was unavailable.
The index reached 69 with Bitcoin priced anywhere from $4,113 to $119,267, a 29-fold range. This shows that the reading reflects market sentiment, not Bitcoin’s value or position in the market cycle.
Bitcoin Returns After the Fear & Greed Index Reached 69
Of the 21 qualifying dates, 19 have enough subsequent price history to calculate forward returns.
Forward period | Average return | Median return | Positive observations |
7 days | +5.7% | +2.0% | 12 of 19 |
21 days | +10.2% | +7.0% | 13 of 19 |
2 months | +22.7% | +17.6% | 12 of 19 |
3 months | +36.2% | +28.2% | 15 of 19 |
In 15 of the 19 completed historical observations, Bitcoin was trading higher three months after the Fear & Greed Index reached 69, equivalent to 79%. The median return increased from +2.0% after seven days to +28.2% after three months. The average return rose from +5.7% to +36.2% over the same horizons.
Averages exceeded medians: A small number of large Bitcoin gains pulled the overall results upward, particularly during the 2019 recovery from the previous bear market.
Short-term results were less consistent: Bitcoin was lower after seven days in seven of 19 observations, making a reading of 69 an unreliable short-term directional indicator.
Longer-term results were stronger: Bitcoin was higher after three months in 15 of 19 observations, although this record was heavily influenced by earlier market cycles.
Results After 2024 Were Considerably Weaker
Dividing the sample between observations before 2024 and those during 2024 and 2025 produces the article’s most important comparison.
Sample | Observations | 7-day average | 21-day average | 2-month average | 3-month average |
Before 2024 | 12 | +7.6% | +14.4% | +36.2% | +56.2% |
2024–2025 | 7 | +2.4% | +3.1% | −0.6% | +2.0% |
All completed observations | 19 | +5.7% | +10.2% | +22.7% | +36.2% |
Why 21 Readings Do Not Mean 21 Separate Market Events
The 21 dates were not distributed evenly across the index’s history. Sixteen occurred within the five clusters shown below, while the remaining five were isolated readings. Only 19 of the 21 dates have enough subsequent data to be included in the forward-return analysis.
Cluster | Number of readings | BTC price range |
Feb.–May 2019 | 6 | $4,113–$7,981 |
November 2023 | 4 | $35,545–$37,489 |
July 2024 | 2 | $64,136–$65,404 |
January 2025 | 2 | $92,376–$94,560 |
Aug.–Sep. 2026 | 2 | $77,195–$77,689 |
Six readings occurred during the 2019 recovery. Another four appeared within 12 days in November 2023. Pairs also occurred in July 2024, January 2025 and across August 30 and September 1, 2026.
Dates within the same cluster share much of the same subsequent price path. For example, the four November 2023 dates are counted as separate observations, but all belong to a single broader market advance.
How Did Bitcoin Perform After the Fear & Greed Index Hit 69?
The table below shows Bitcoin’s return after each historical date on which the Fear & Greed Index recorded exactly 69.
Date | BTC price | After 7 days | After 21 days | After 2 months | After 3 months |
Feb. 24, 2019 | $4,113* | −7.1% | −2.6% | +34.9% | +91.4% |
Apr. 7, 2019 | $5,042* | +0.6% | +4.1% | +54.9% | +123.4% |
May 7, 2019 | $5,715* | +36.5% | +53.5% | +97.1% | +101.1% |
May 9, 2019 | $5,957* | +37.2% | +45.1% | +106.3% | +101.4% |
May 22, 2019 | $7,939* | +9.9% | −0.3% | +33.3% | +28.2% |
May 25, 2019 | $7,981* | +7.4% | +8.6% | +22.4% | +27.2% |
Aug. 7, 2021 | $42,813* | +11.6% | +14.6% | +29.3% | +44.1% |
Apr. 17, 2023 | $29,467 | −6.6% | −6.0% | −10.1% | +2.3% |
Nov. 9, 2023 | $36,768 | −1.5% | +2.6% | +25.4% | +28.2% |
Nov. 14, 2023 | $35,545 | +1.2% | +24.1% | +17.6% | +45.7% |
Nov. 18, 2023 | $36,582 | +3.4% | +19.6% | +12.8% | +42.5% |
Nov. 20, 2023 | $37,489 | −0.6% | +9.9% | +11.0% | +39.5% |
May 5, 2024 | $64,010 | −3.9% | +7.0% | −11.4% | −15.7% |
Jul. 17, 2024 | $64,136 | +2.0% | −14.1% | −6.0% | +5.0% |
Jul. 24, 2024 | $65,404 | −1.1% | −10.2% | −1.6% | +4.3% |
Oct. 24, 2024 | $68,214 | +3.0% | +28.1% | +44.7% | +53.7% |
Jan. 9, 2025 | $92,376 | +8.3% | +13.4% | −12.6% | −10.6% |
Jan. 11, 2025 | $94,560 | +10.3% | +6.5% | −12.4% | −11.8% |
Aug. 10, 2025 | $119,267 | −1.5% | −9.2% | −5.1% | −11.2% |
Conclusion: What the Historical Results Show and Their Limits
Across the 19 completed observations, Bitcoin’s median three-month return after the index reached 69 was +28.2%, with the price rising in 15 cases. However, all 12 gains before 2024 contrast with only three gains across seven readings in 2024 and 2025. Because the sample is small and some dates captured the same market move, a reading of 69 is not a reliable prediction on its own. Its meaning depends on the wider Bitcoin market conditions at the time.
Data snapshot taken September 1, 2026. Bitcoin’s September 1 daily price was still subject to settlement and subsequent revisions when the data was collected. Sources: Alternative.me’s Crypto Fear & Greed Index and DefiLlama’s Bitcoin market data.
Disclosure: AI-based research tools assisted with compiling and analyzing the data.
Readers looking to build a tradng framework can start with the Coinjuice ebook, Bitcoin Trading Without Leverage, or go deeper with a Coinjuice subscriptiion. The annual plan includes the ebook for free.
FAQ
What does a Crypto Fear and Greed Index reading of sixty-nine indicate for Bitcoin?
A reading of sixty-nine places market sentiment in the “Greed” category and reflects existing market momentum, volatility, and sentiment, but it is not tied to a particular Bitcoin price and does not reveal where Bitcoin sits in its wider cycle.
How has Bitcoin typically performed after the index reached sixty-nine across all completed observations?
Across nineteen completed observations, Bitcoin’s average return was 5.7% after seven days, 10.2% after twenty-one days, 22.7% after two months, and 36.2% after three months, with Bitcoin higher in fifteen of the nineteen cases after three months.
How did outcomes before twenty twenty-four compare with those from twenty twenty-four and twenty twenty-five after a reading of sixty-nine?
Before twenty twenty-four, Bitcoin was higher three months later after all twelve readings, with an average three‑month return of 56.2%. In twenty twenty-four and twenty twenty-five, Bitcoin was higher three months later after only three of seven readings, with an average three‑month return of 2% and a median of negative 10.6%.
Why is the historical analysis of a sixty-nine reading considered limited?
The analysis is limited because it is based on a small sample of twenty-one readings, many of which are clustered around the same market moves, and because the strongest gains came from earlier cycles, making the seventy-nine percent three‑month success rate not equivalent to nineteen independent trading trials.
Disclaimer
The information provided in this article is for informational purposes only. It is not intended to be, nor should it be construed as, financial advice. We do not make any warranties regarding the completeness, reliability, or accuracy of this information. All investments involve risk, and past performance does not guarantee future results. We recommend consulting a financial advisor before making any investment decisions.
More like this


Written by

Andrew Kamsky
Andrew Kamsky is a Bitcoin analyst. He spent a decade in traditional finance across a Big Four firm and a listed fintech bank before going deep on Bitcoin full-time.