










Quick summary
Bitcoin rebounded to $82,102 after a brief dip below $80,000 on hot PPI
Move higher aligned with falling Treasury yields, while ETF flows and sentiment stayed neutral
Daily trend remains intact above rising 200-day EMA amid compressed Bollinger bandwidth and low volatility
Binance Pool will close mining services after hashrate fell 65%, but network hash redirects elsewhere
Bitcoin trades at $82,102 after a brief dip below $80,000, still 34.92% under its $126,156 high. A hot producer-price print, a one-day ETF outflow, neutral sentiment and a volatility squeeze describe a market that bounced without committing.
Rebound: Falling Yields Lift Price & Volatility Compresses
September PPI rose 1.3% month on month against a 0.5% forecast, the largest monthly rise since March 2022, according to Seoul Economic Daily. It followed a hot CPI report on October 14 and briefly pushed BTC under $80,000 for the first time since September 18. CoinDesk’s live coverage had BTC at $79,950 as it lost $80,000, then a quick recovery as the 10-year Treasury yield fell from 5.36% to about 5.07%.
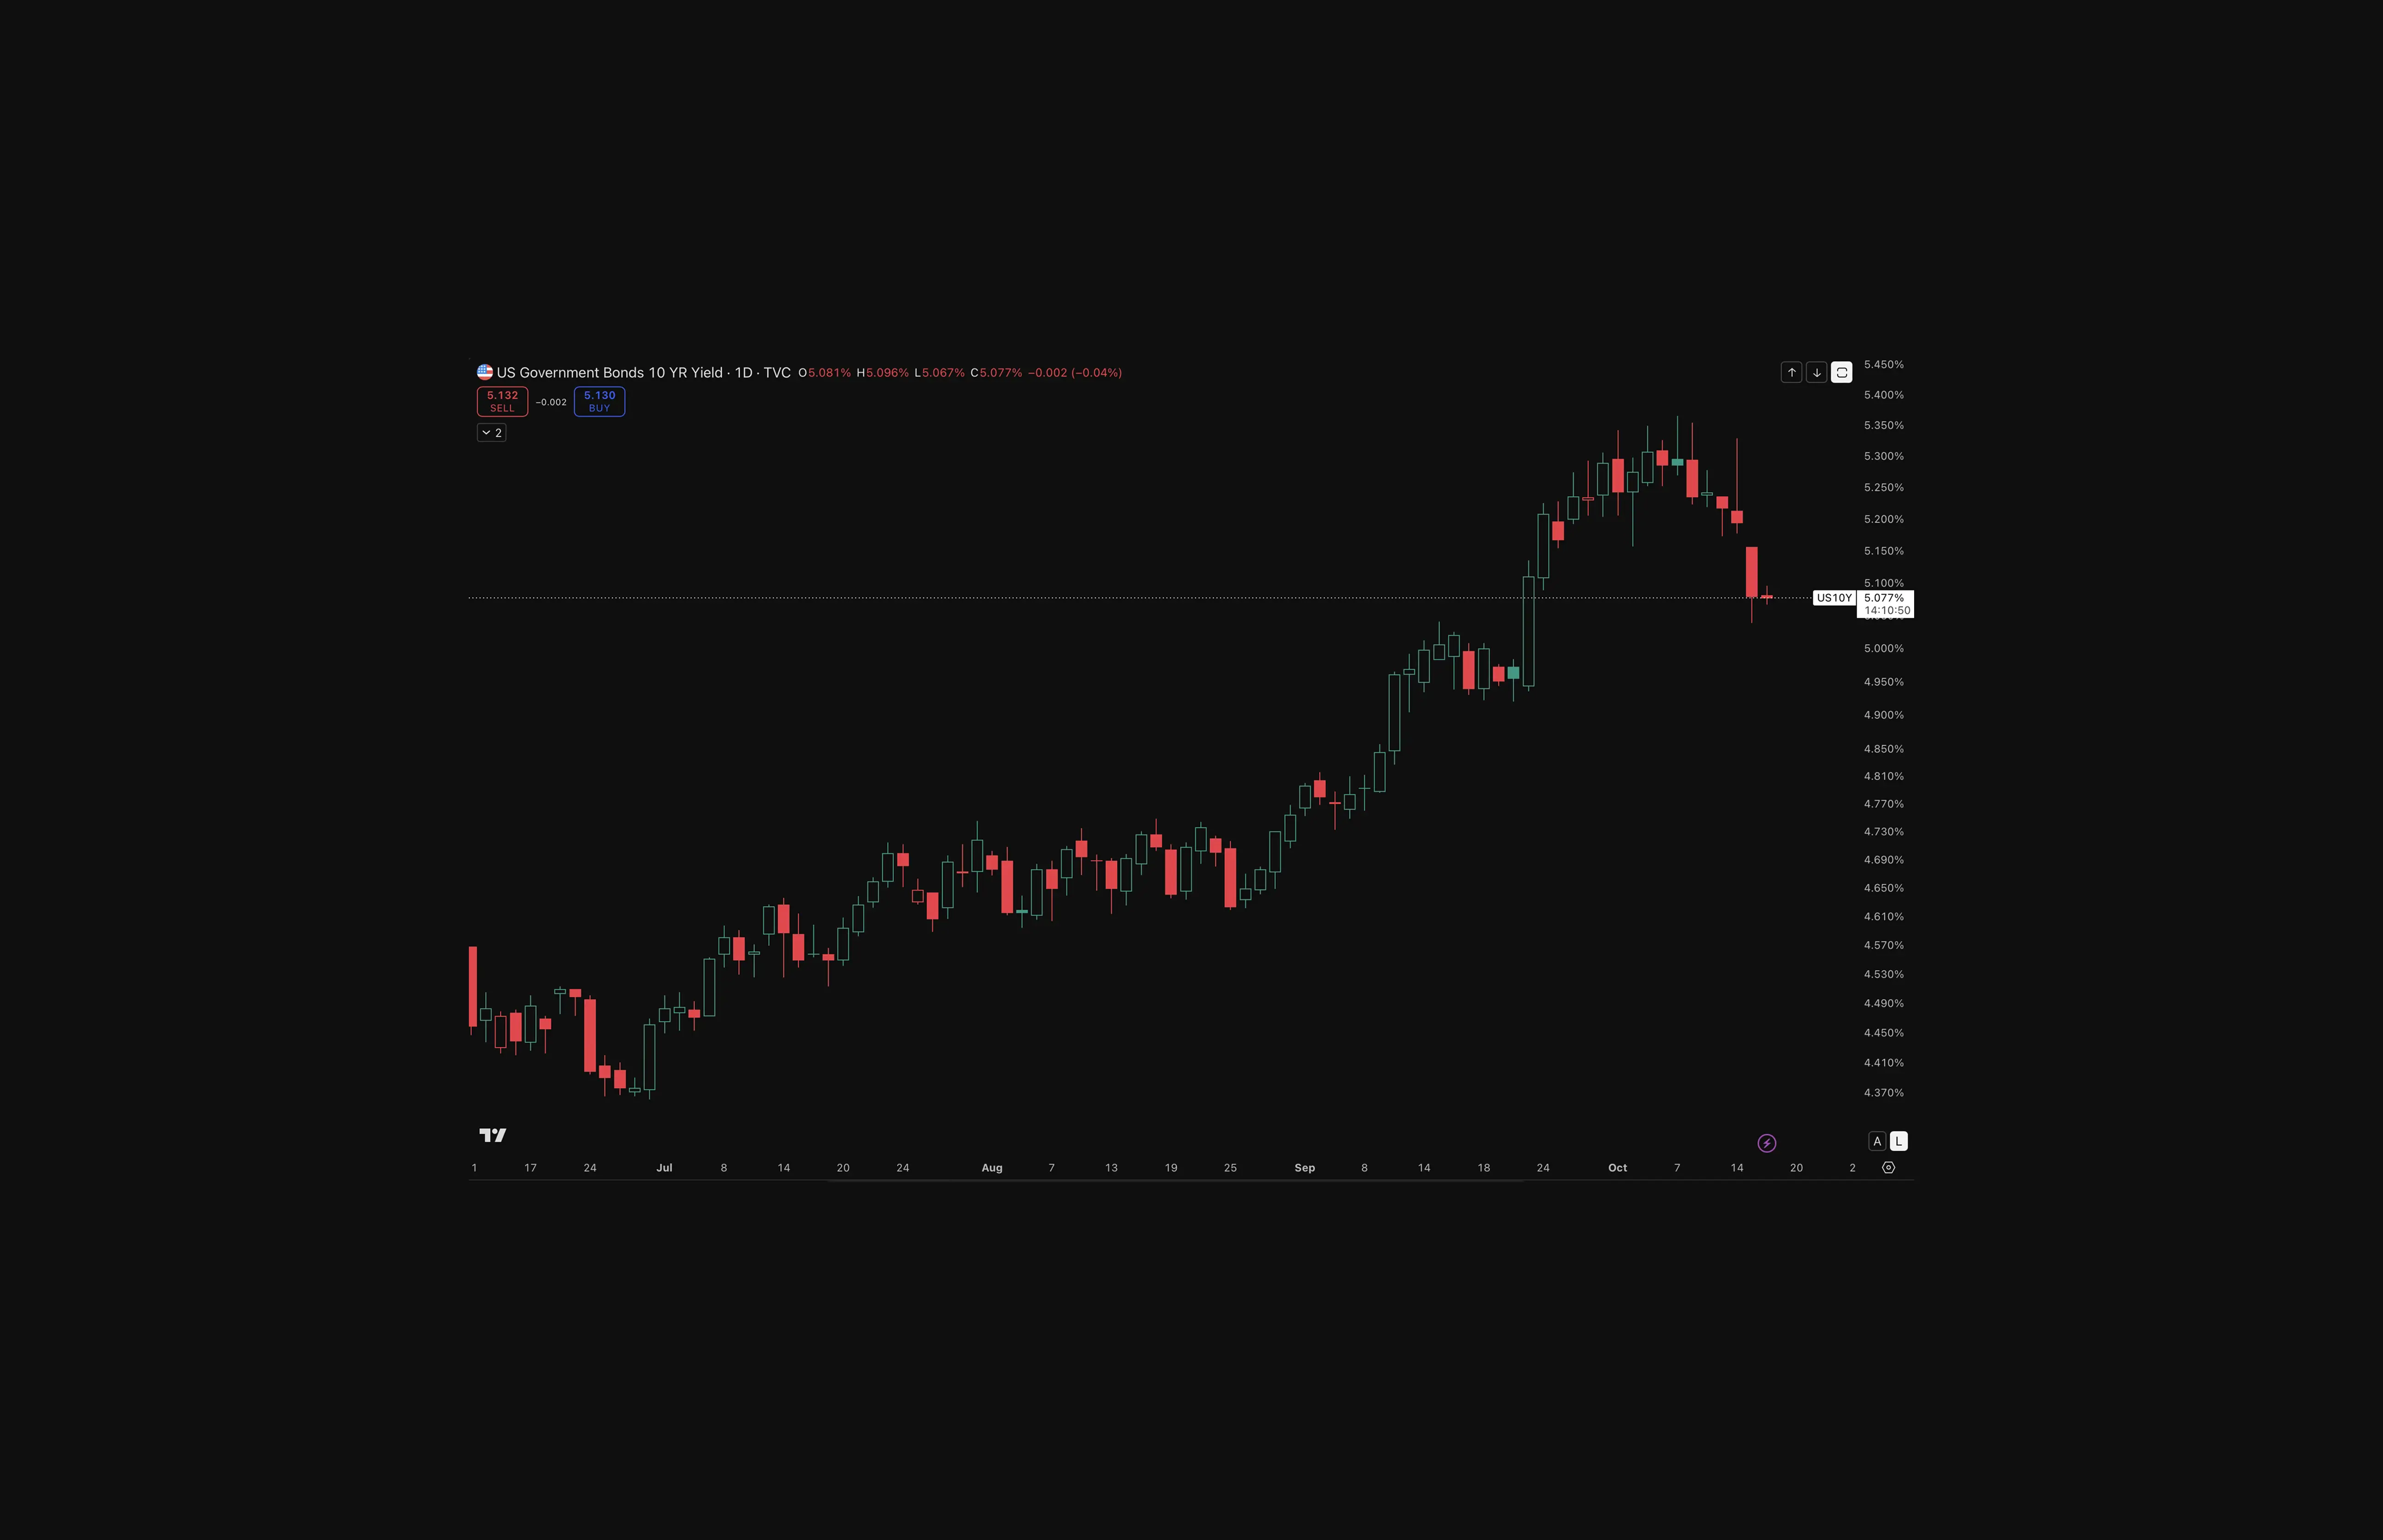
Observation: Price recovered above $82,000 within hours, alongside the move in yields.
Interpretation: The roughly $262M spot ETF outflow on October 14 was followed by roughly flat flows on October 15, with an estimated net inflow near $5.06M. That second figure is attributed to SoSoValue data relayed by TokenPost and CoinoTag, so it is unverified and indicative only. Neutral Fear & Greed readings fit the same picture: relief, not renewed demand.
Benefit: A rebound that coincides with rates and not with flows is unconfirmed. Unconfirmed moves are better tracked than traded.
Fed Chair Kevin Warsh spoke in Bangkok at 11:30 p.m. ET on October 15 (03:30 UTC, October 16), per CoinDesk’s schedule. He declined to signal the next move, telling the IMF audience “I don’t prejudge meetings” (CNBC). The rate path remains open.
Technicals: Daily Trend Holds, 3D Does Not
The daily structure is split. Price sits above a rising 200-day EMA at $75,758, but the 3-day 200-period average at $88,369 remains above price. The long trend is intact on the daily chart and unproven on the 3-day. Bollinger readings add a second tension: price sits near the lower band (23.1% of band range), and bandwidth of 6.66% is well under its 60-day median of 14.74%.
Metric (1D) | Reading | Interpretation |
EMA 200 | $75,758, rising; price about 8.4% above | Daily trend intact |
Bollinger position | 23.1% of band range | Price near lower band |
Bollinger bandwidth | 6.66% vs 14.74% 60-day median | Squeeze: volatility compressed |
MACD histogram | −$501, improving (−567, −536, −501) | Momentum below zero but recovering |
Divergence | None clear on one-day view | No early reversal evidence |

Moving Simple Averages Across Timeframes
Timeframe | MA 20 | MA 50 | MA 200 | Price vs MA 200 |
1D | $83,597 (price −1.79%) | $81,267 (price +1.02%) | $72,364 | +13.45% |
3D | $80,572 (price +1.89%) | $71,188 (price +15.33%) | $88,369 | −7.10% |
1W | $71,533 (price +14.77%) | $76,544 (price +7.26%) | $66,838 | +22.83% |
1M | $87,168 (price −5.82%) | $63,516 | n/a | n/a |
Mining: A Pool Exits, The Network Does Not
Binance Pool plans to close mining services on November 10, and CoinDesk reports the pool once handled 2.3% of the network before its hashrate fell 65%. Pool-level shrinkage is not a drop in total network hash rate. Miners can redirect machines, so the effect on pool concentration depends on where capacity moves.
CoinJuice Lens: Market Structure
Weekly RSI sits at 57 after pulling back from 63 on the week beginning September 28, close to the 56 to 57 hold zone set in the July low bottom analysis. Price is above the weekly 50 and 200 averages, yet it has closed below the 3-day 200 ($88,369) for 90 bars. A weekly close under RSI 56 would weaken the momentum breakout. The split between timeframes is the structure to monitor.
Readers looking to prepare for the next resistance test or pullback can start with the Coinjuice ebook, Bitcoin Trading Without Leverage, or go deeper with a Coinjuice subscription, currently 30% off the annual plan, where we start and complete trades and you will learn to snipe them independently.
News Behind Today's Read
Live updates: Bitcoin bounces back to $82,000 after first fall below $80,000 in one month (CoinDesk): Source for the move through $80,000, the yield decline from 5.36% to about 5.09%, and the Warsh schedule.
Bitcoin Rebounds to $82,000 as Treasury Yields Fall (Seoul Economic Daily): Source for the 1.3% PPI print, the October 14 outflow date and neutral sentiment.
Bitcoin mining pool once handling 2.3% of network shuts after hashrate falls 65% (CoinDesk): Source for the Binance Pool closure and the effective hashrate decline.
Fed's Warsh withholds rate signal, praises recent global tightening with 'no free riders' (CNBC): Source for Warsh's "I don't prejudge meetings" remark.
One of 12 spot Bitcoin ETFs draws inflows as daily net intake reaches $5.06 million (TokenPost) and BlackRock's IBIT Carried All $16.79M of Thursday's Bitcoin (BTC) ETF Inflow (CoinoTag), both citing SoSoValue: Source for the October 15 net inflow of about $5.06M. Unverified; aggregator-level.
Market Snapshot
Metric | Reading | Note |
BTC | $82,102 | 34.92% below ATH ($126,156) |
ETH | $2,450 | 50.47% below tracked ATH |
DeFi TVL | $90.17B | DefiLlama, base-only |
BTC share of five-asset basket | 75.22% | BTC/ETH/SOL/BNB/XRP; narrow proxy, not market-wide dominance |
This article was developed with the support of artificial intelligence tools as part of Coinjuice’s editorial process and reviewed by our editorial team before publication.
FAQ
What triggered Bitcoin’s brief drop below $80,000 and its fast rebound to around $82,000?
A hotter-than-expected September PPI reading of 1.3% month on month, following a hot CPI report on October 14, briefly pushed BTC under $80,000 to about $79,950. Bitcoin then quickly recovered above $82,000 as the 10-year U.S. Treasury yield fell from 5.36% to about 5.07%.
How do ETF flows and sentiment currently characterize Bitcoin demand?
There was roughly a $262 million spot Bitcoin ETF outflow on October 14, followed by roughly flat flows on October 15 with an estimated net inflow near $5.06 million, based on unverified aggregator data. Fear & Greed readings are neutral, suggesting relief rather than renewed demand and leaving the rebound unconfirmed.
What do the technical indicators say about Bitcoin’s trend and volatility?
On the daily chart, price is above a rising 200-day EMA at $75,758, keeping the daily trend intact, but remains below the 3-day 200-period average at $88,369, leaving the longer trend unproven on that timeframe. Bollinger Bands show price near the lower band at 23.1% of the band range and a compressed bandwidth of 6.66% versus a 60-day median of 14.74%, indicating a volatility squeeze.
What is happening with Binance Pool and how does it affect Bitcoin mining?
Binance Pool plans to close mining services on November 10 after its hashrate fell 65%; it once handled 2.3% of the Bitcoin network. This is pool-level shrinkage rather than a drop in total network hash rate because miners can redirect their machines, and the effect on pool concentration depends on where that capacity moves.
Disclaimer
The information provided in this article is for informational purposes only. It is not intended to be, nor should it be construed as, financial advice. We do not make any warranties regarding the completeness, reliability, or accuracy of this information. All investments involve risk, and past performance does not guarantee future results. We recommend consulting a financial advisor before making any investment decisions.
More like this


Written by

Andrew Kamsky
Andrew Kamsky is a Bitcoin analyst. He spent a decade in traditional finance across a Big Four firm and a listed fintech bank before going deep on Bitcoin full-time.