












Quick summary
Bitcoin trades near $84,084, about 33 percent below its $126,156 all time high
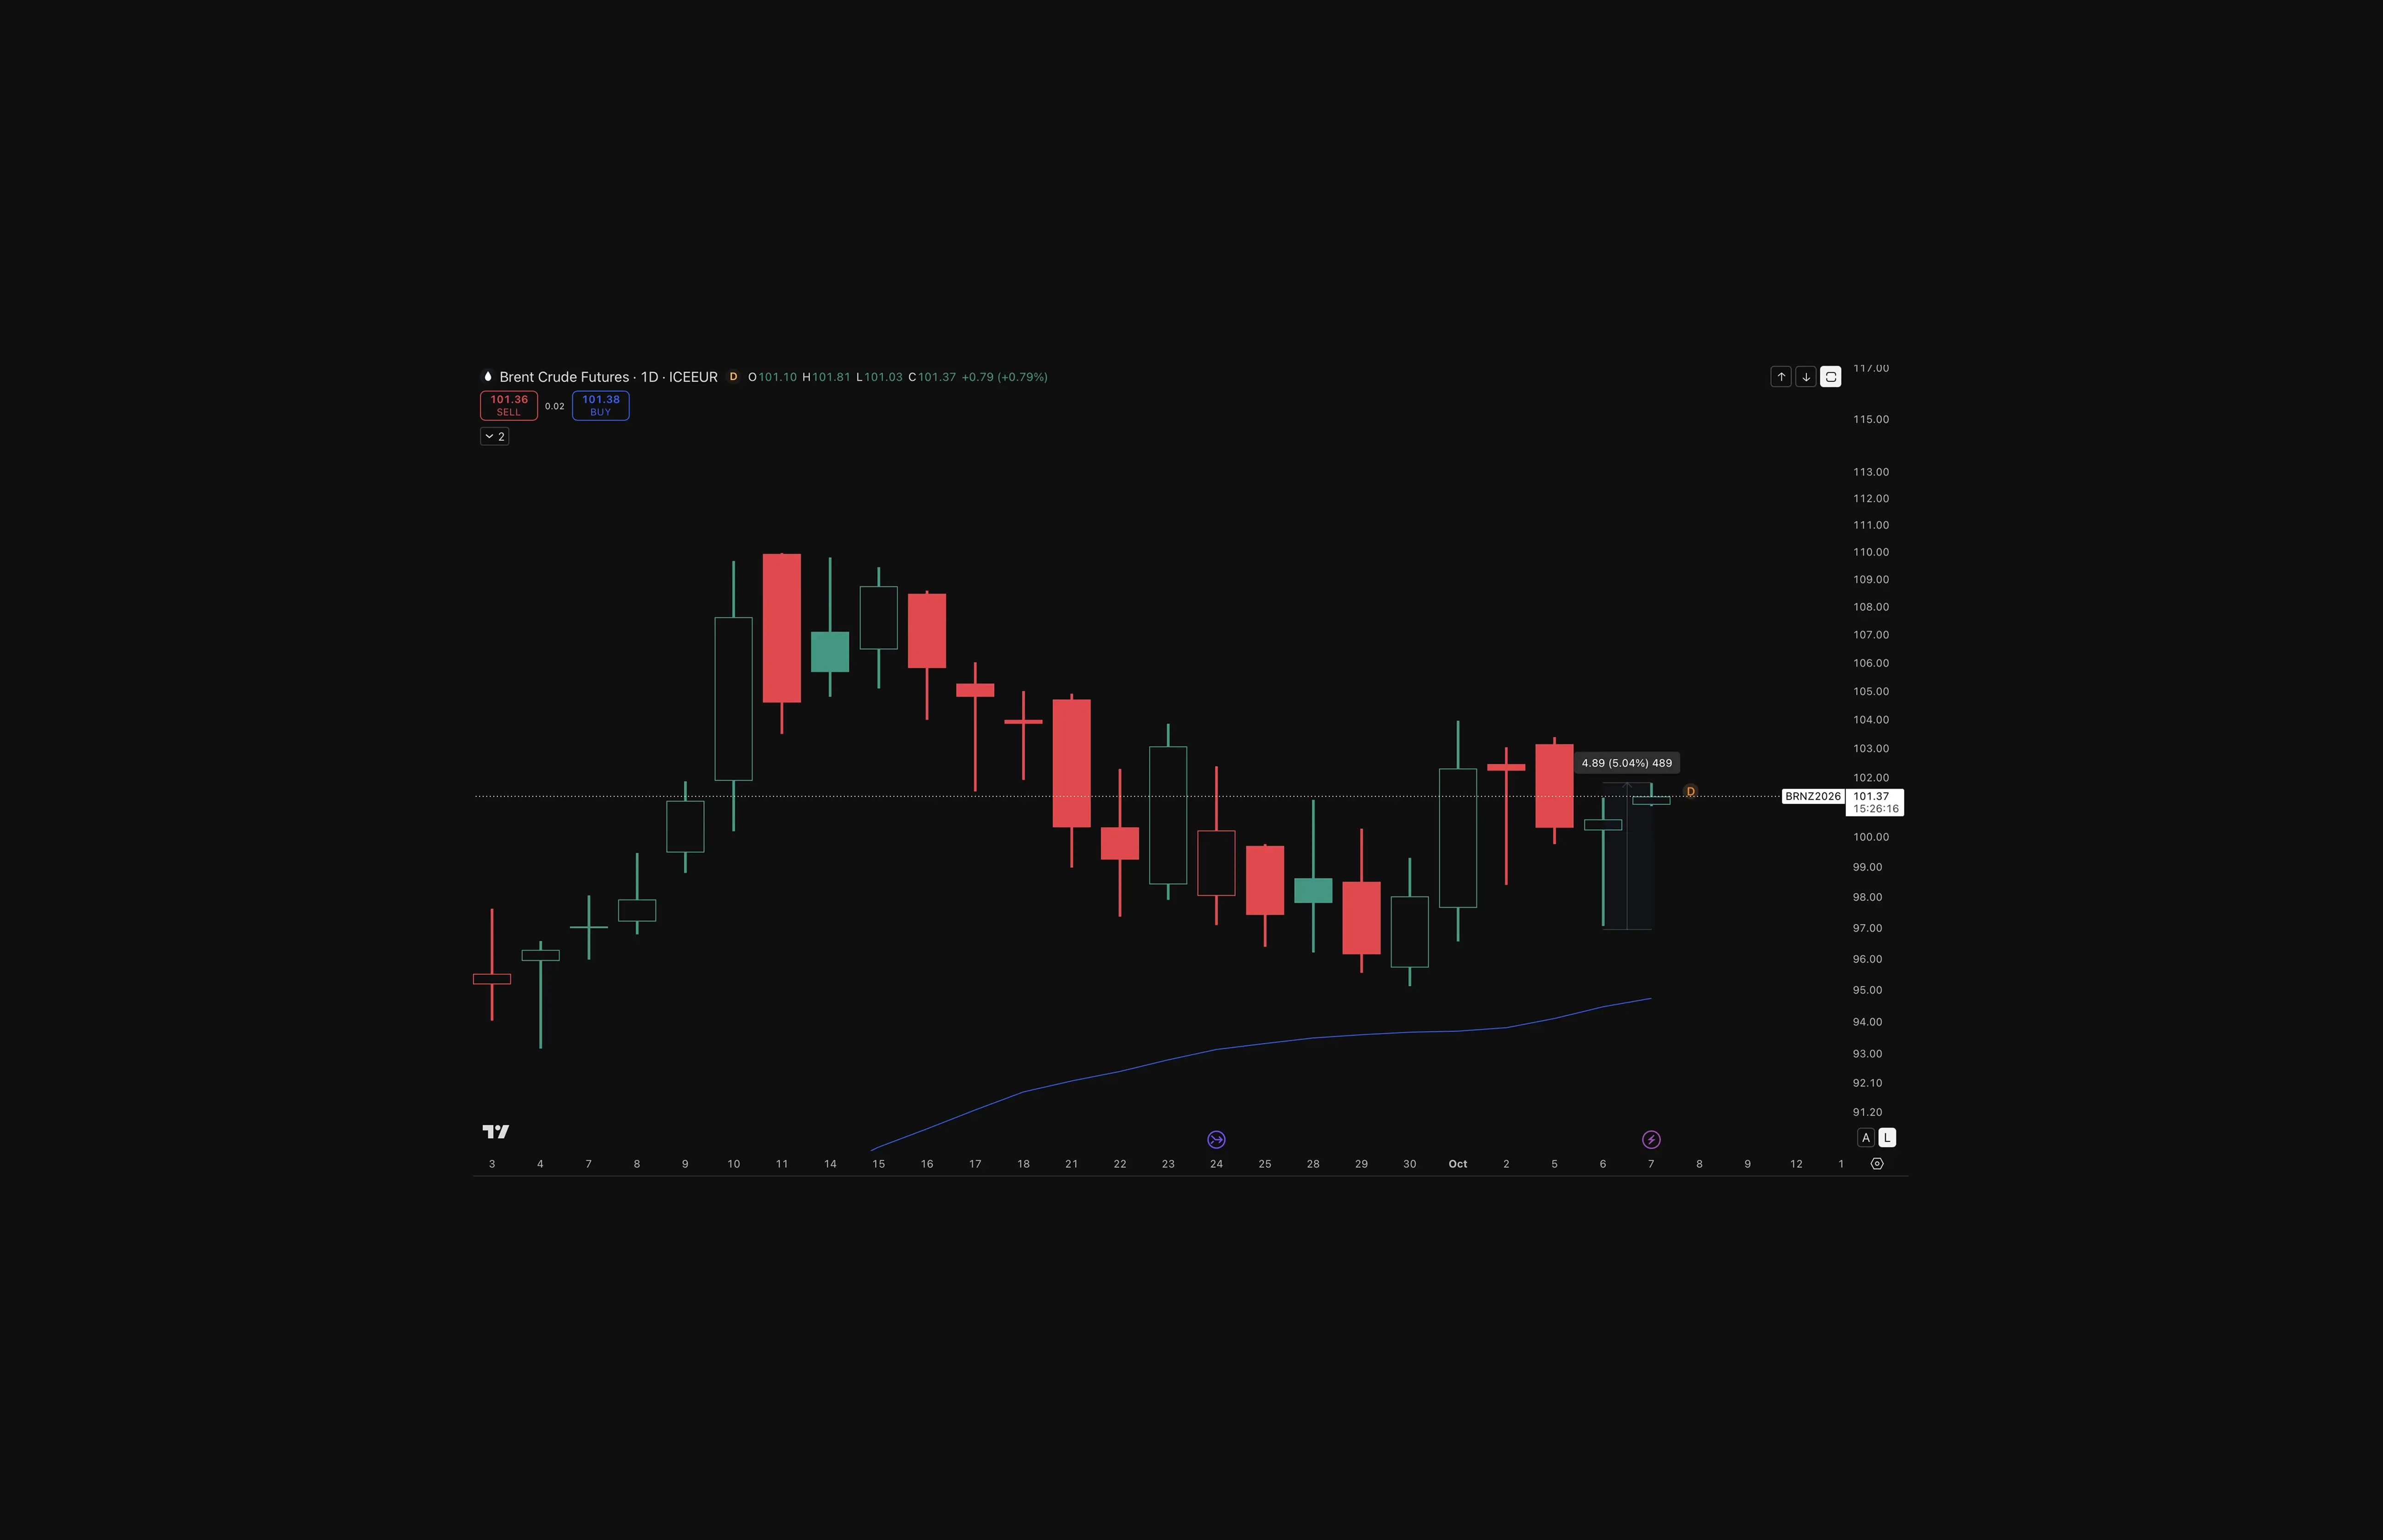
Iranian tanker attacks lifted Brent above $101 and 10 year yields to 5.31 percent
Spot Bitcoin ETFs saw $172.9 million net inflows, dominated by IBIT’s $536.2 million intake
Spot buyers turned more aggressive as futures open interest fell and funding costs rose
Bitcoin traded at $84,084 at 05:02 UTC on October 7, 2026, down 1.71% from the prior close and 33% below its all-time high of $126,156. Iranian attacks on tankers lifted oil, Treasury yields and the dollar, and BTC briefly dipped to between $83,700 and $83,840 before steadying above $84,000. ETF flows, trend indicators and October's seasonal record are set out below.
Market thesis: Macro pressure is testing a Bitcoin trend that still holds above its 200-day average.
Bitcoin vs. Rising Oil and Yields: ETF Flows Stay Net Positive
Oil, Treasury yields and the dollar moved higher together on October 7, while ETF flows over the prior five sessions stayed net positive:
Oil led the move: Brent rose almost 1% to about $101.50 a barrel after Iran stepped up tanker attacks in the Strait of Hormuz, per CoinDesk.
Yields and the dollar followed: The 10-year Treasury yield climbed three basis points to 5.31%, and the dollar strengthened against every other Group-of-10 currency in the same report.
A watched level gave way: BTC traded near $86,600 on October 6, then fell early on October 7 to a low of about $83,840 in CoinDesk's data. The BTC price sits under the $84,000 line FxPro had called a win for bears. FxPro sees a crack of $83,000 opening a quick path toward $80,000.
Fed minutes are due: The Fed raised rates by a quarter point in September, and minutes from that meeting are scheduled for release on October 7. LVRG Research analyst Dan Khus said traders will check whether the notes sound patient or point to another increase.
Spot Bitcoin ETF flows from September 30 to October 6, by fund:
ETF | Flow |
IBIT | $536.2M |
FBTC | -$231.5M |
ARKB | -$92.9M |
GBTC | -$31.4M |
Other eight funds | -$7.5M |
All 12 tracked funds | $172.9M |
IBIT carried the total: IBIT took in $536.2M, against combined outflows of $355.8M from FBTC, ARKB and GBTC.
Spot buyers returned as derivatives eased: In Glassnode's weekly snapshot for the week to October 4, spot cumulative volume delta moved from -$102.8M to +$33.2M. Futures open interest fell from $38.0B to $36.6B, and long-side funding rose from $926.4K to $1.5M. Cumulative volume delta tracks taker aggression, so the flip shows buyers acting more aggressively without measuring new capital.
Treasury buying stayed small: Genius Group said it bought 10 BTC for about $854,000, at an average of $85,364, between October 2 and 5. The purchases resumed after a court ruling on August 31 vacated an injunction that had blocked them.
Cumulative volume delta adds up the value of trades where buyers paid the seller's asking price and subtracts trades where sellers accepted the buyer's bid, so a positive reading means buyers were the more eager side, not that more new money arrived.
Coinjuice Lens: Market Structure
Oil, yields and the dollar reach Bitcoin through rate expectations, a link Coinjuice's research on how Fed policy affects Bitcoin traces through rates. September's minutes are scheduled for release on October 7, with the 10-year yield at 5.31% and Brent near $101.50. Against that backdrop, ETF flows turned higher on October 6. Macro pressure is testing a Bitcoin trend that still holds above its 200-day average.
Readers looking to hold through macro pressure without a liquidation price can start with the Coinjuice ebook, Bitcoin Trading Without Leverage, or go deeper with a Coinjuice subscription, where we start and complete trades and you will learn to snipe them independently in our private group.
News Behind Today's Read
Bitcoin dips below $84,000 as oil jumps on Iranian tanker attacks (CoinDesk). Source for CoinDesk's overnight low near $83,840, Brent at about $101.50, the 5.31% 10-year yield, FxPro's $84,000 and $83,000 levels and the pending Fed minutes.
Why bitcoin is down 'just' 32% a year after its record high of $126,000 (CoinDesk). Source for the one-year drawdowns after the 2013, 2017 and 2021 peaks and Ardern's comment on downside protection.
BTC Market Pulse: Week 41 (Glassnode). Source for the spot cumulative volume delta, futures open interest and long-side funding readings for the week to October 4.
Genius Group Recommences Bitcoin Treasury Purchases (Genius Group). Source for the 10 BTC purchase, its $85,364 average price and the August 31 court ruling.
Crypto Fear & Greed Index (Alternative.me). Source for the reading of 71 on October 7 and 73 the day before.
Continue the read: Oct. 6 · Oct. 5 · Oct. 3
Market Snapshot
Asset | Price | Distance from ATH |
BTC | $84,084 | 33.35% below ATH ($126,156) |
ETH | $2,610 | 47.24% below ATH ($4,946) |
ETH/BTC | 0.03104 | Spot ratio, DefiLlama |
DeFi TVL | $94.33B | Live total TVL at 06:31 UTC, DefiLlama |
BTC, ETH and ETH/BTC are as of 05:02 UTC, October 7, 2026 (partial daily candle); DeFi TVL is the live total at 06:20 UTC. Source: DefiLlama. ETF flows are DefiLlama-tracked: the fund table covers September 30 to October 6 across all 12 tracked funds, the "other eight funds" row is a Coinjuice calculation, and the October 6 figure posted after an initial incomplete print.
This article was developed with the support of artificial intelligence tools as part of Coinjuice's editorial process and reviewed by our editorial team before publication.
Disclaimer
The information provided in this article is for informational purposes only. It is not intended to be, nor should it be construed as, financial advice. We do not make any warranties regarding the completeness, reliability, or accuracy of this information. All investments involve risk, and past performance does not guarantee future results. We recommend consulting a financial advisor before making any investment decisions.
FAQ
Why did Bitcoin fall below $84,000 on October 7, 2026?
Bitcoin fell early on October 7 to a low of about $83,840 in CoinDesk's data and $83,702 in DefiLlama's. Iranian attacks on tankers in the Strait of Hormuz lifted oil to about $101.50 a barrel, pushed the 10-year Treasury yield to 5.31% and strengthened the dollar, per CoinDesk. Higher yields and a firmer dollar tend to weigh on Bitcoin because dollar assets look more attractive by comparison. Minutes from the Fed's September meeting were scheduled for release the same day.
Is Bitcoin above its 200-day EMA on October 7, 2026?
Yes. Daily-chart data from 04:00 UTC on October 7 put BTC at $84,139, which is 11.78% above a rising 200-day EMA of $75,271.08. The daily MACD histogram was negative at -$223.92, and Bollinger Band width of 7.56% sat below its 60-day median of 14.74%. The longer trend and short-term momentum pointed in different directions.
How has Bitcoin performed in October historically?
Bitcoin closed higher in ten of thirteen Octobers from 2013 through 2025, with an average change of +19.10% and a median of +13.76%. Week 1 averaged +1.10%, while weeks 2 to 4 averaged between +3.90% and +4.86%. Individual years ranged from +53.81% to -11.63%, so the average does not predict any single October.
How has Bitcoin performed since the Fear & Greed Index reached 69 on September 1, 2026?
Bitcoin was $77,195 in the study's September 1 snapshot and traded at $84,084 on October 7, a gain of 8.9% over 36 days. Measured from the settled September 1 close of $77,411, the gain is 8.6%. Across 19 completed historical readings of 69, the 21-day average return was +10.2% and the two-month average was +22.7%. Results after 2024 were weaker than in earlier cycles, and the sample is small and clustered.
Disclaimer
The information provided in this article is for informational purposes only. It is not intended to be, nor should it be construed as, financial advice. We do not make any warranties regarding the completeness, reliability, or accuracy of this information. All investments involve risk, and past performance does not guarantee future results. We recommend consulting a financial advisor before making any investment decisions.
More like this
Written by

Andrew Kamsky
Andrew Kamsky is a Bitcoin analyst. He spent a decade in traditional finance across a Big Four firm and a listed fintech bank before going deep on Bitcoin full-time.