


Quick summary
Traditional RSI 30/70 reversal strategies don’t work well for Bitcoin and Ethereum; the 50 level is more effective for identifying trends
In bull markets, RSI typically stays above 50, while in bear markets it remains below for extended periods
Bitcoin (~42) and Ethereum (~45) are currently trading near the critical RSI 50 inflection zone
Above 50, maintain a bullish bias and buy pullbacks; below 50, stay defensive; at 50, wait for rejection before expecting lower prices
Most traders lose money using Relative Strength Index (RSI) the way it's taught in books waiting for "oversold" at 30 to buy and "overbought" at 70 to sell. If trading Bitcoin or Ethereum this way, the problem becomes obvious fast: these assets stay "overbought" for months during bull runs, and "oversold" levels become traps during bear markets.
There's a better way to read momentum and it's hiding at the RSI 50 level.
Analysis of Bitcoin and Ethereum market behavior from 2018-2025 reveals that RSI works almost entirely opposite to its traditional interpretation during trending markets. Instead of using RSI to predict reversals, successful momentum traders use it to identify which regime the market is in: bullish or bearish. The dividing line? RSI 50.
The Problem With 30/70 Levels in Bitcoin Trading
Traditional RSI interpretation was developed for stocks in the 1970s. It assumes mean reversion that prices bounce between "cheap" and "expensive." Bitcoin doesn't normally work that way as:
Bull markets: Driven by a buying frenzy.
Rising prices: Higher prices attract more participants into the market.
Participation: Increased participation intensifies and accelerates the price move.
Feedback loop: Price and participation reinforce each other continuously.
Exhaustion point: Trends end due to structural exhaustion, not RSI or indicator signals.
Bear markets: Follow the same feedback mechanics, but in reverse.
Studies of Bitcoin trading strategies from 2018-2023 found that portfolios using RSI 30/70 as reversal signals massively underperformed buy-and-hold.
The Meaning of RSI 50 in Trending Markets
The RSI measures the ratio of upward momentum to total momentum over the past 14 periods. When RSI is above 50, recent gains are outweighing recent losses. When below 50, losses tend to be stronger.
In trending markets, which Bitcoin spends most of its time in, this creates a clear pattern:
Bull markets: RSI stays above 50, trending toward 60-90 range, for months
Bear markets: RSI stays below 50, trending toward 40-20 range, for months
The 50 line: Acts as support in uptrends, resistance in downtrends
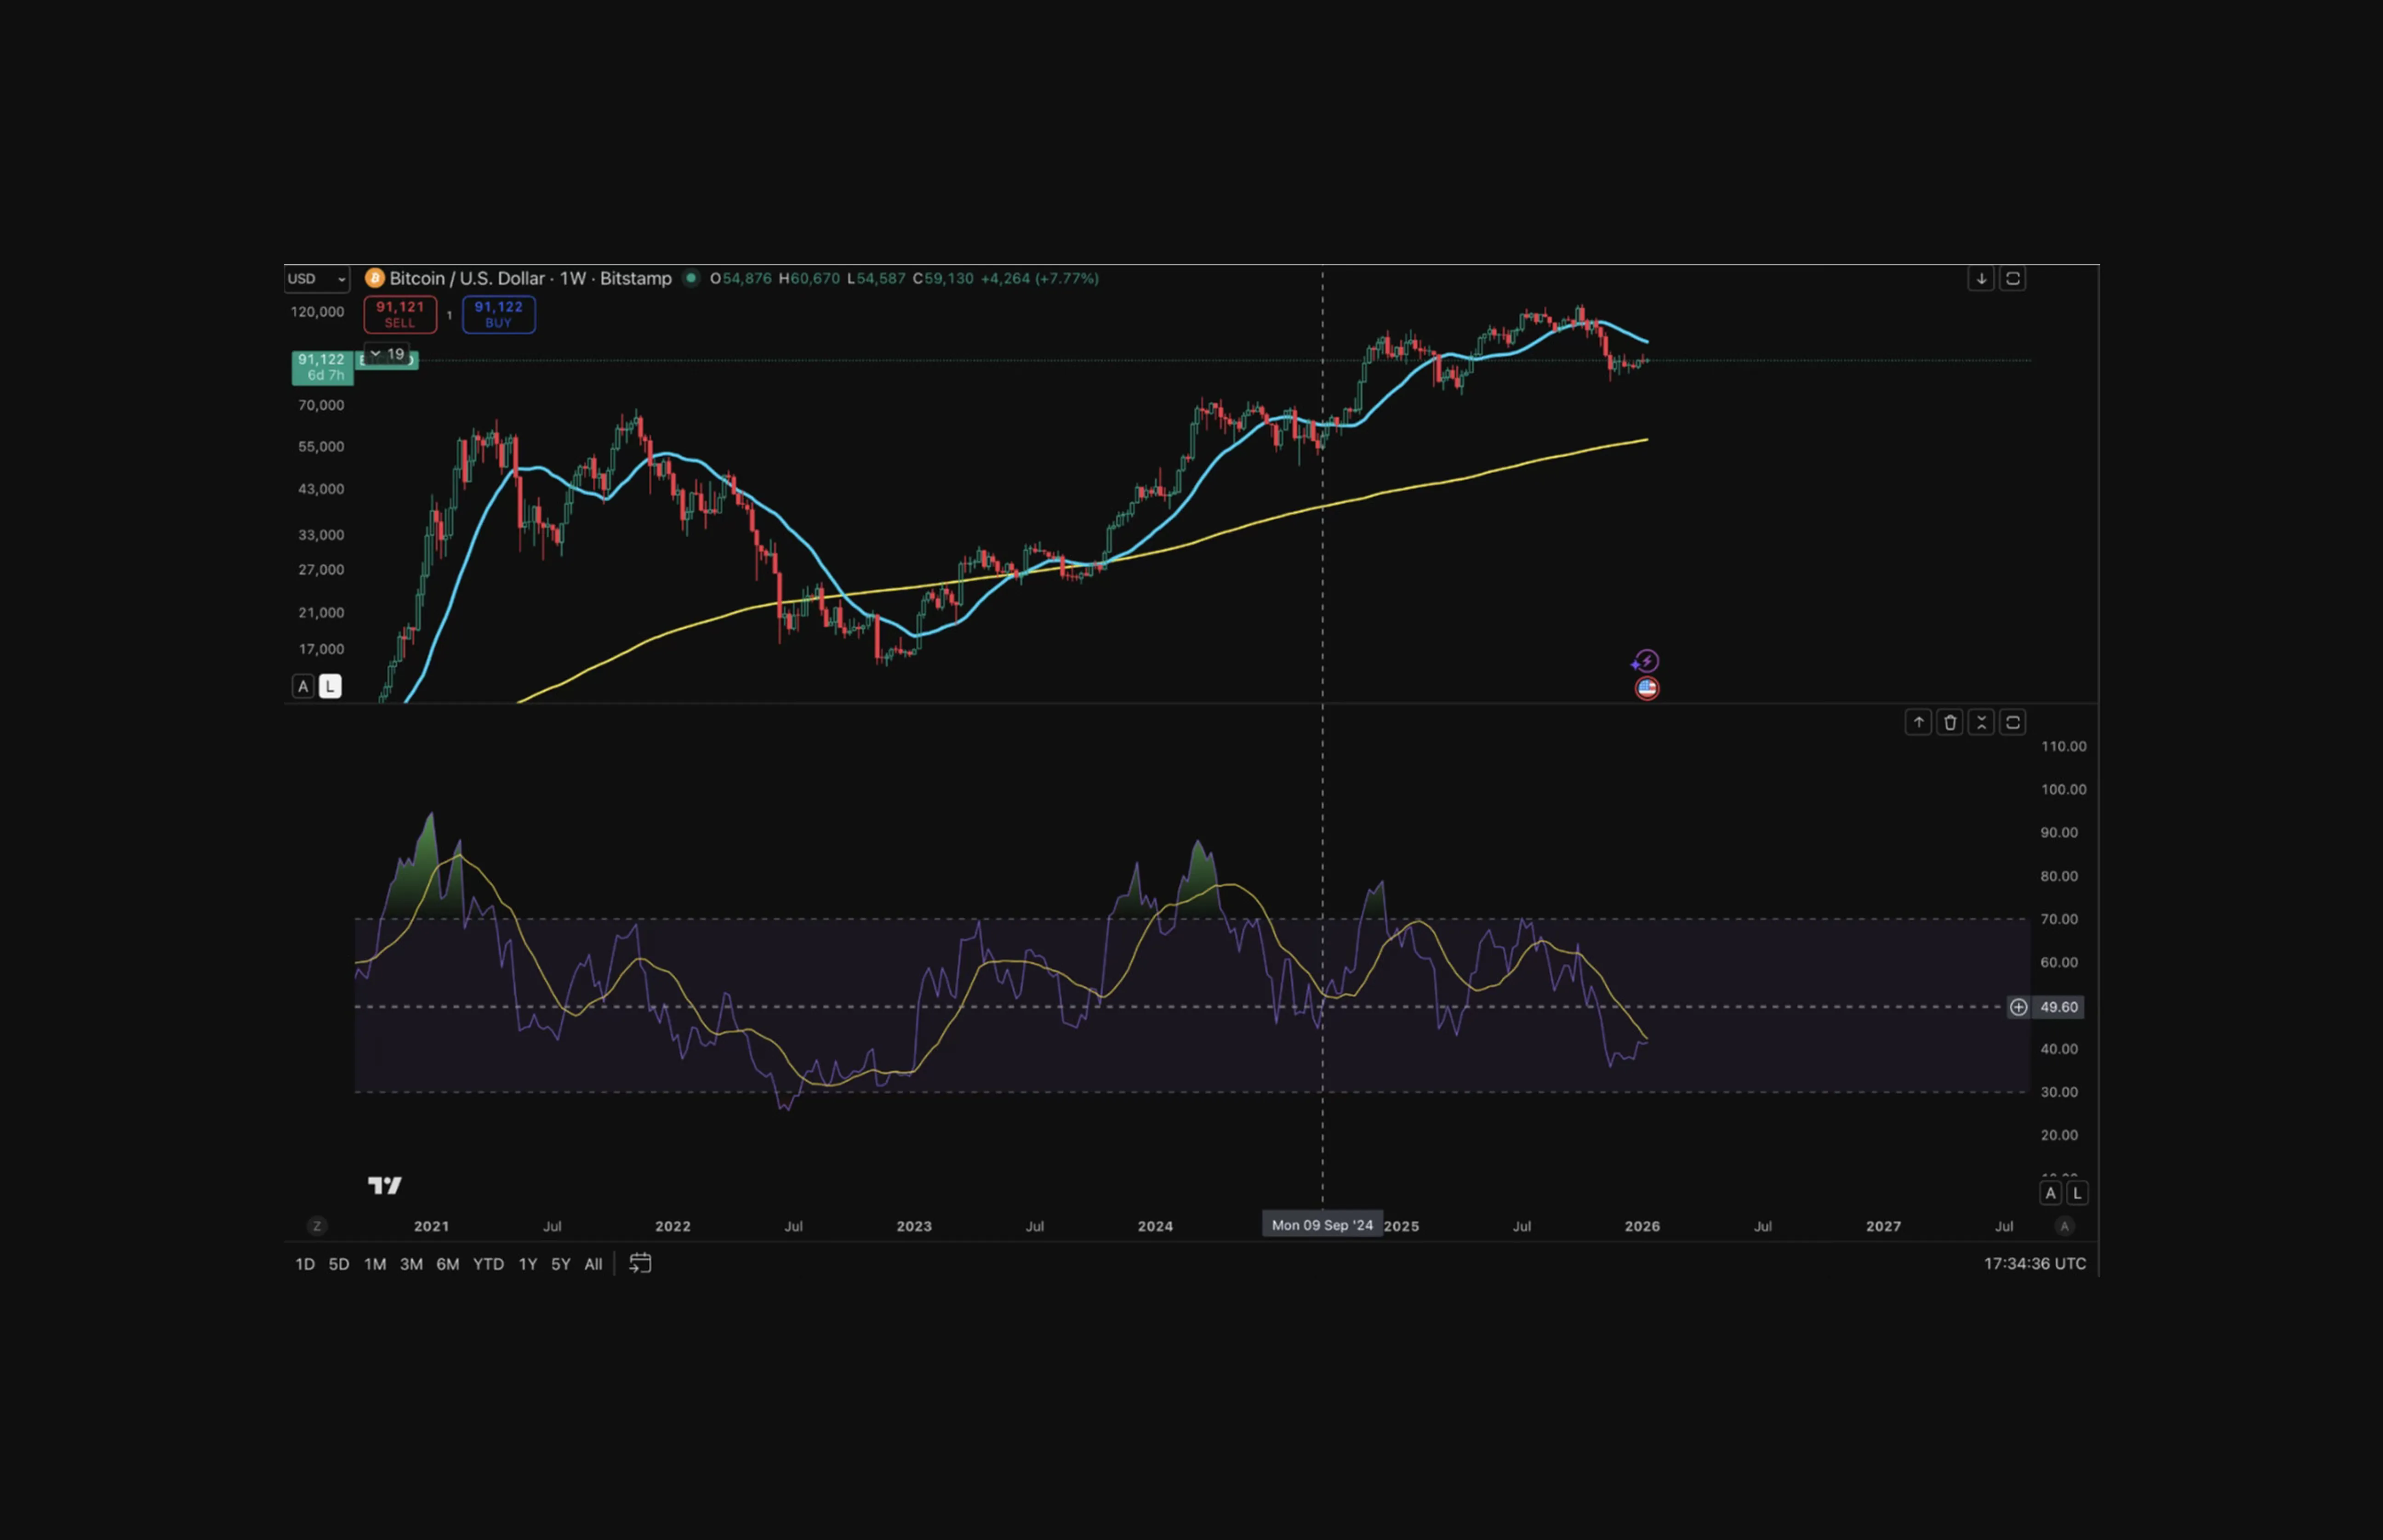
Bitcoin: Analyzing The 50-Level RSI Playbook (2020-2026)
Let's walk through Bitcoin's recent history using weekly RSI:
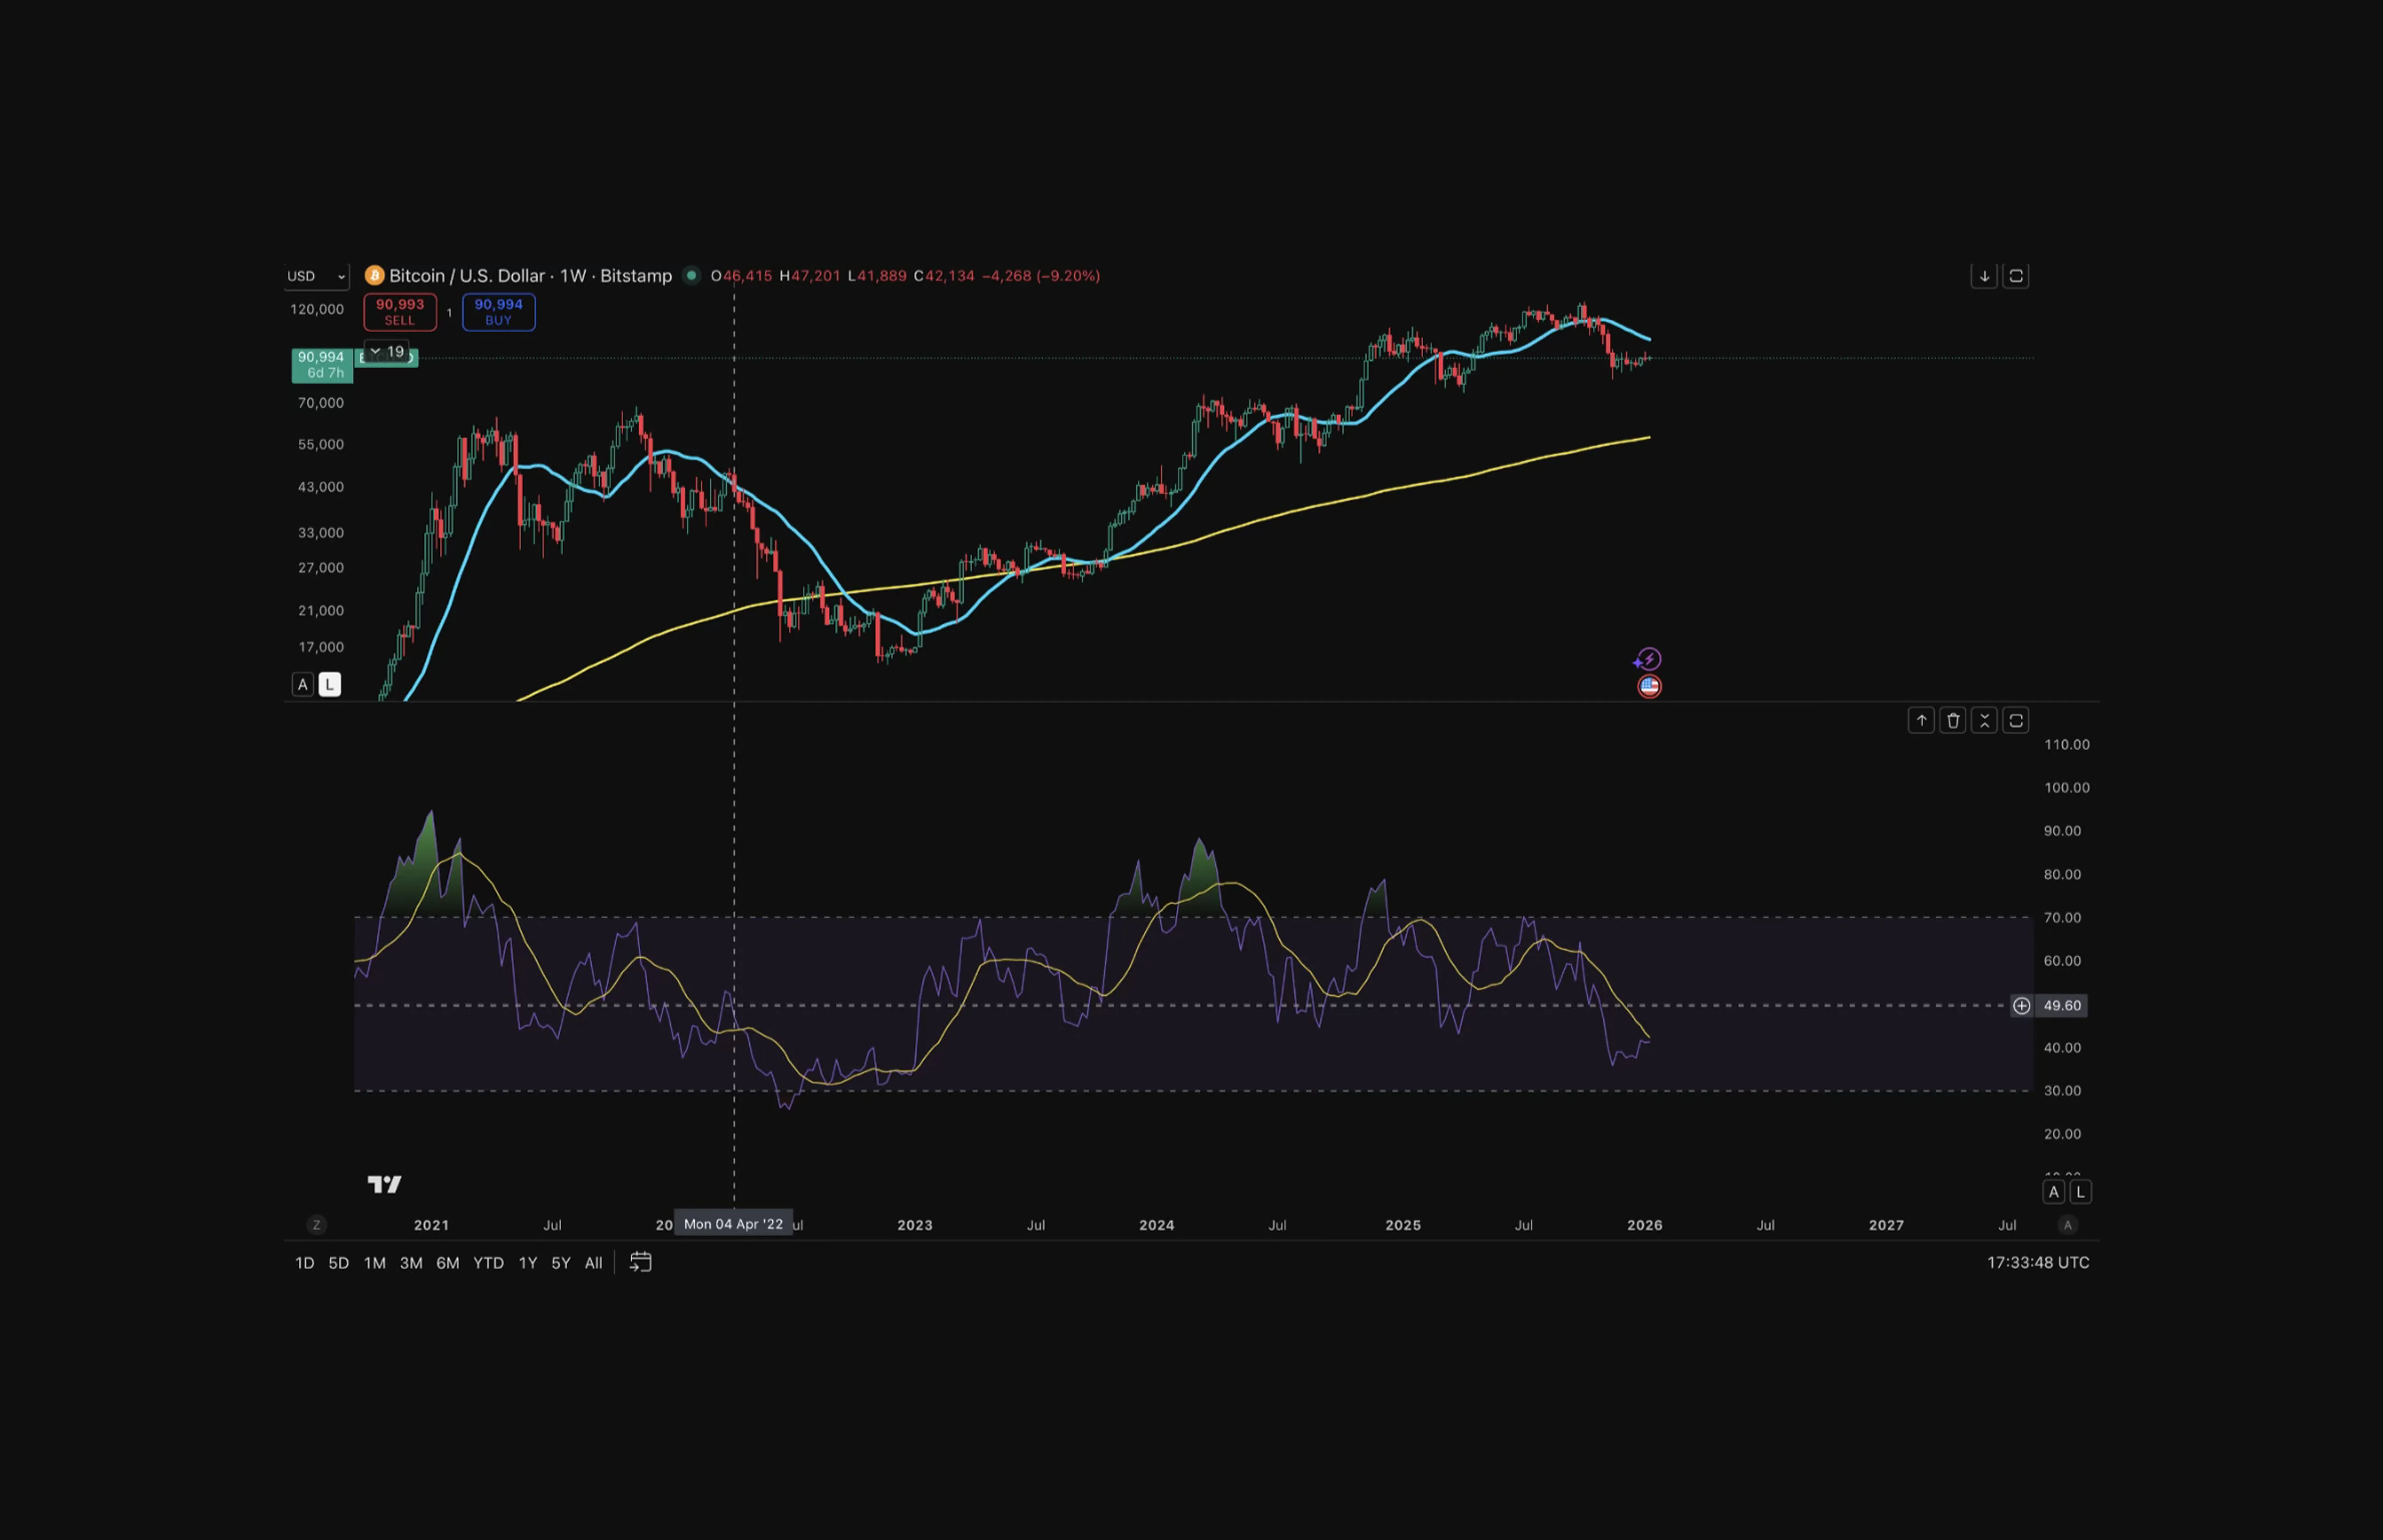
April 2022 (RSI ~50):
On April 4, 2022 price broke down as RSI slipped below 50. This was not a “buy the dip” signal—it was a change of trend confirmation. Bitcoin went on to decline from ~$47,000 to ~$16,000 over the following eight months, with RSI remaining consistently below the 50 level throughout the move until 2023.
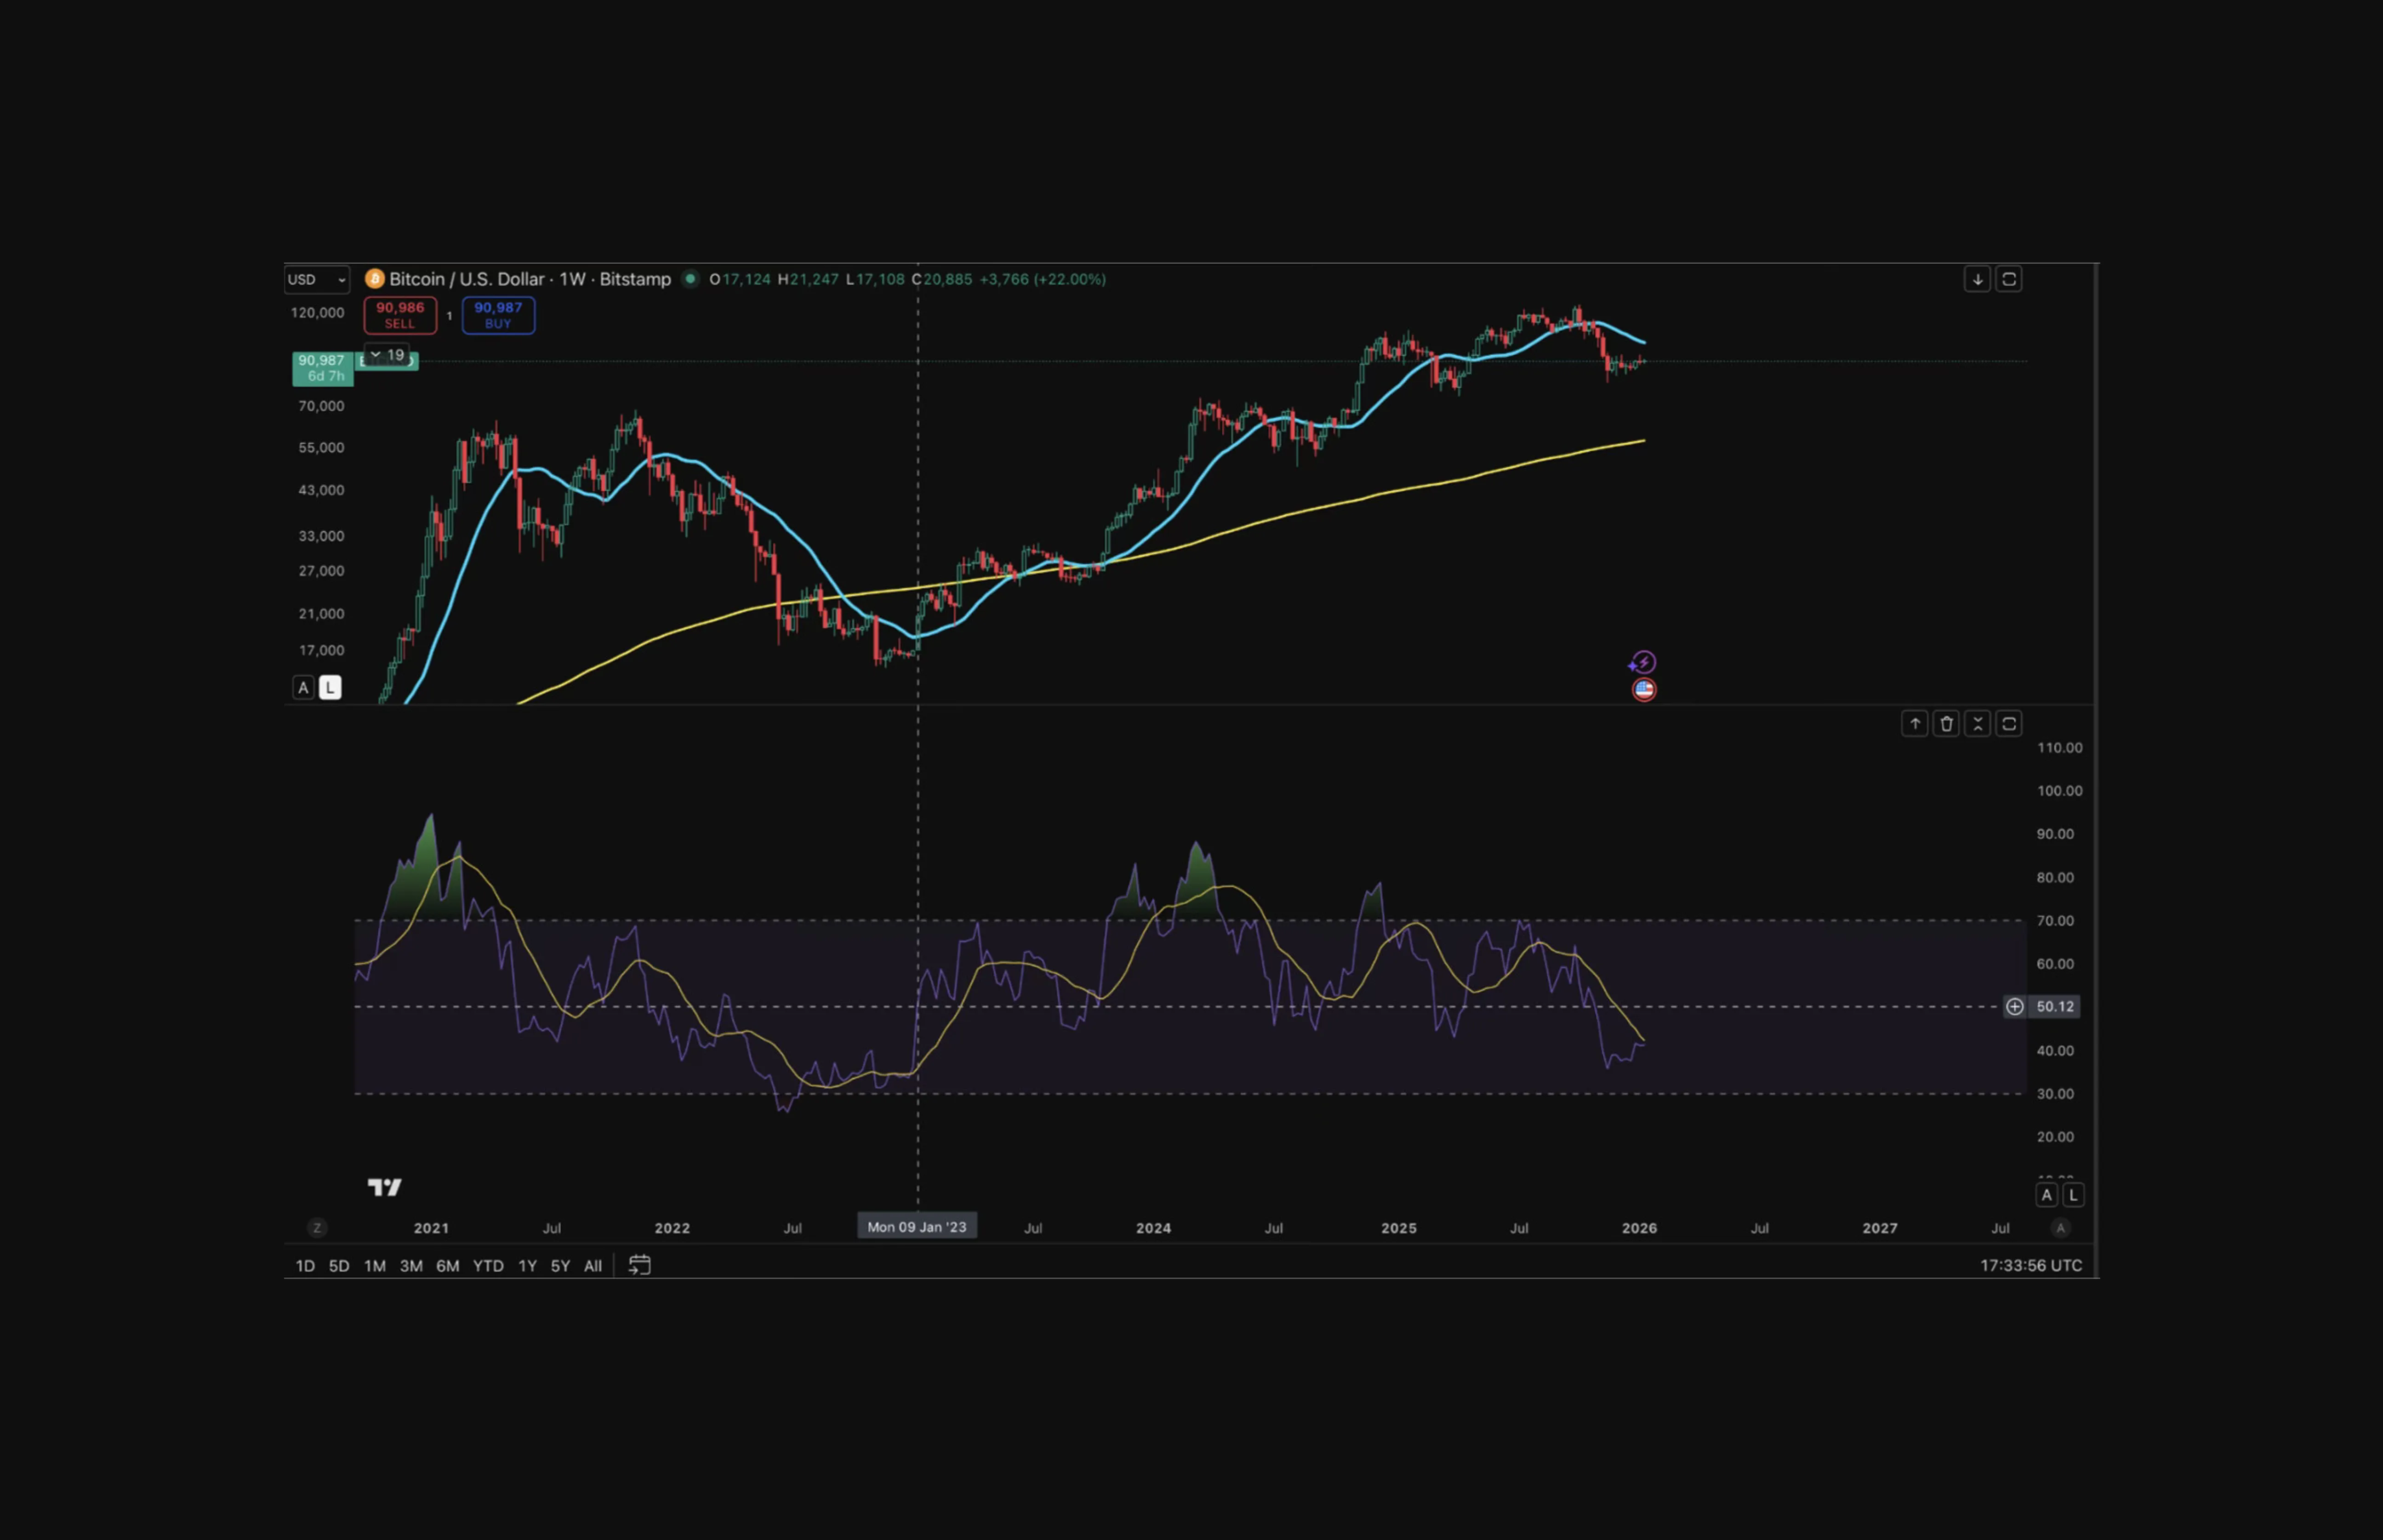
January 2023 (RSI ~50): RSI crosses back above 50 after months below. The price was around $17,000. This wasn't "overbought" it was the first sign the bear market cycle was ending. Bitcoin rallied above $100,000 over the next two years.
August-October 2023 (RSI ~50): With RSI repeatedly finding support near 50, Bitcoin confirms that bullish momentum remains intact and the broader trend is still constructive. After October 2023, the momentum extended past the 70 level touching 88 on March 04, 2024.
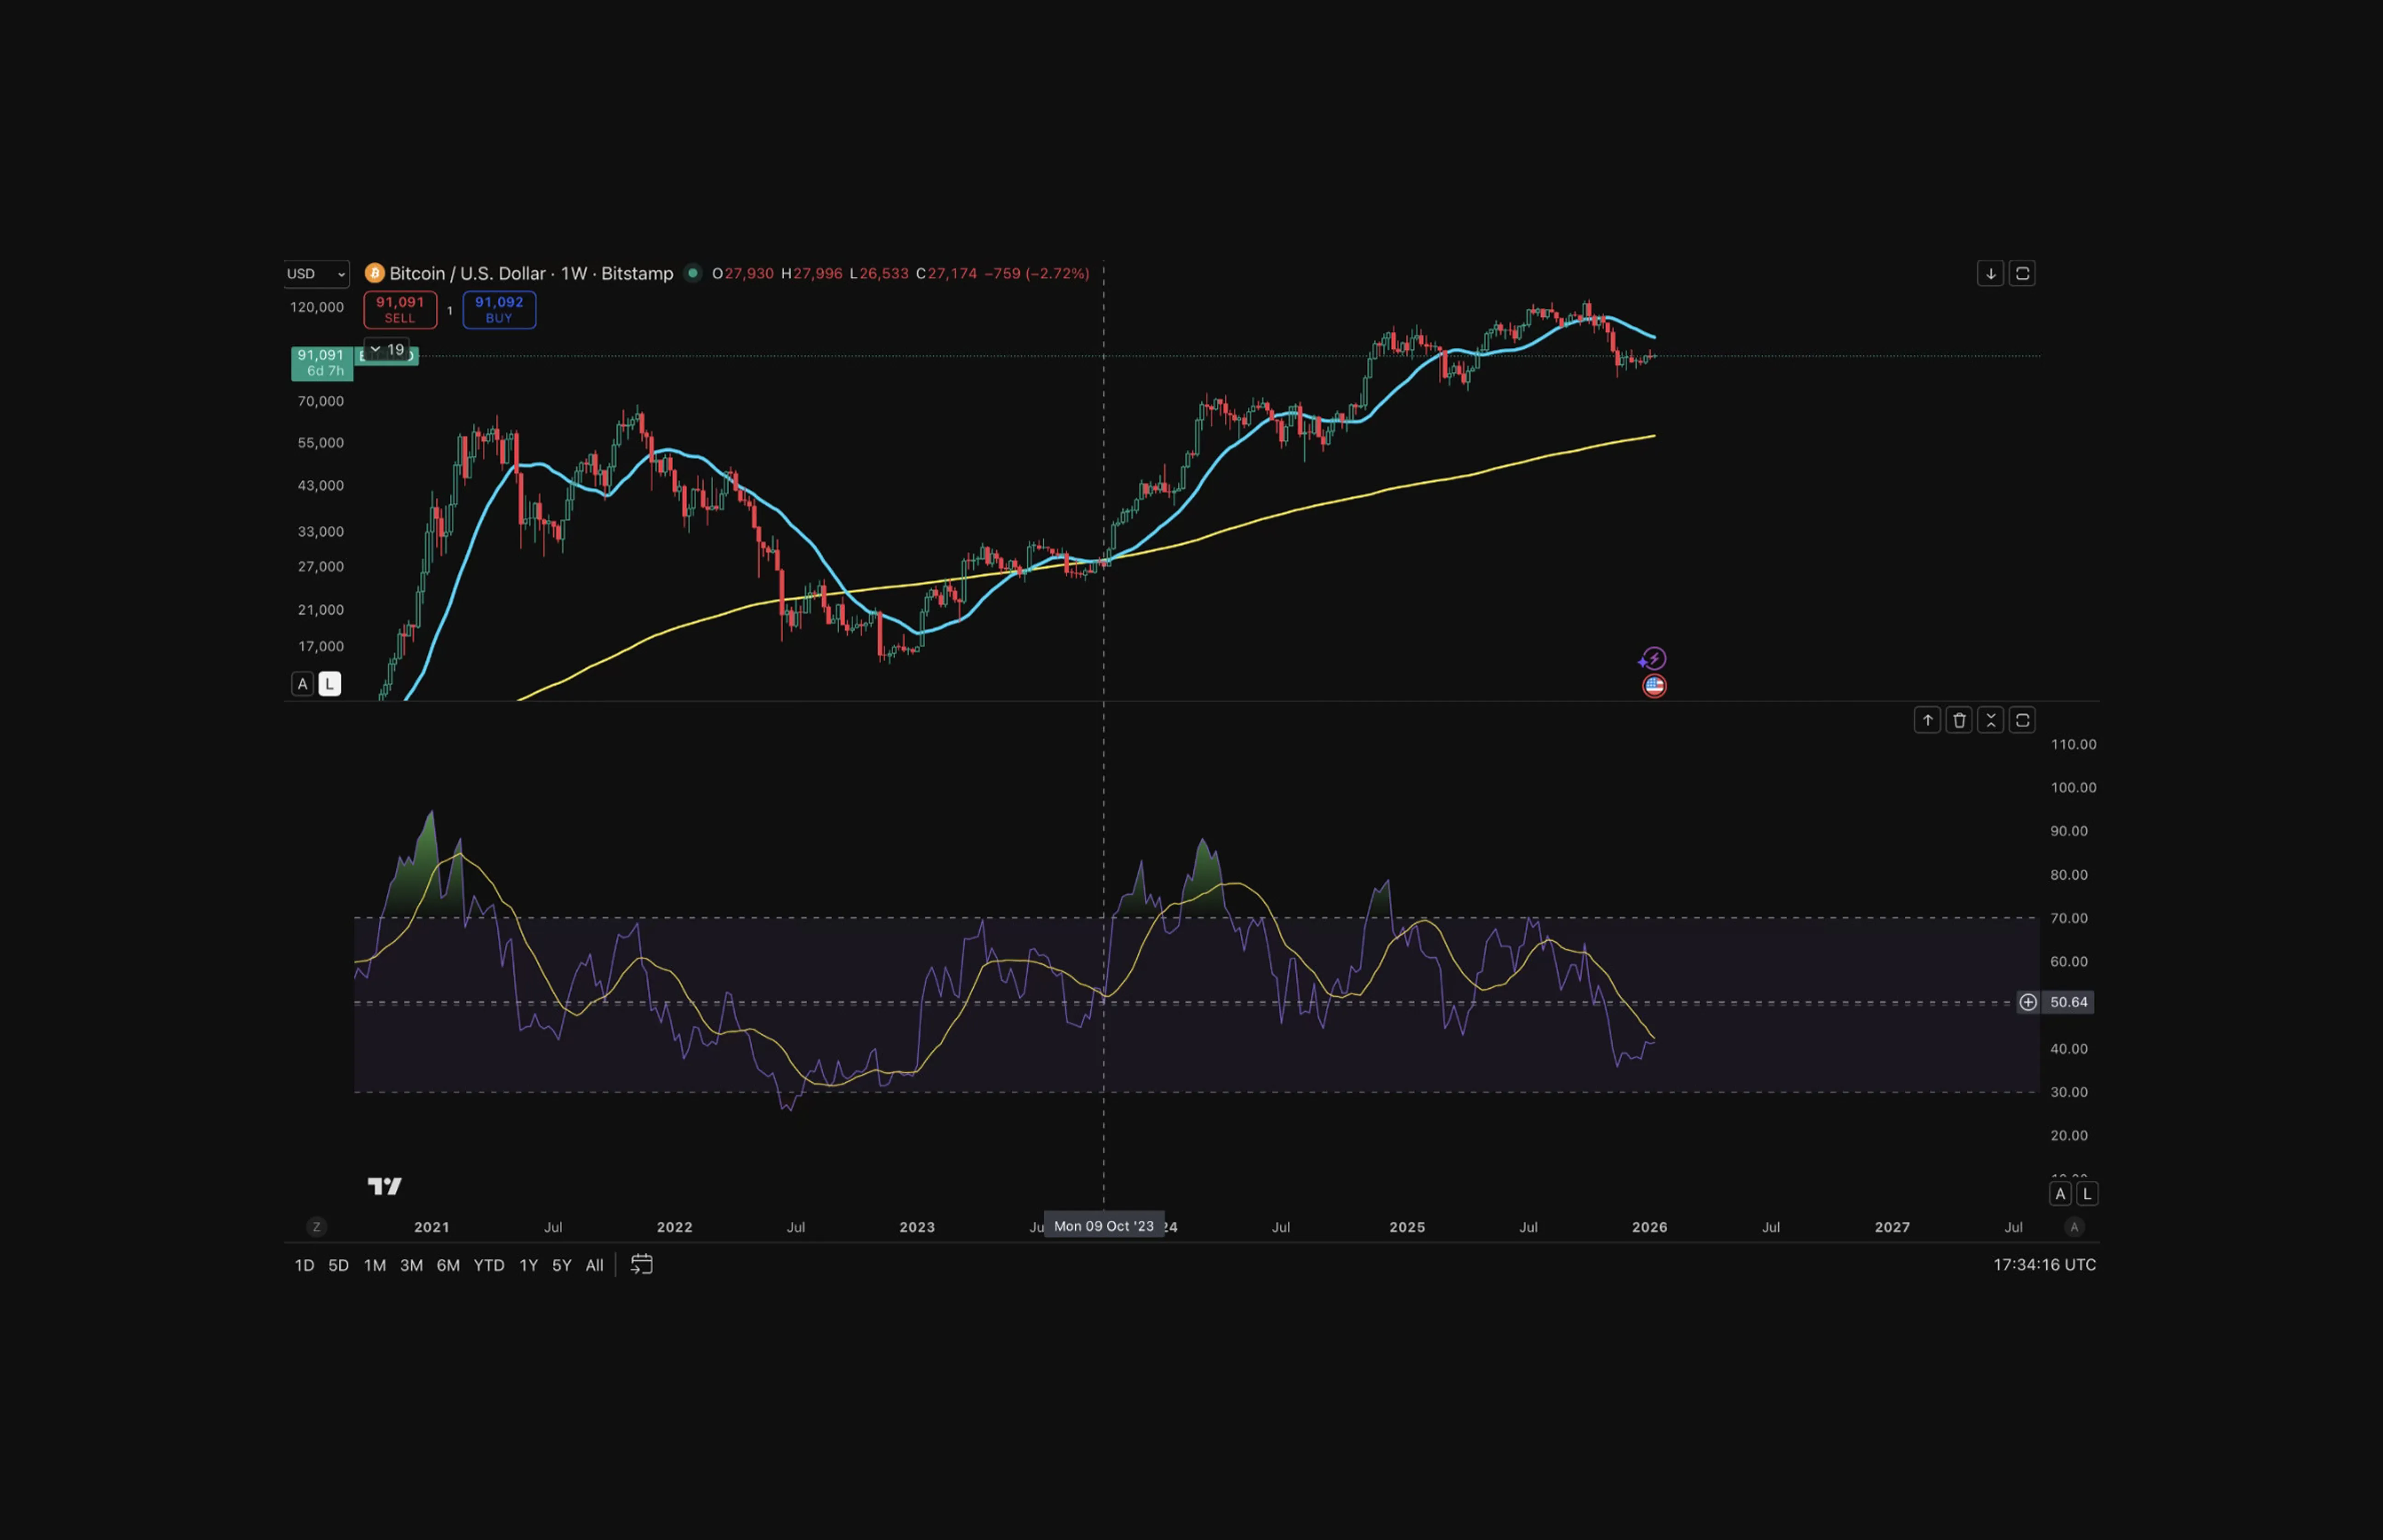
Throughout 2024-2025 bull run: RSI regularly hit the 60-80 range. Traditional traders calling it "overbought" missed months of gains.
Whilst, RSI 50-level traders stayed in position assuming the bull market was in tact
Bitcoin’s weekly RSI on January 13, 2026 has slipped into a range historically associated with bearish or late-cycle conditions. We haven’t spent meaningful time at these RSI levels during the 2024–2025 bull advance, where momentum consistently held above 50 and frequently expanded into the 60–80 zone.
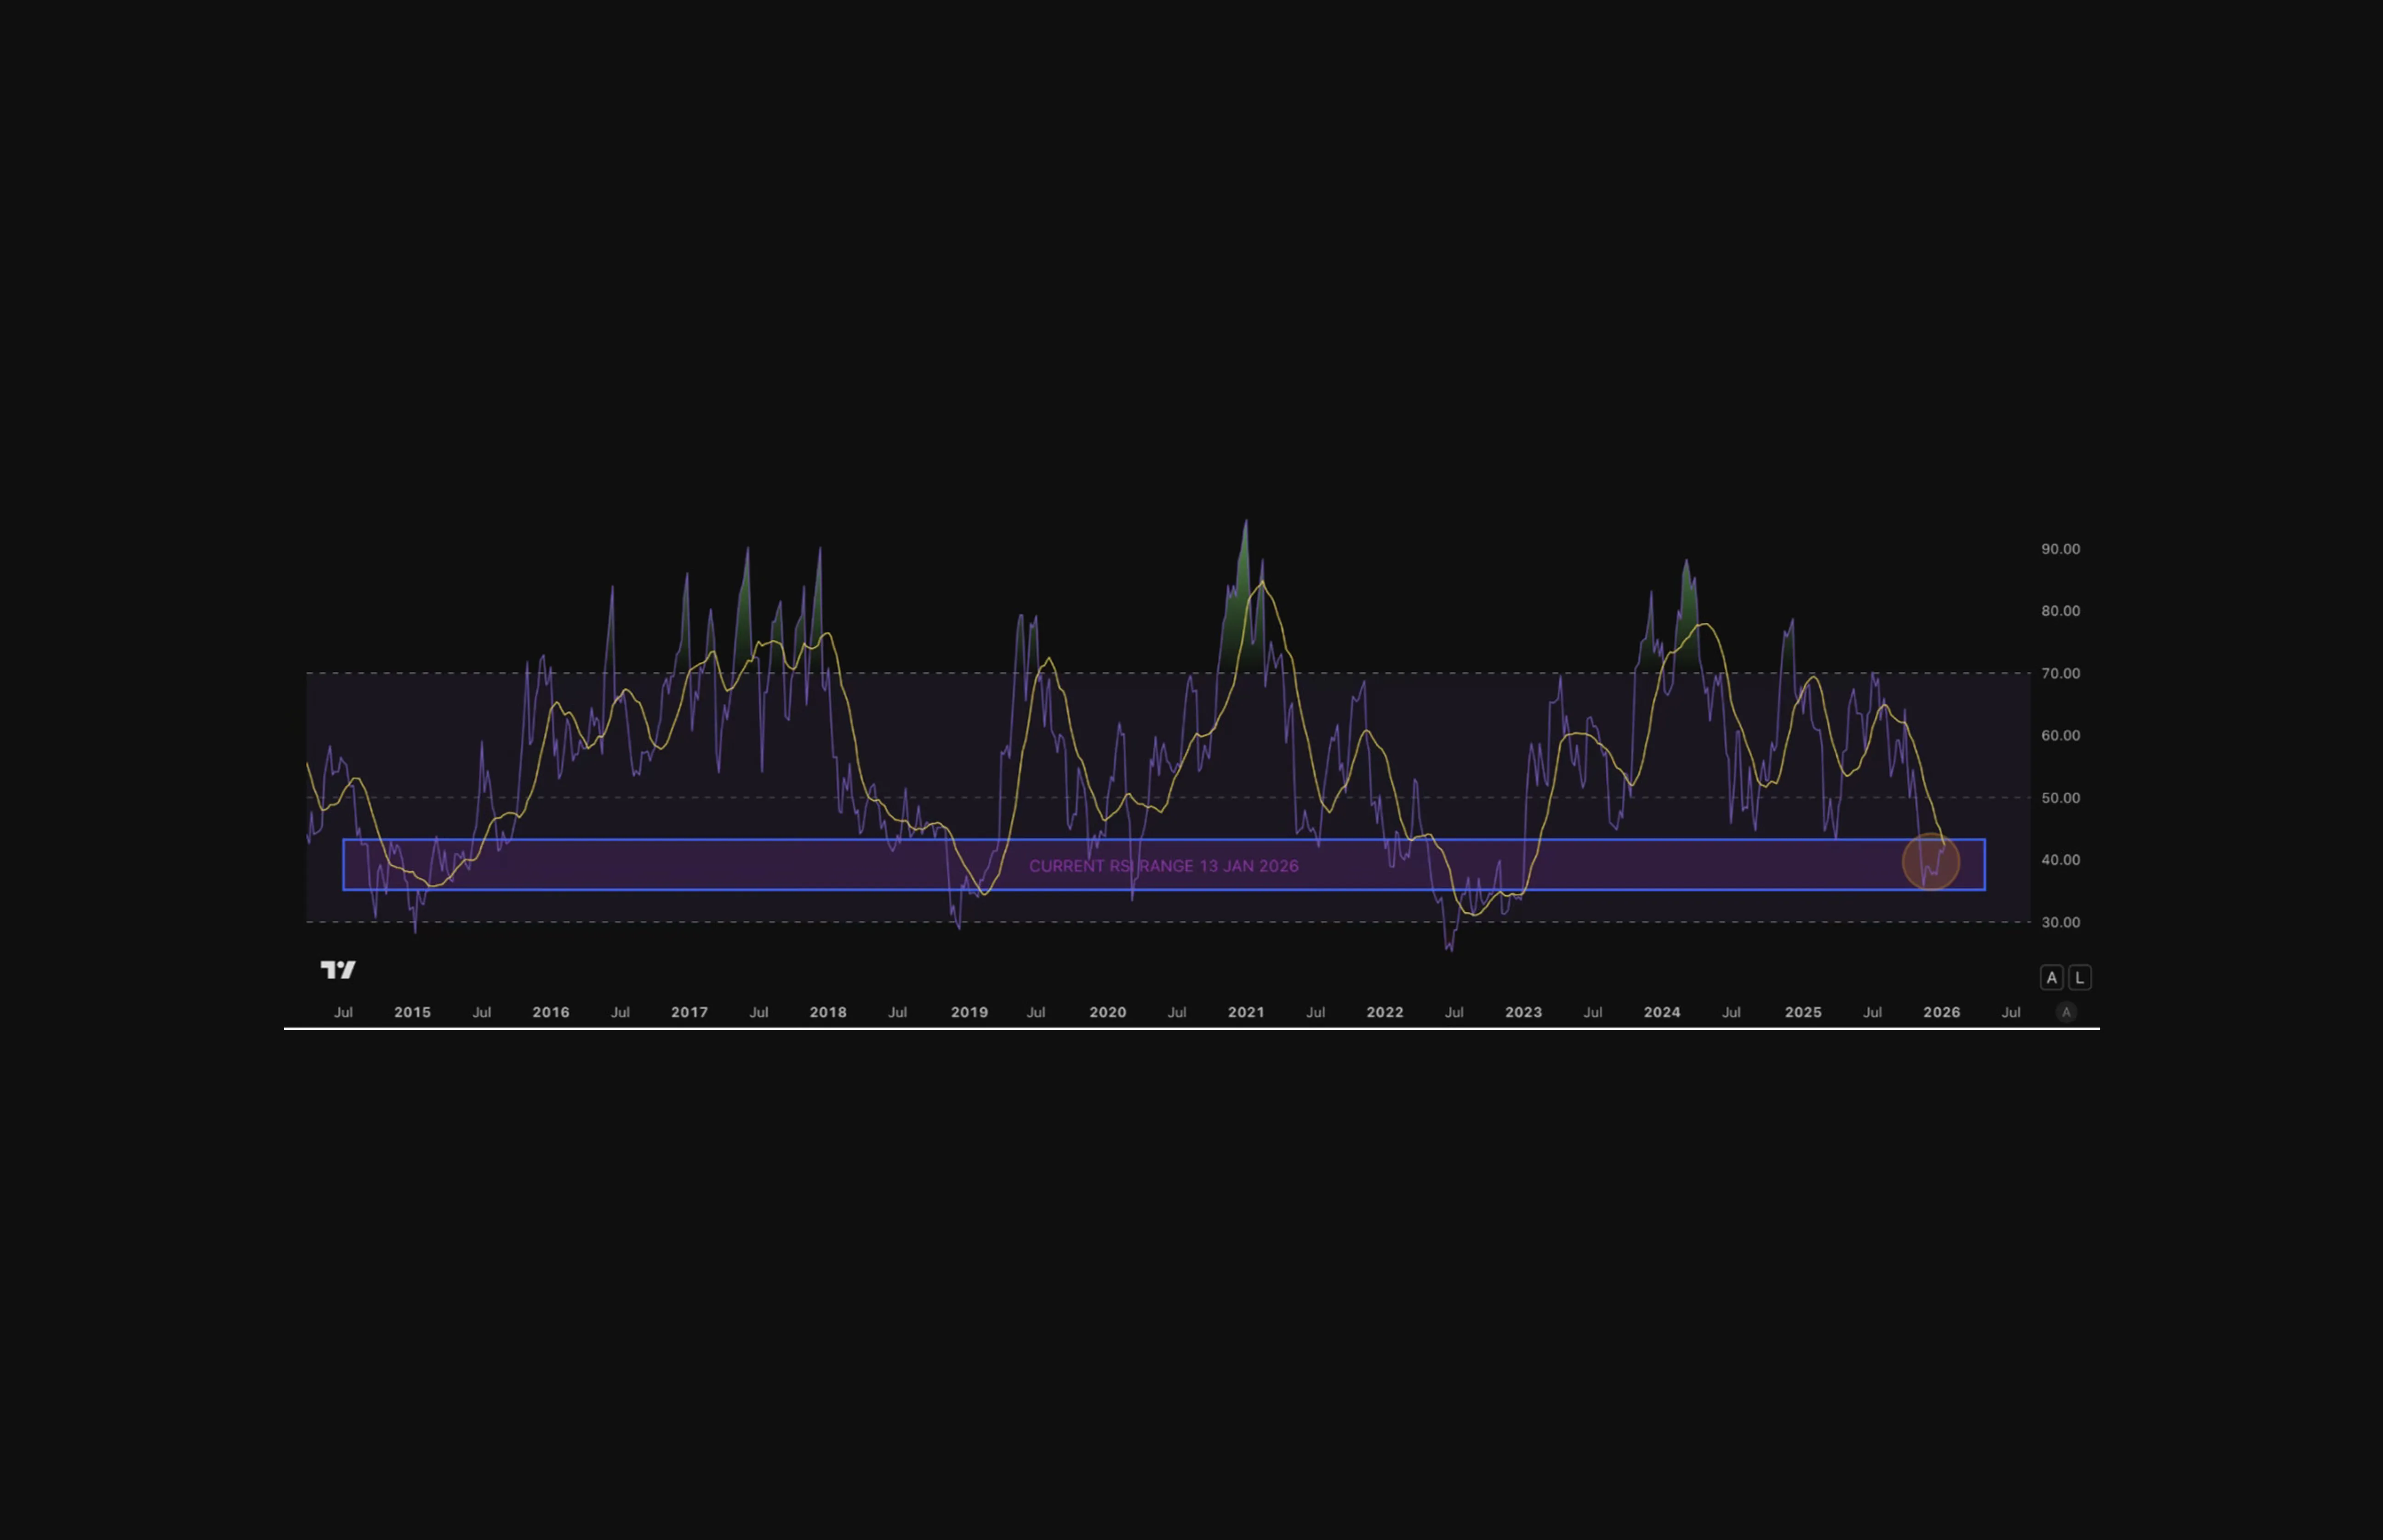
Now, momentum has shifted. RSI is no longer finding support at 50 and instead trades in a lower band (back to 2022-2023 levels, which typically reflects weaker demand, slower trend progression, and increased downside risk.
Ethereum: Same Pattern, Same Results
Ethereum's weekly RSI tells an identical story:
2020-2021 Bull Run:
In mid-2020, RSI crossed above 50 and remained elevated throughout the bull market. During this period, RSI frequently expanded into the 60-90 range as Ethereum rallied from around $200 to its peak of $4,800 in November 2021.
2021 Peak to 2022 Bear Market:
RSI dropped below 50 in January 2022 and stayed there through most of the year. This shift marked the transition from bullish to bearish momentum. Price fell from $4,800 to $900 as RSI remained consistently below the 50 level confirming the bear market was in full effect.
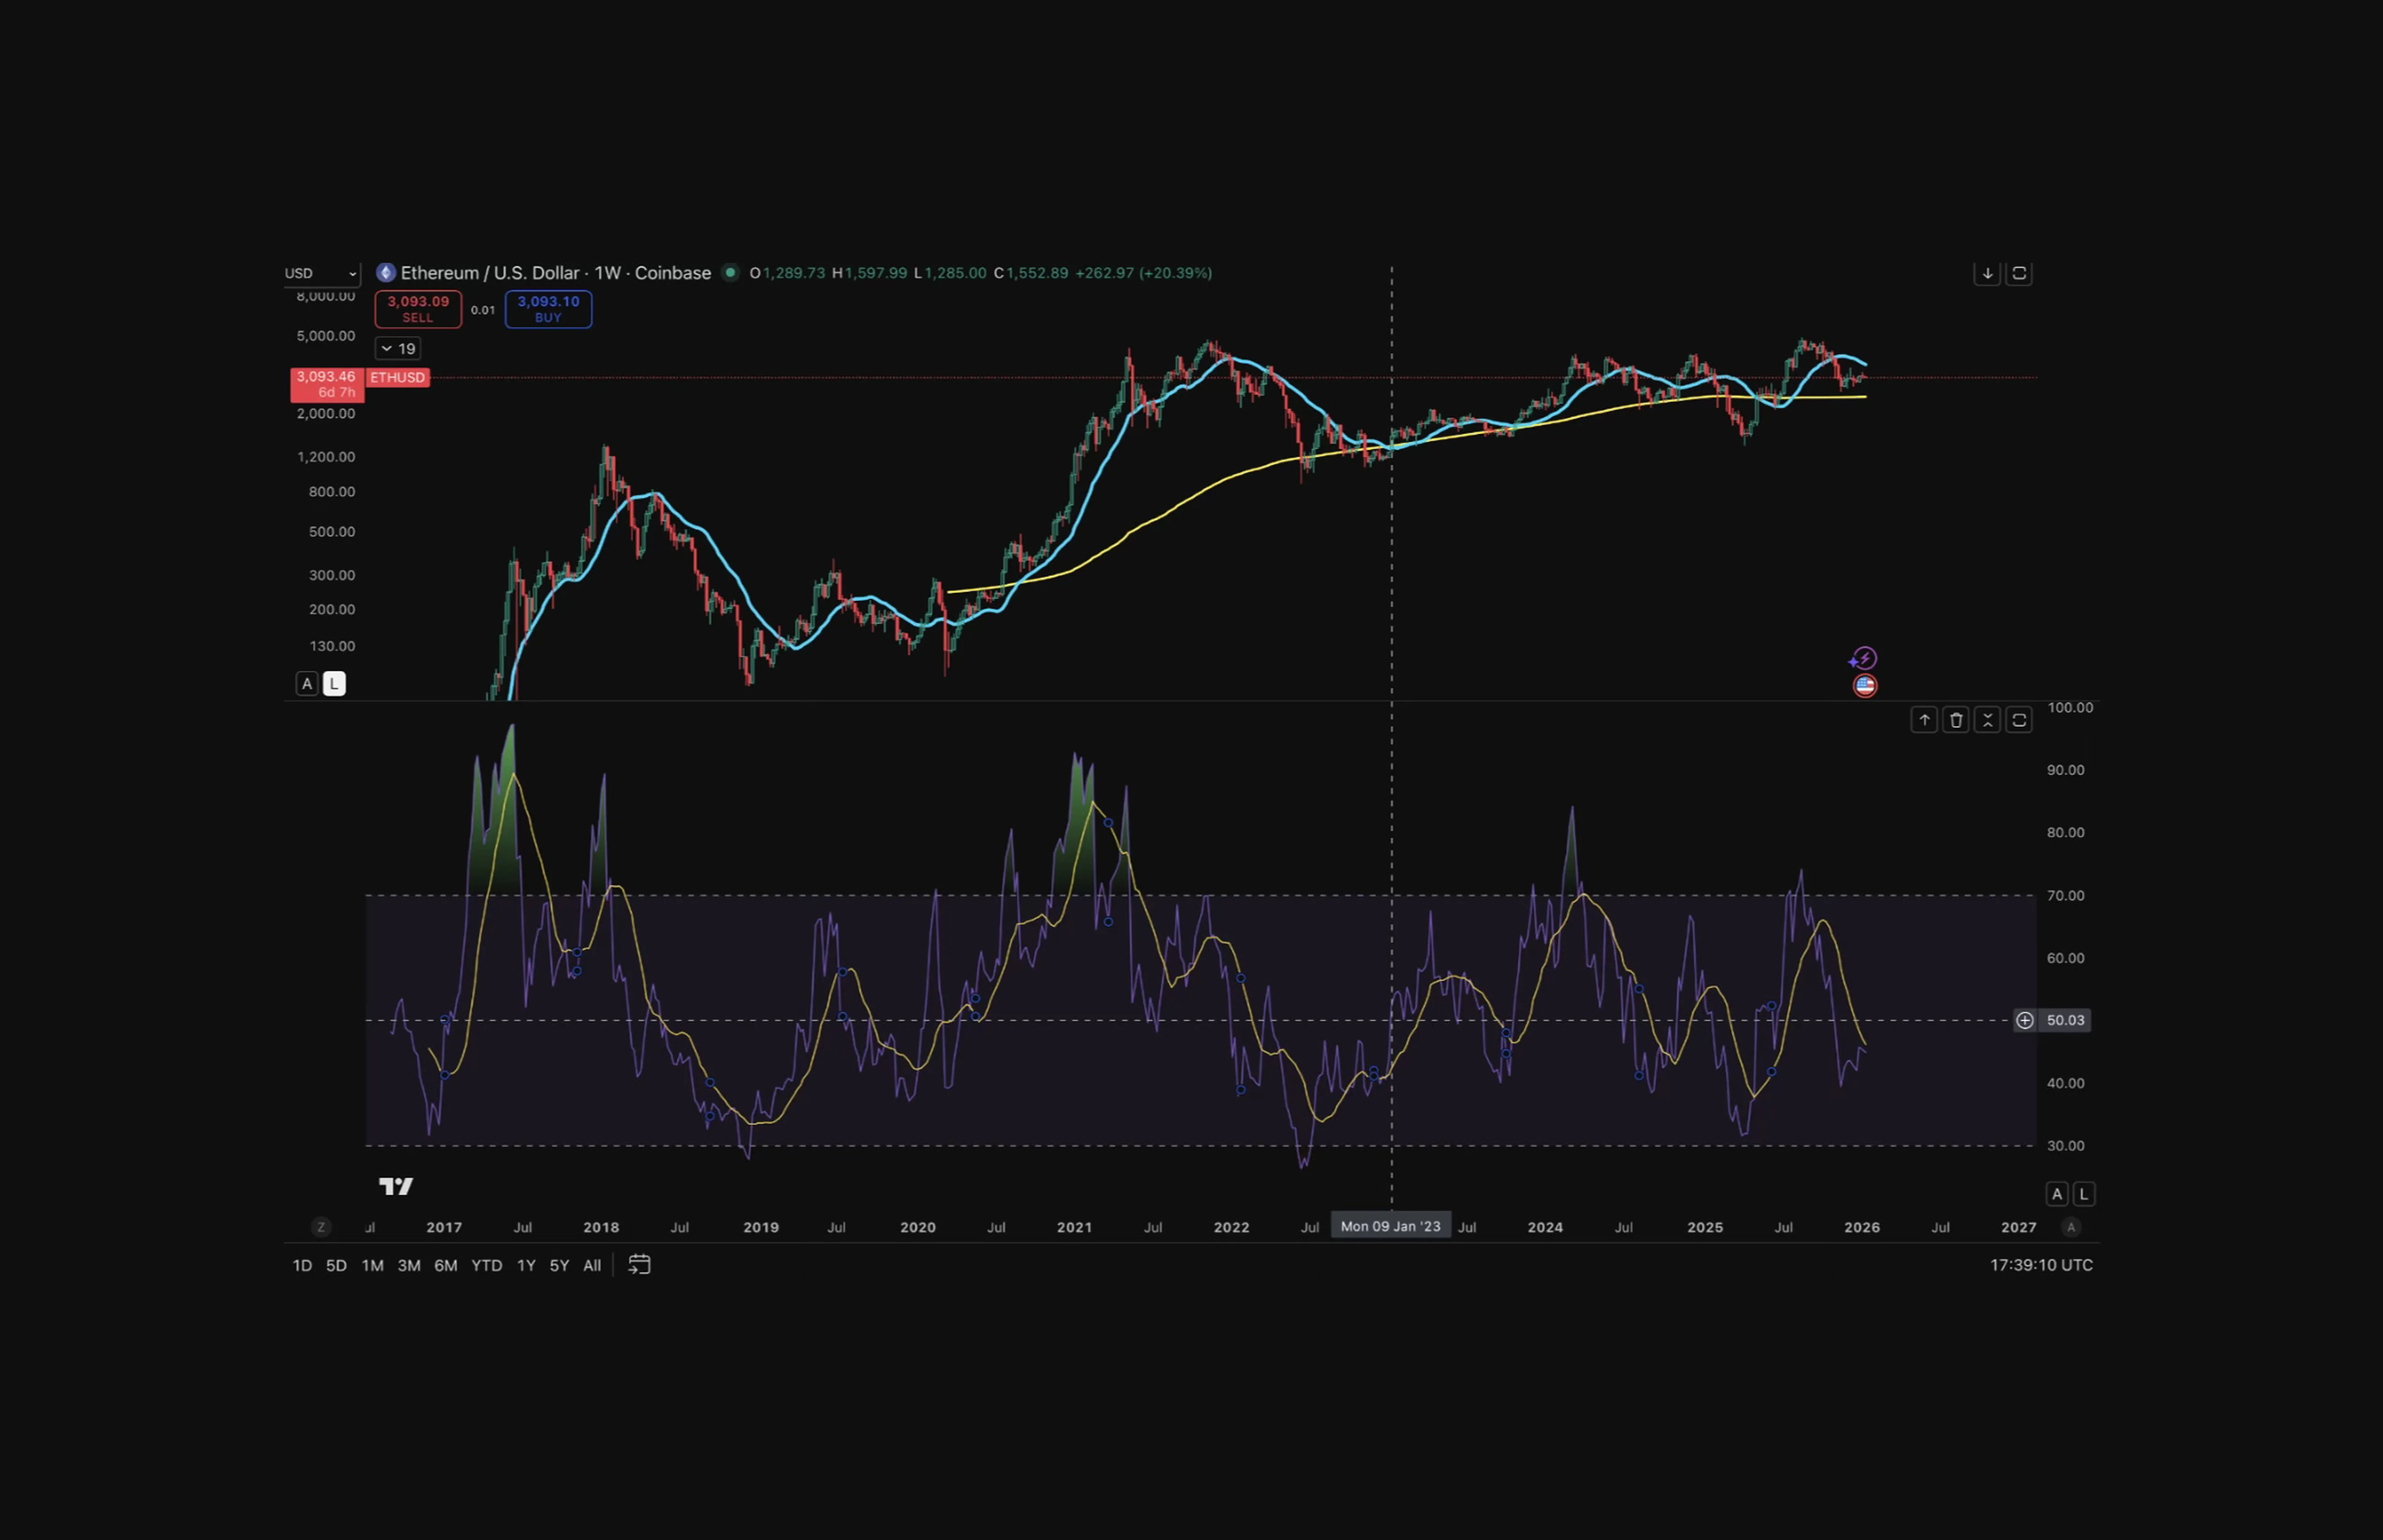
2023 Recovery: RSI crossed above 50 in early 2023 when Ethereum was trading around $1,300. This wasn't a temporary bounce. ETH rallied to $4,000+ by early 2024 as RSI remained above 50, validating the bull market continuation.
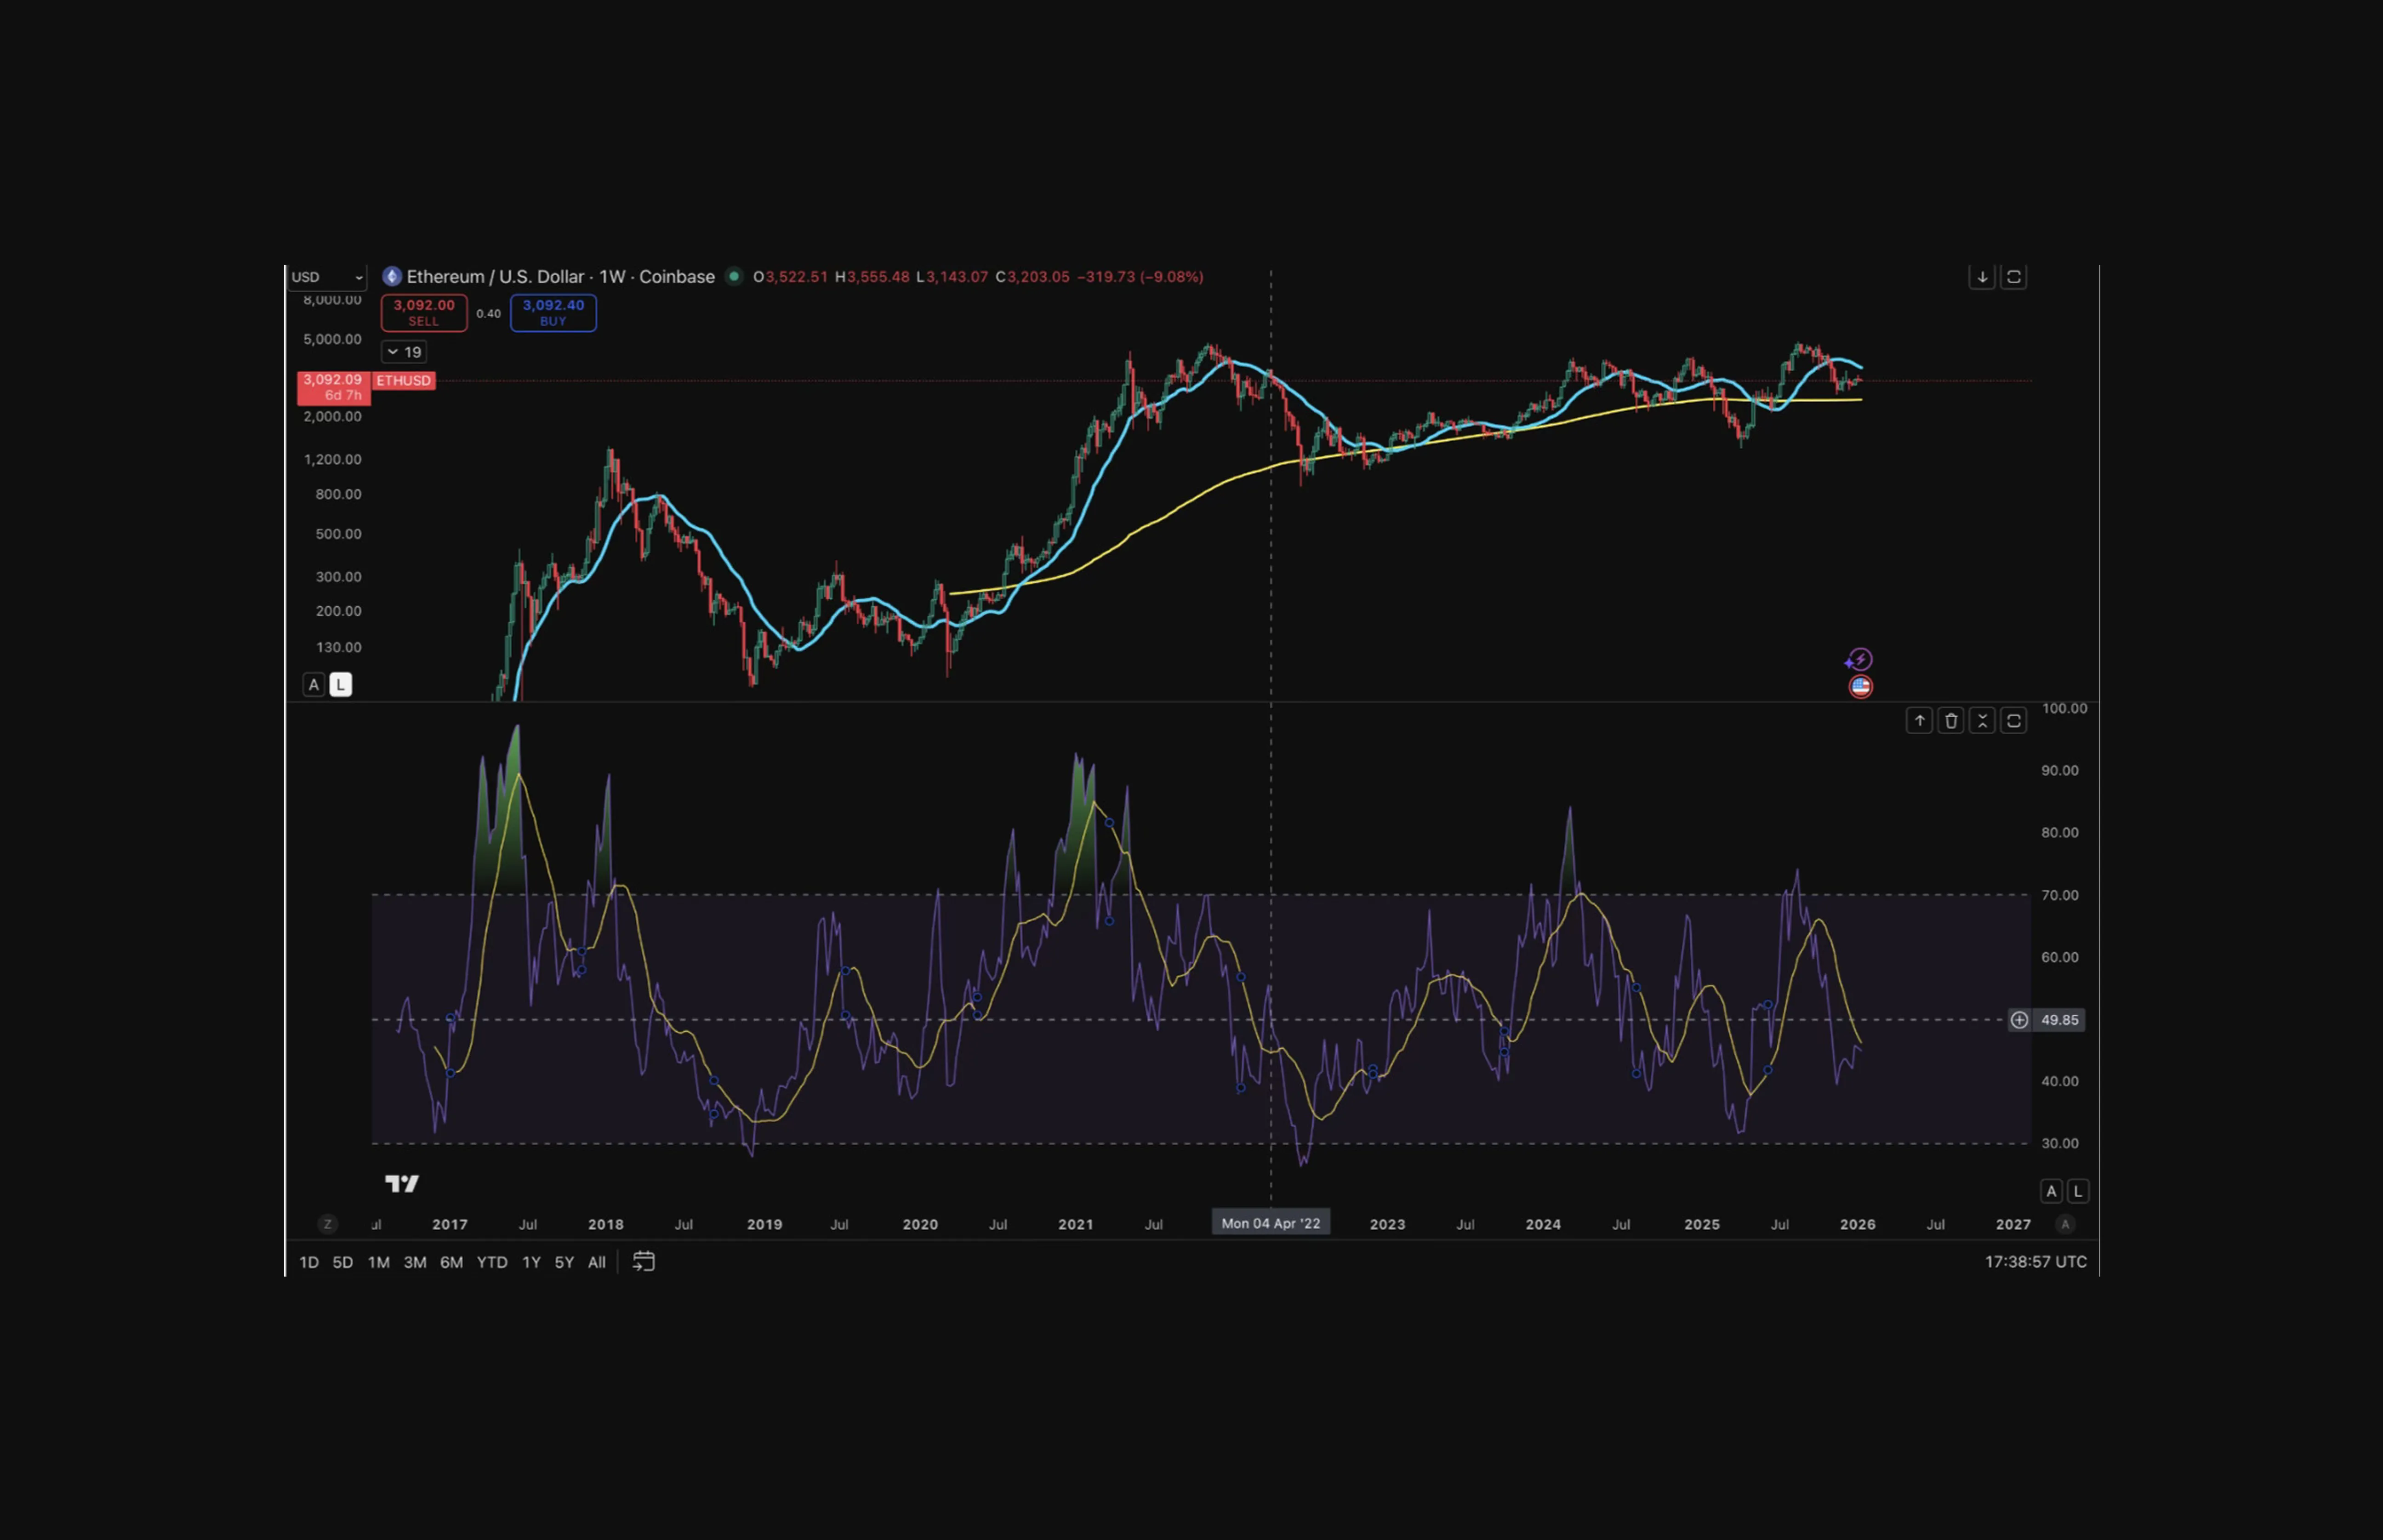
Current (January 2026):
RSI is hovering right at 50 (~45). This appears to be the inflection point whichever direction it breaks will likely determine the next major move. Traders using the 50-level framework are watching closely: a sustained move below 50 signals a potential shift toward bearish conditions.
How to Actually Trade This
Instead of predicting direction, focus on identifying areas of interest levels where price has historically reacted and risk can be clearly defined. When RSI is below 50, momentum is unfavorable for longs (maybe); staying neutral and patiently layering bids at more advantageous prices often makes more sense than forcing exposure. This means waiting for the prices to come down.
For structured approaches to trading these environments without leverage, see Coinjuice's How to Trade Without Leverage eBook.
When RSI Is Above 50 (Bullish)
Default bias: Long positions can remain
Entry strategy: Buy pullbacks to support, consolidation breaks to the upside
What NOT to do: Short because it "looks extended" or RSI hit 70
Risk management: Use trend support as stops, not arbitrary RSI levels
Expectation: RSI can stay in 60-80 range for months, this is healthy momentum
When RSI Is Below 50 (Bearish)
Default bias: Defensive, reduce exposure
Entry strategy: Wait for RSI to reclaim 50 before adding new positions
What NOT to do: "Buy the dip" at RSI 30 hoping for a bounce
Risk management: Tight stops, assume continuation lower
Expectation: RSI can stay in 40-20 range for months, this is normal in bear markets
When RSI Is Right At 50:
Recognition: This is the battlefield, neither bulls nor bears have control
Action: Wait for a decisive break and hold above/below before committing capital
Size: If trading, use smaller position sizes
What This Means Right Now (January 2026)
Both Bitcoin and Ethereum are hovering near RSI 50 on the weekly timeframe. This is interesting.
Bitcoin (~RSI 42): Just below 50 after a strong run. Price is consolidating. The market is deciding whether the bull market continues or if BTC will enter a corrective phase seeing lower prices.
Ethereum (~RSI 45): Almost at the line at this point the trader should not try to predict which way it breaks. Instead the trader should prepare for both scenarios and let the market reveal its direction.
Conclusion
Forget everything learned about RSI 30/70 levels for Bitcoin trading. The 50 line is one level that matters.
Above 50: Bullish posture, look for long opportunities on pullbacks
Below 50: Bearish posture, defense mode, wait for confirmation before adding
At 50: Neutral, let it break before committing
The longest surviving traders don't fight the market but identify when conditions are favorable and press their trading edge.
FAQ
Why does using RSI 30/70 levels perform poorly for Bitcoin and Ethereum trading?
Because Bitcoin and Ethereum often trend strongly, they can stay "overbought" above 70 for months in bull runs and become "oversold" traps near 30 in bear markets. Studies from 2018–2023 showed that portfolios using RSI 30/70 as reversal signals massively underperformed buy-and-hold.
What is the significance of the RSI 50 level in trending Bitcoin and altcoin markets?
RSI 50 acts as the dividing line between bullish and bearish regimes. Above 50, gains outweigh losses and bull markets see RSI trend in the 60–90 range with 50 acting as support. Below 50, losses dominate, bear markets see RSI trend in the 40–20 range, and 50 acts as resistance.
How should traders adjust their strategy when RSI is above, below, or at 50?
Above 50, traders can keep a bullish bias, buy pullbacks and upside breakouts, and use trend support for stops. Below 50, they should be defensive, reduce exposure, wait for RSI to reclaim 50 before new longs, and use tight stops while assuming continuation lower. At 50, they should stay neutral, wait for a decisive break and hold above or below, and, if trading, use smaller position sizes.
What does the current (January 2026) RSI situation imply for Bitcoin and Ethereum?
Bitcoin’s weekly RSI is around 42, just below 50, after a strong run, with price consolidating as the market decides between continuing the bull market or entering a corrective phase with lower prices. Ethereum’s weekly RSI is around 45 near 50, marking an inflection point where traders should avoid prediction, prepare for both bullish and bearish scenarios, and wait for the market to reveal direction.
Disclaimer
The information provided in this article is for informational purposes only. It is not intended to be, nor should it be construed as, financial advice. We do not make any warranties regarding the completeness, reliability, or accuracy of this information. All investments involve risk, and past performance does not guarantee future results. We recommend consulting a financial advisor before making any investment decisions.
Written by

Andrew Kamsky
Andrew Kamsky is a Bitcoin analyst. He spent a decade in traditional finance across a Big Four firm and a listed fintech bank before going deep on Bitcoin full-time.


