


Quick summary
Every World Cup since 2014 aligned with Bitcoin bear markets due to halving cycle timing
2014, 2018, 2022 tournaments saw progressively worse drawdowns, with 2022 structurally damaged within 13 days before the first game
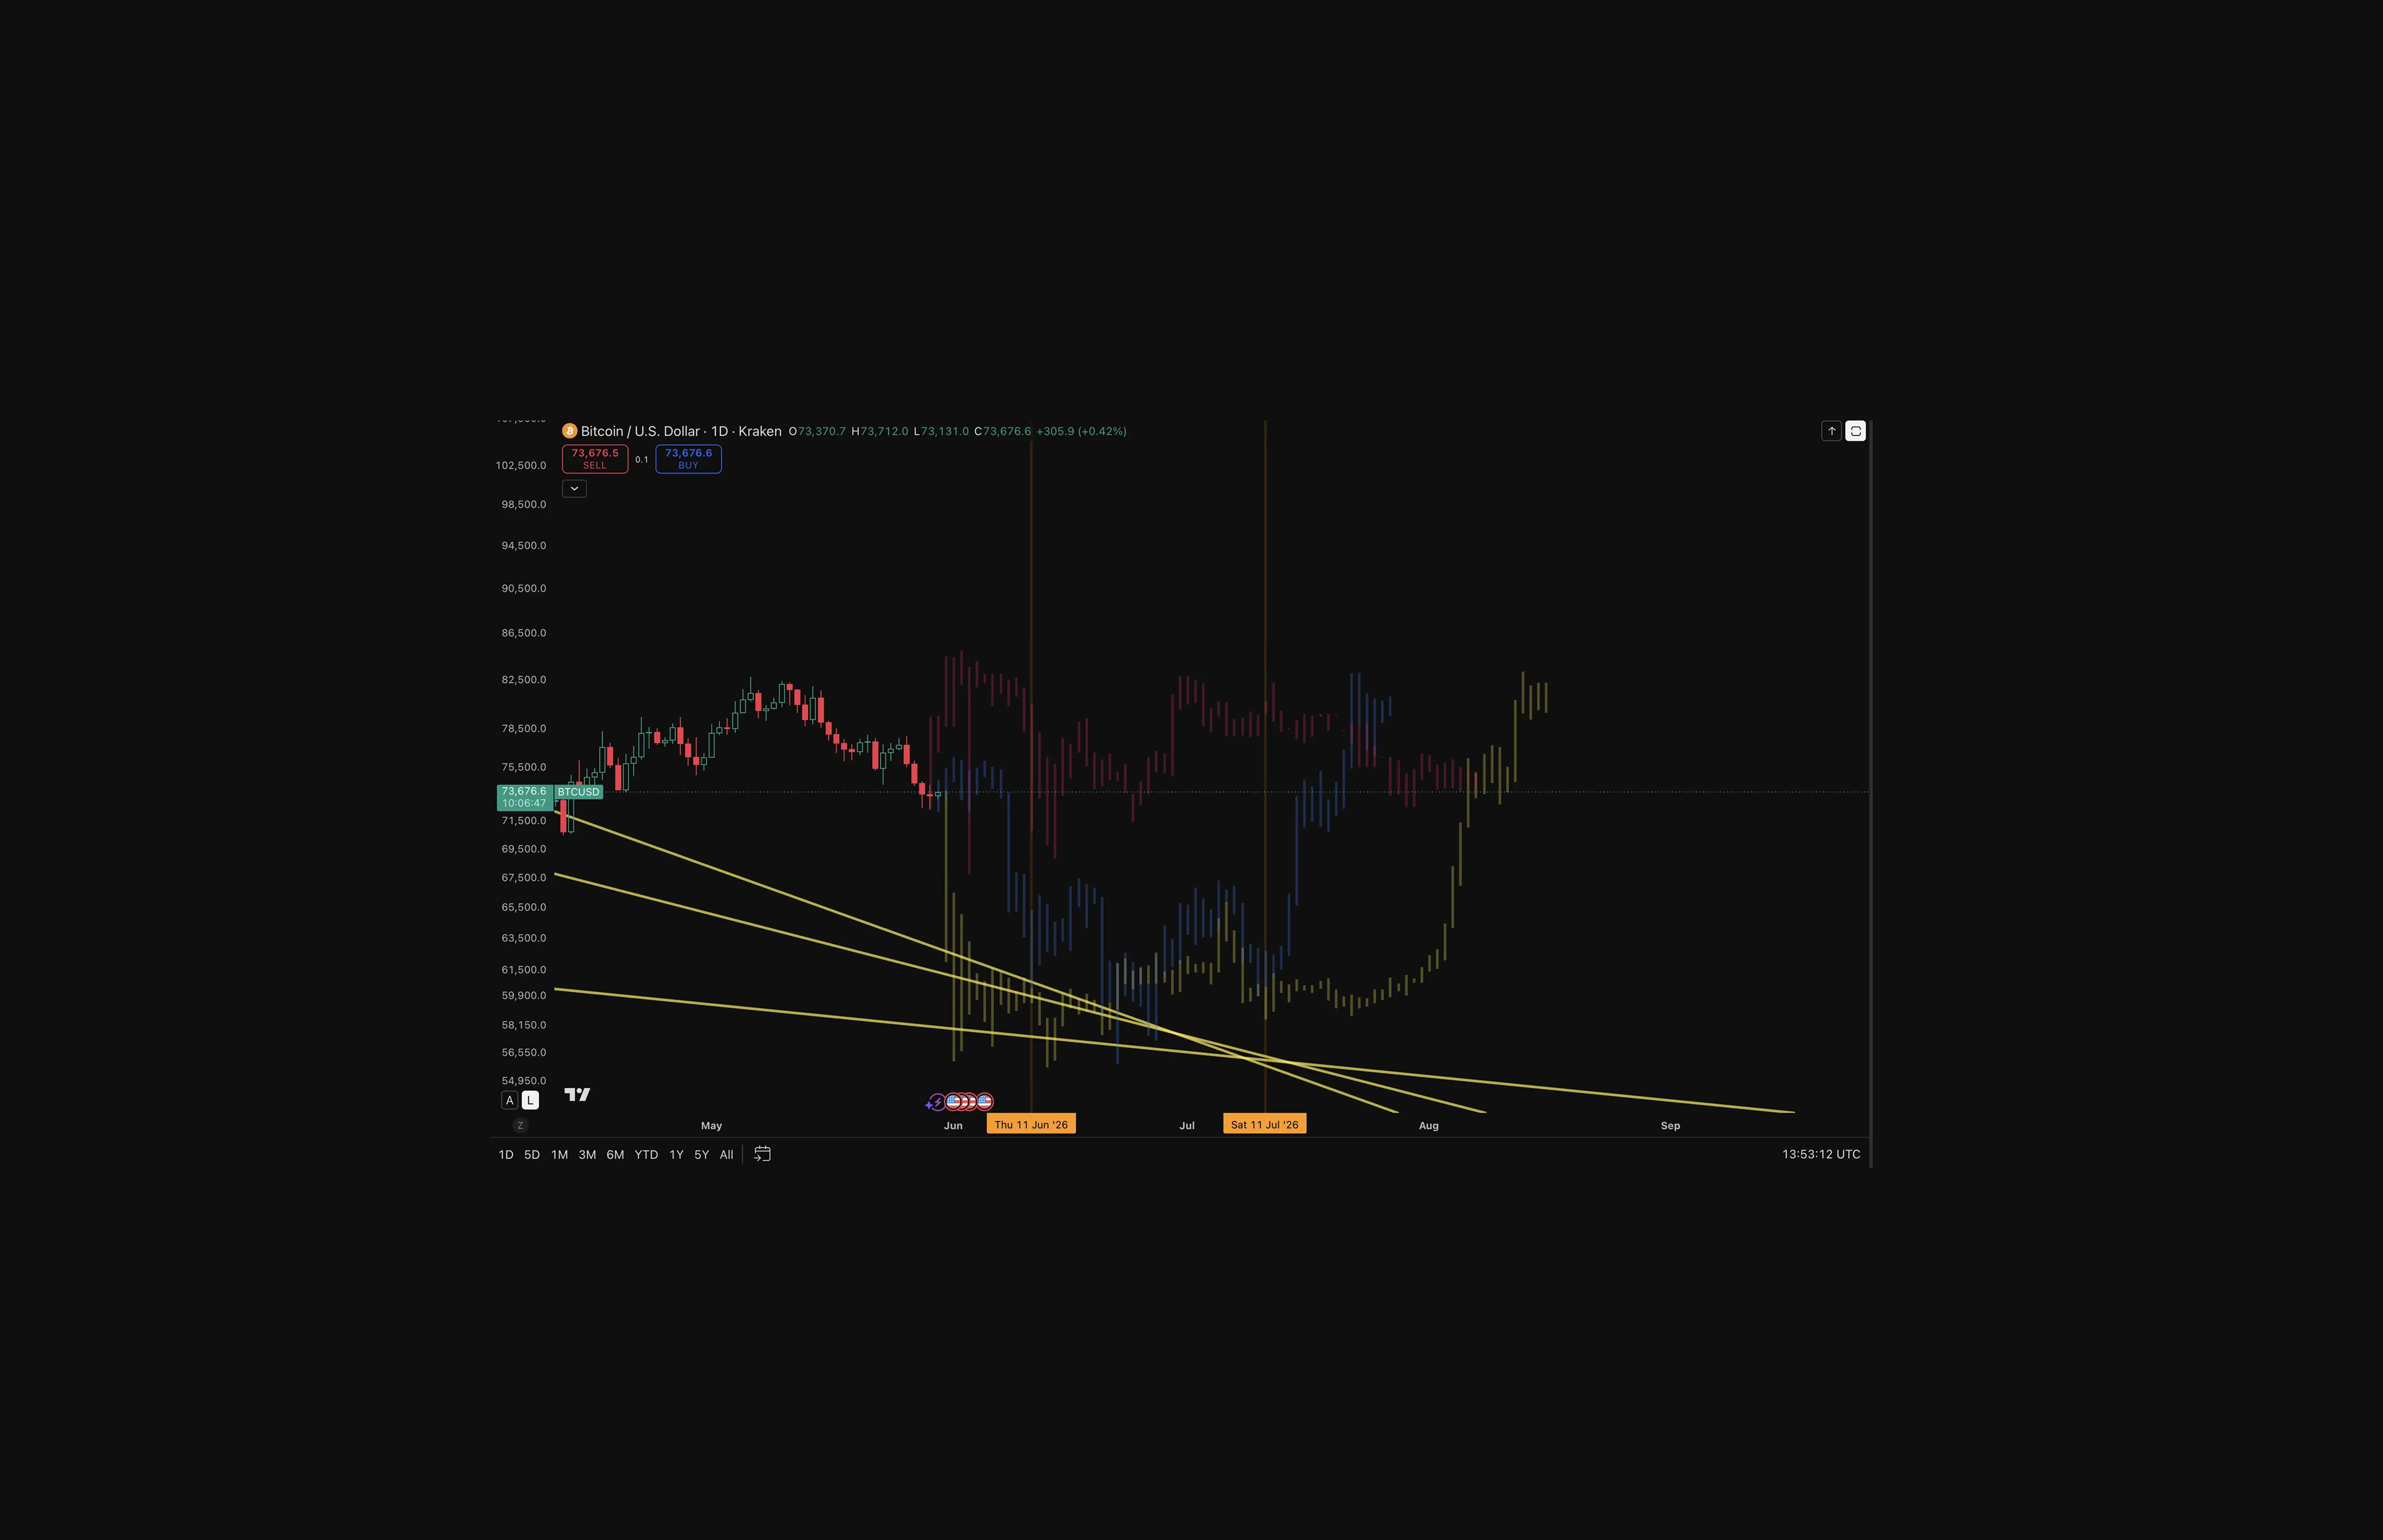
2026 World Cup finds Bitcoin recovering from a $58,000 bottom, currently around $73,600
Potential ranges map to past fractals, while $84,000+ would be entirely new territory
Bitcoin has traded through three FIFA World Cups. All three occurred during bear markets. Here is what the price did in 2014, 2018, and 2022 and how the 2026 setup compares.
Has Bitcoin Ever Performed Well During a FIFA World Cup?
Not really. Every tournament since Bitcoin became tradeable has coincided with a bear market. The overlap is largely explained by Bitcoin's four-year halving cycle running nearly out of phase with the World Cup's four-year calendar.
Each tournament has landed roughly two years post-halving historically the deepest point of prior cycle drawdowns.
2026 USA, Canada, Mexico (June 11 to July 19)
Bitcoin is not arriving at this tournament from a recent peak on the way down. It bottomed in the $58,000 range early February 2026, absorbed the selling, and has been recovering since. Current price sits near $73,600, thirteen days before the opening match in Mexico City.
The 2026 price structure compares against all three prior fractals in the chart above, measured from 13 days before the opening match through to the final.
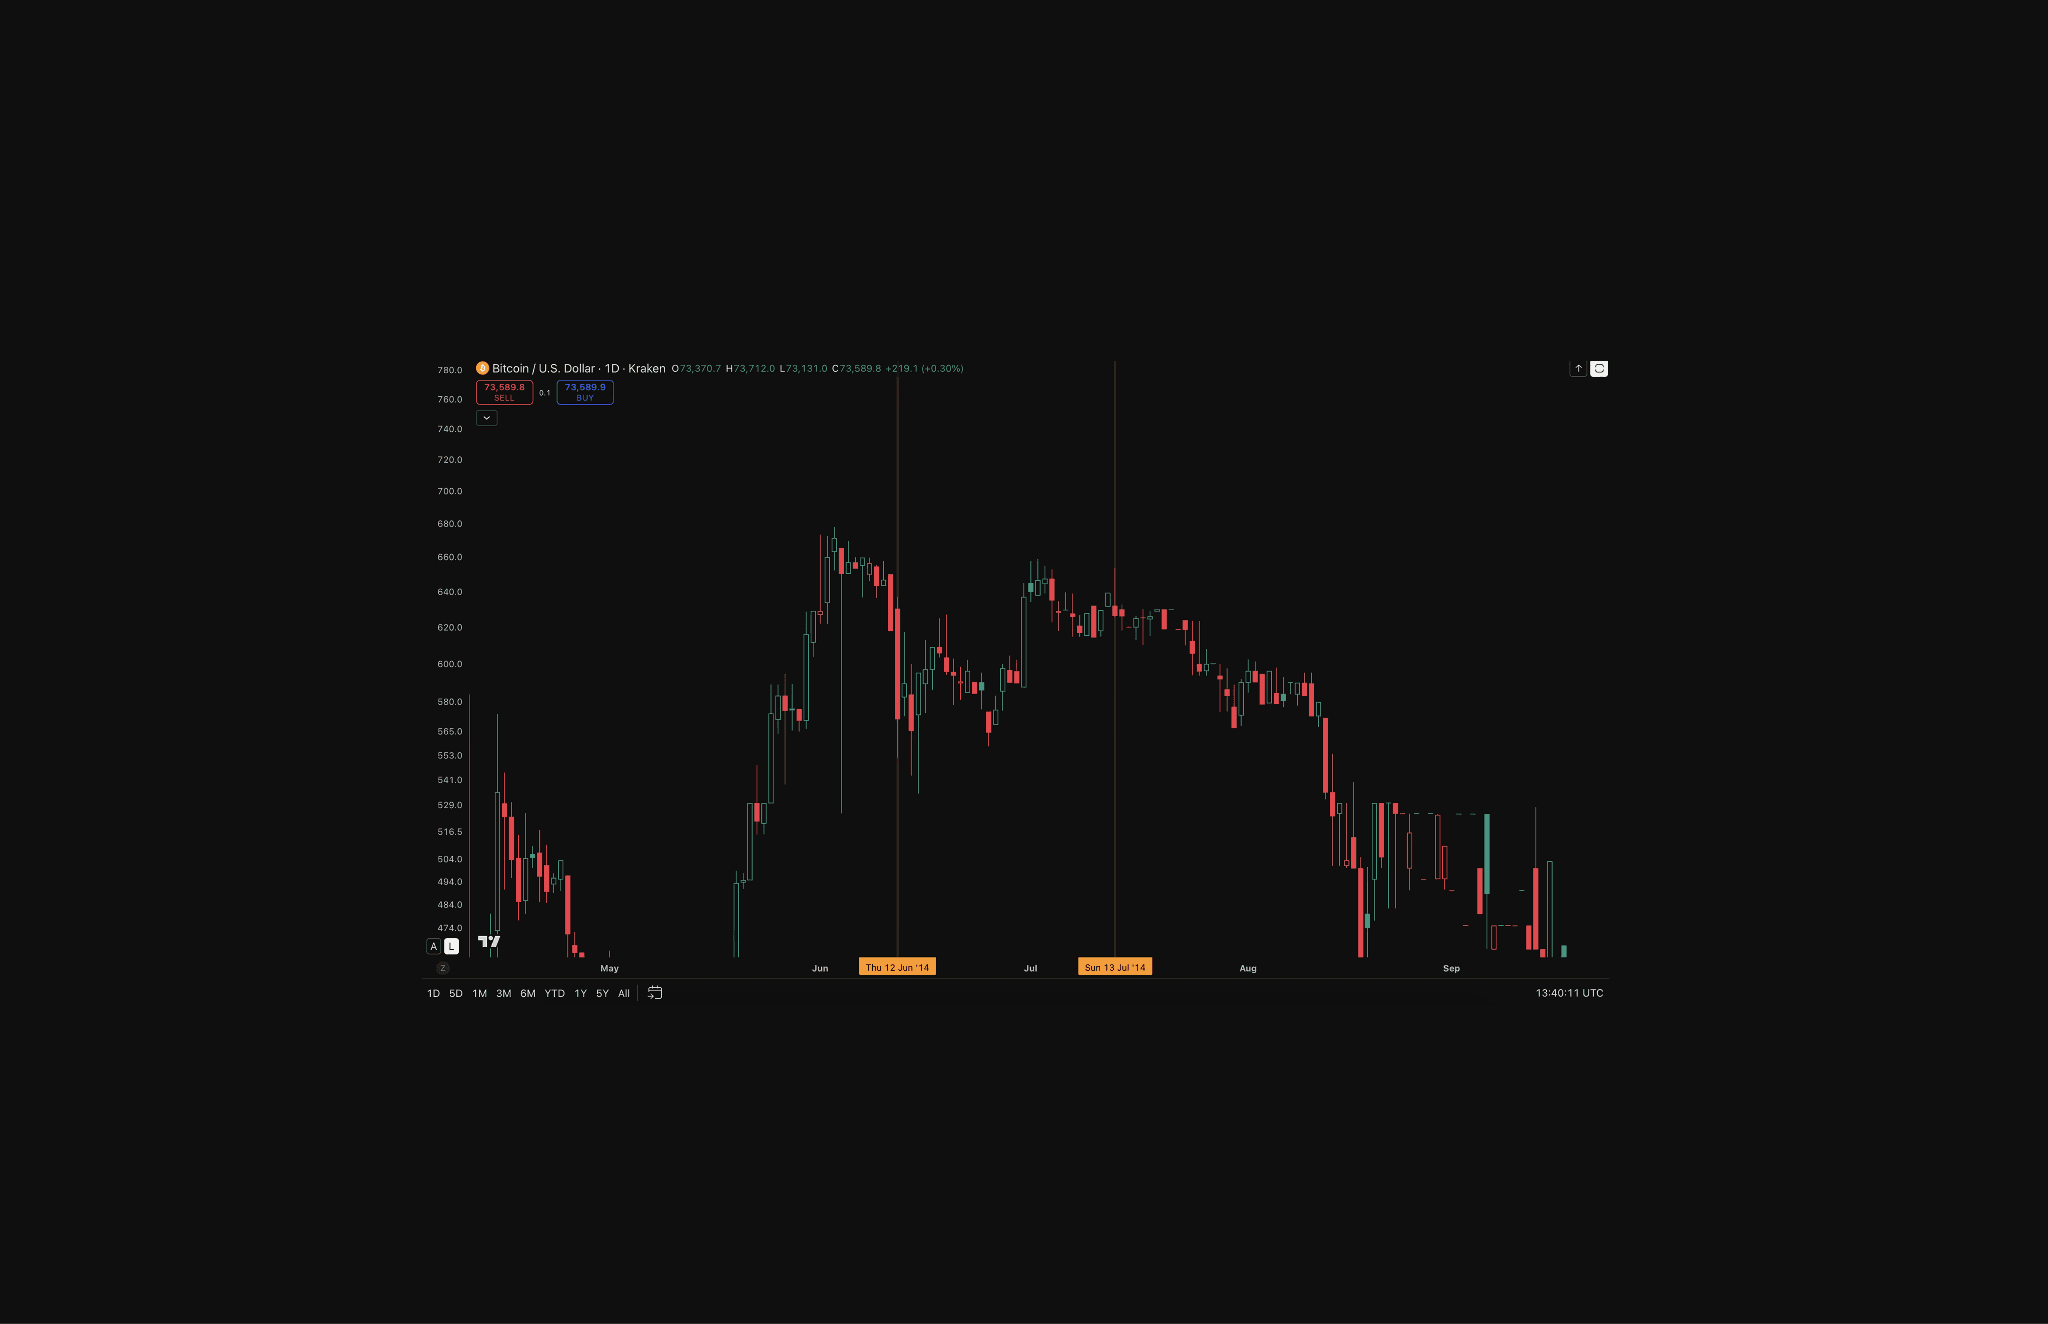
2014 Brazil (June 12 to July 13)
Bitcoin opened near $620 and closed near $580. A slow, controlled bleed. Mt. Gox had collapsed four months earlier, removing the dominant exchange from the market. No panic during the tournament itself just a market quietly losing ground with no buyers to stop it.
Down approximately 6.5% across the window. The calmest fractal of the three, and the least damaging.
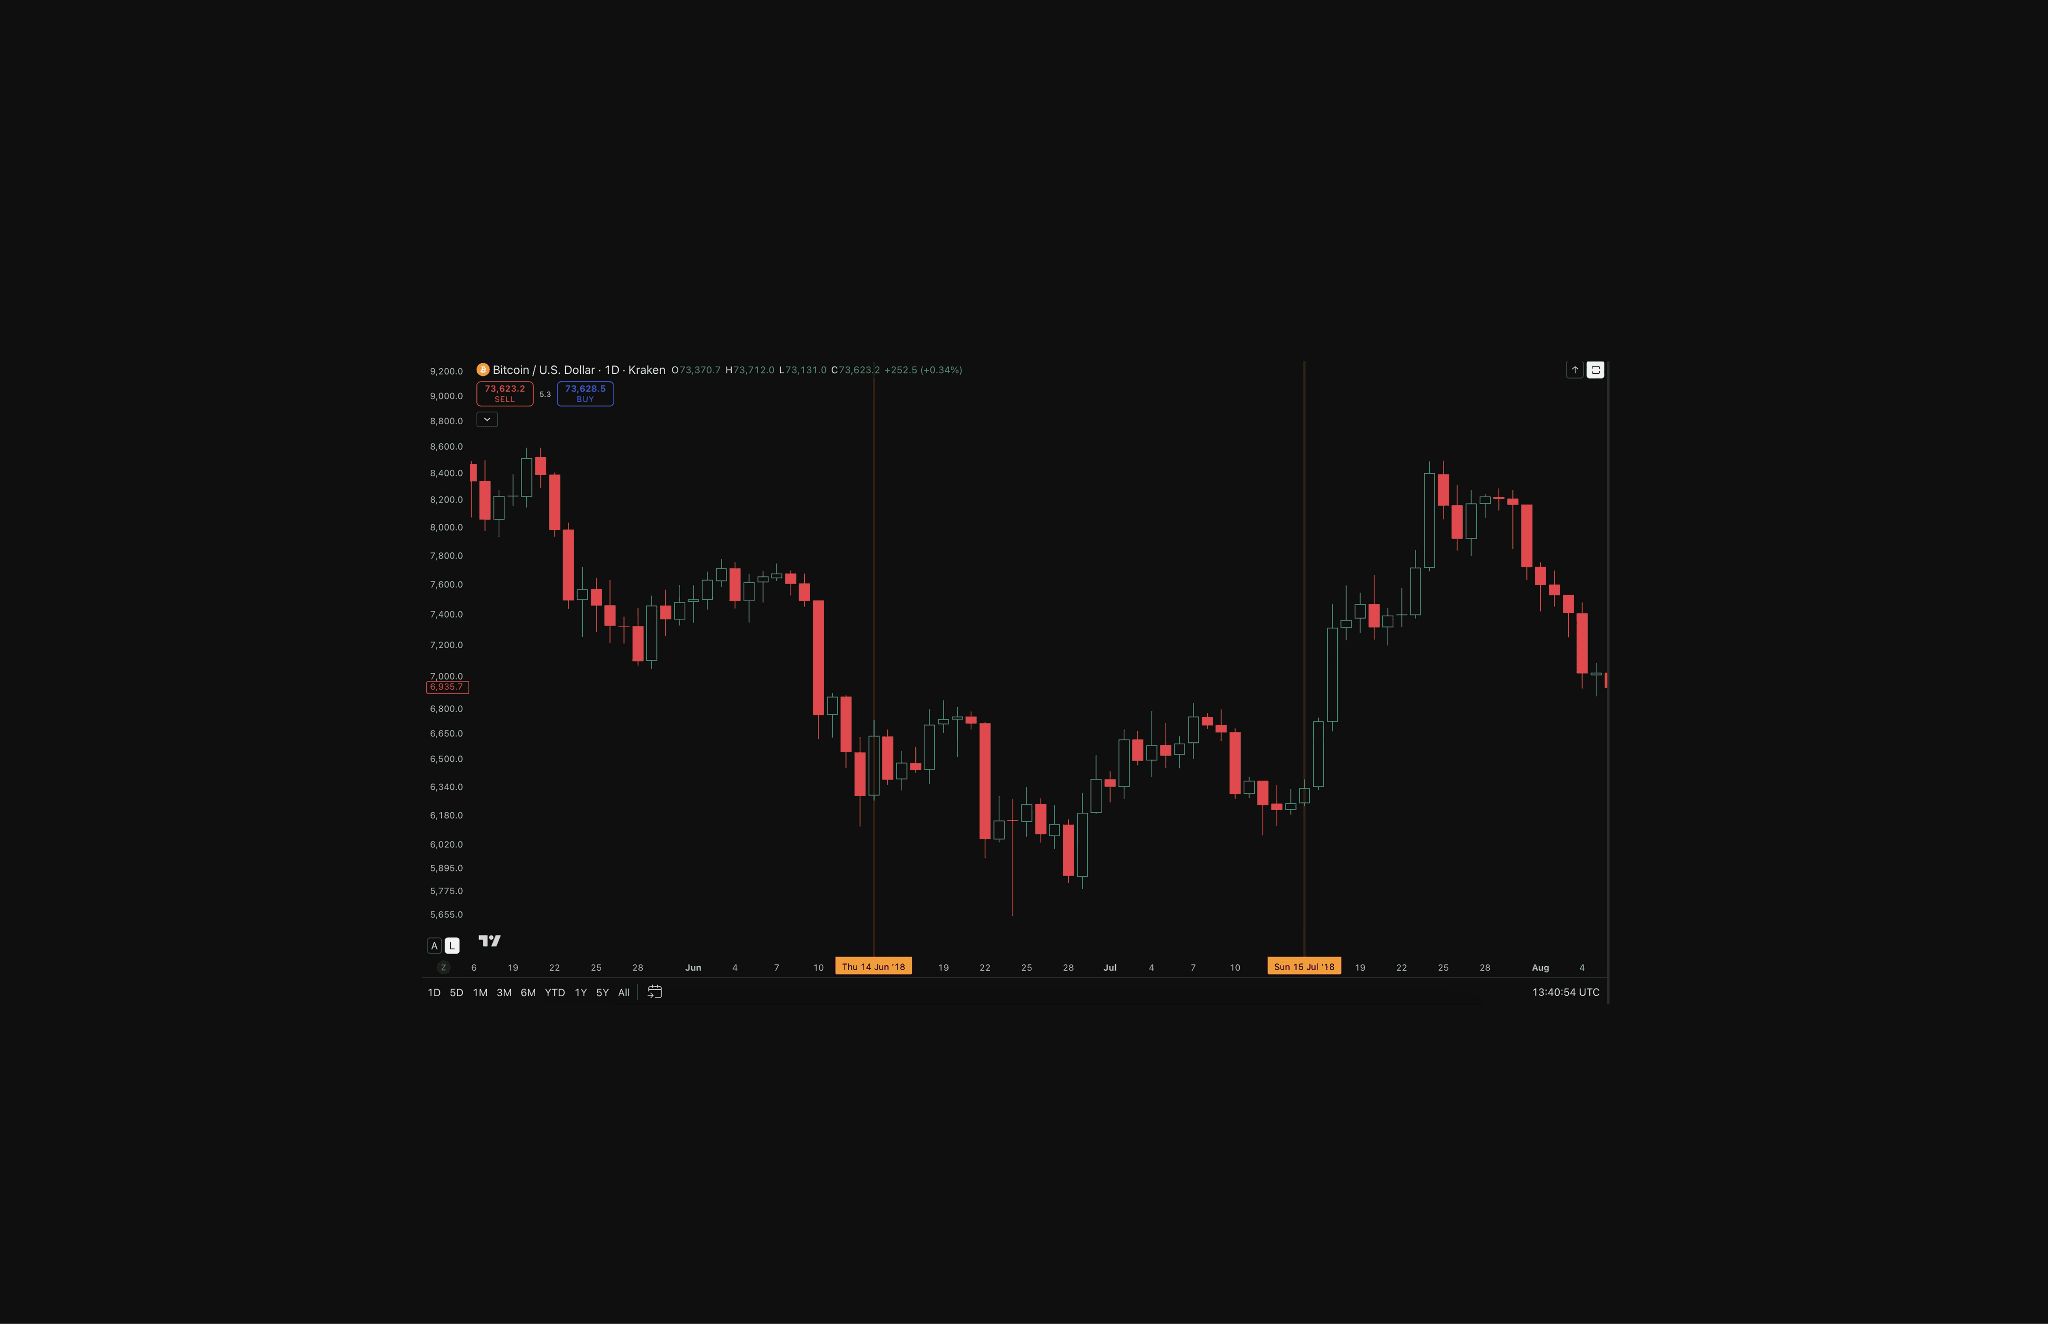
2018 Russia (June 14 to July 15)
Bitcoin arrived already broken trading around $6,800 after peaking near $20,000 six months earlier. During the tournament, price dropped toward $5,800 before partially recovering toward $6,500 by the final.
Buyers who stepped in mid-tournament were early by roughly six months. The recovery was a trap.
Down approximately 15% to the intra-tournament low before partial recovery. More volatile, more painful than 2014.
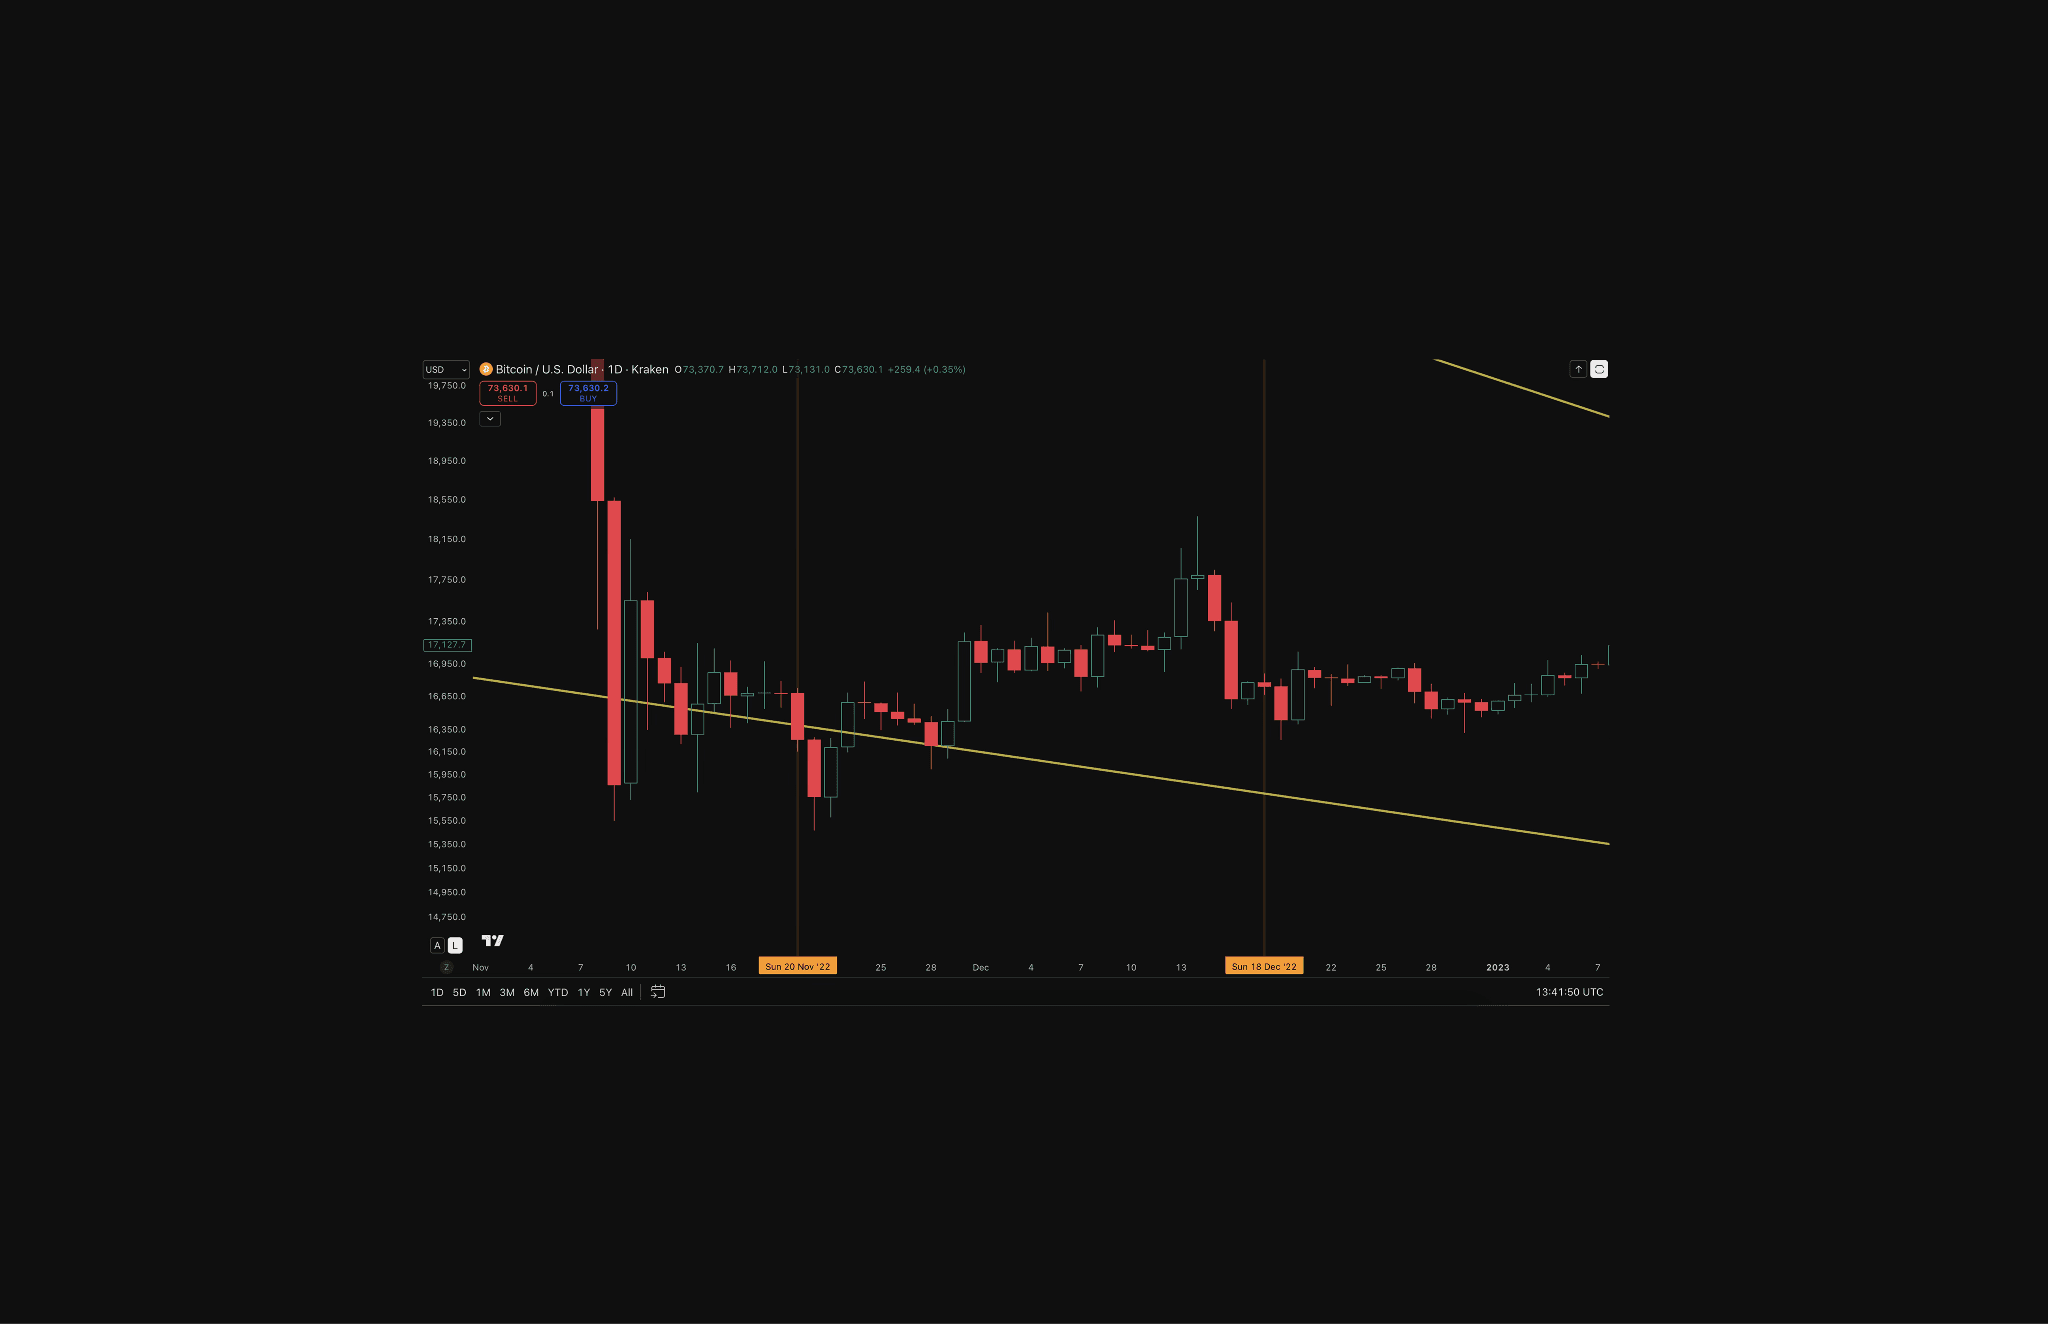
2022 Qatar (November 20 to December 18)
The worst of the three. FTX collapsed weeks before the opening match. Bitcoin opened near $16,000, briefly recovered toward $18,000, then closed back near $16,500. The chart was not a clean trend in either direction broken structure, choppy price action, every recovery attempt sold into.
The most structurally damaged fractal of the three.
Why Bitcoin Has Underperformed During Every World Cup Since 2014
The overlap is largely explained by Bitcoin's four-year halving cycle and the World Cup's four-year schedule running nearly out of phase with each other.
Halvings occurred in November 2012, July 2016, May 2020, and April 2024. Post-halving cycle tops have historically arrived 12 to 18 months later meaning the bear phase started, and deepened, precisely when each tournament window opened.
2014, 2018, and 2022 all followed this template.
Limitations of the BTC World Cup Correlation Fractal
Before treating the pattern as predictive, three caveats:
Three tournaments is a small sample size
World Cups do not cause Bitcoin price movements
The pattern is better read as a structural observation than a trading indicator
How 2026 Compares to Previous World Cup Drawdowns
Here is where the three fractals meet the current price:
$58,000 to $60,000: Equivalent to the Qatar 2022 decline. A drop here tracks the worst prior fractal, where Bitcoin collapsed into a cycle bottom amid the FTX fallout
$63,000 to $65,000: Equivalent to the Russia 2018 decline. This range aligns with the tournament drawdown where Bitcoin fell roughly 15% before a recovery that ultimately failed
$69,000 to $74,000: Equivalent to the mild Brazil 2014 decline and current trading zone.
$84,000 plus: A move into entirely new territory versus every prior World Cup. No previous tournament fractal reached this level.
Bitcoin holding within $69,000 to $74,000 or higher across the full tournament window would track above every prior World Cup fractal. That is where 2026 sits, thirteen days before the opening match in the United States.
Bitcoin at the 2026 World Cup: A Different Setup This Time
Every previous World Cup caught Bitcoin in a bear market. 2014 was a slow bleed. 2018 was sharper and more volatile. 2022 was the most structurally damaged price bouncing in the wreckage of FTX.
2026 is the first tournament where Bitcoin arrives recovering from a low rather than falling from a high.
Whether the pattern breaks or reasserts itself is what the next 40 days will answer.
FAQ
Has Bitcoin ever performed well during a FIFA World Cup?
Every FIFA World Cup since Bitcoin became tradeable has coincided with a bear market, and Bitcoin has underperformed during each tournament.
Why has Bitcoin underperformed during every World Cup since 2014?
Bitcoin’s four-year halving cycle runs nearly out of phase with the World Cup’s four-year schedule. Each tournament has landed roughly two years after a halving, historically the deepest point of prior cycle drawdowns.
How did Bitcoin behave during the 2014, 2018, and 2022 World Cups?
In 2014, Bitcoin slowly bled from about $620 to $580, down roughly 6.5%. In 2018, it dropped from around $6,800 toward $5,800 before partially recovering to about $6,500, a roughly 15% drawdown to the low. In 2022, it opened near $16,000, briefly recovered toward $18,000, then closed around $16,500 in a choppy, structurally damaged pattern.
How does the 2026 World Cup setup for Bitcoin compare to prior tournaments?
For 2026, Bitcoin bottomed around $58,000 in early February 2026 and has been recovering, trading near $73,600 thirteen days before the opening match. This is the first World Cup where Bitcoin arrives recovering from a low rather than falling from a high, and holding $69,000–$74,000 or higher through the tournament would place it above every prior World Cup fractal.
Disclaimer
The information provided in this article is for informational purposes only. It is not intended to be, nor should it be construed as, financial advice. We do not make any warranties regarding the completeness, reliability, or accuracy of this information. All investments involve risk, and past performance does not guarantee future results. We recommend consulting a financial advisor before making any investment decisions.
Written by

Andrew Kamsky
Andrew Kamsky is a Bitcoin analyst. He spent a decade in traditional finance across a Big Four firm and a listed fintech bank before going deep on Bitcoin full-time.


