


빠른 요약
Nvidia has outperformed Bitcoin by over 1,200 percent since April 2021 amid the GPT AI boom
NVDA BTC ratio shows long term descending wedge from 2017, resolving with a November 2022 breakout
Breakout followed ChatGPT launch, marking structural shift and Nvidia strength over Bitcoin through February 2026
By February 2026, NVDA BTC ratio has hit a major resistance, signaling potential breakout or Bitcoin rotation
Since April 2021, Nvidia has outperformed Bitcoin by over 1,200%.
For anyone holding NVDA through the AI boom, it's been one of the best trades of the cycle. But a chart worth paying close attention to right now is the NVDA/BTC weekly ratio and it's flashing a signal that deserves serious attention.
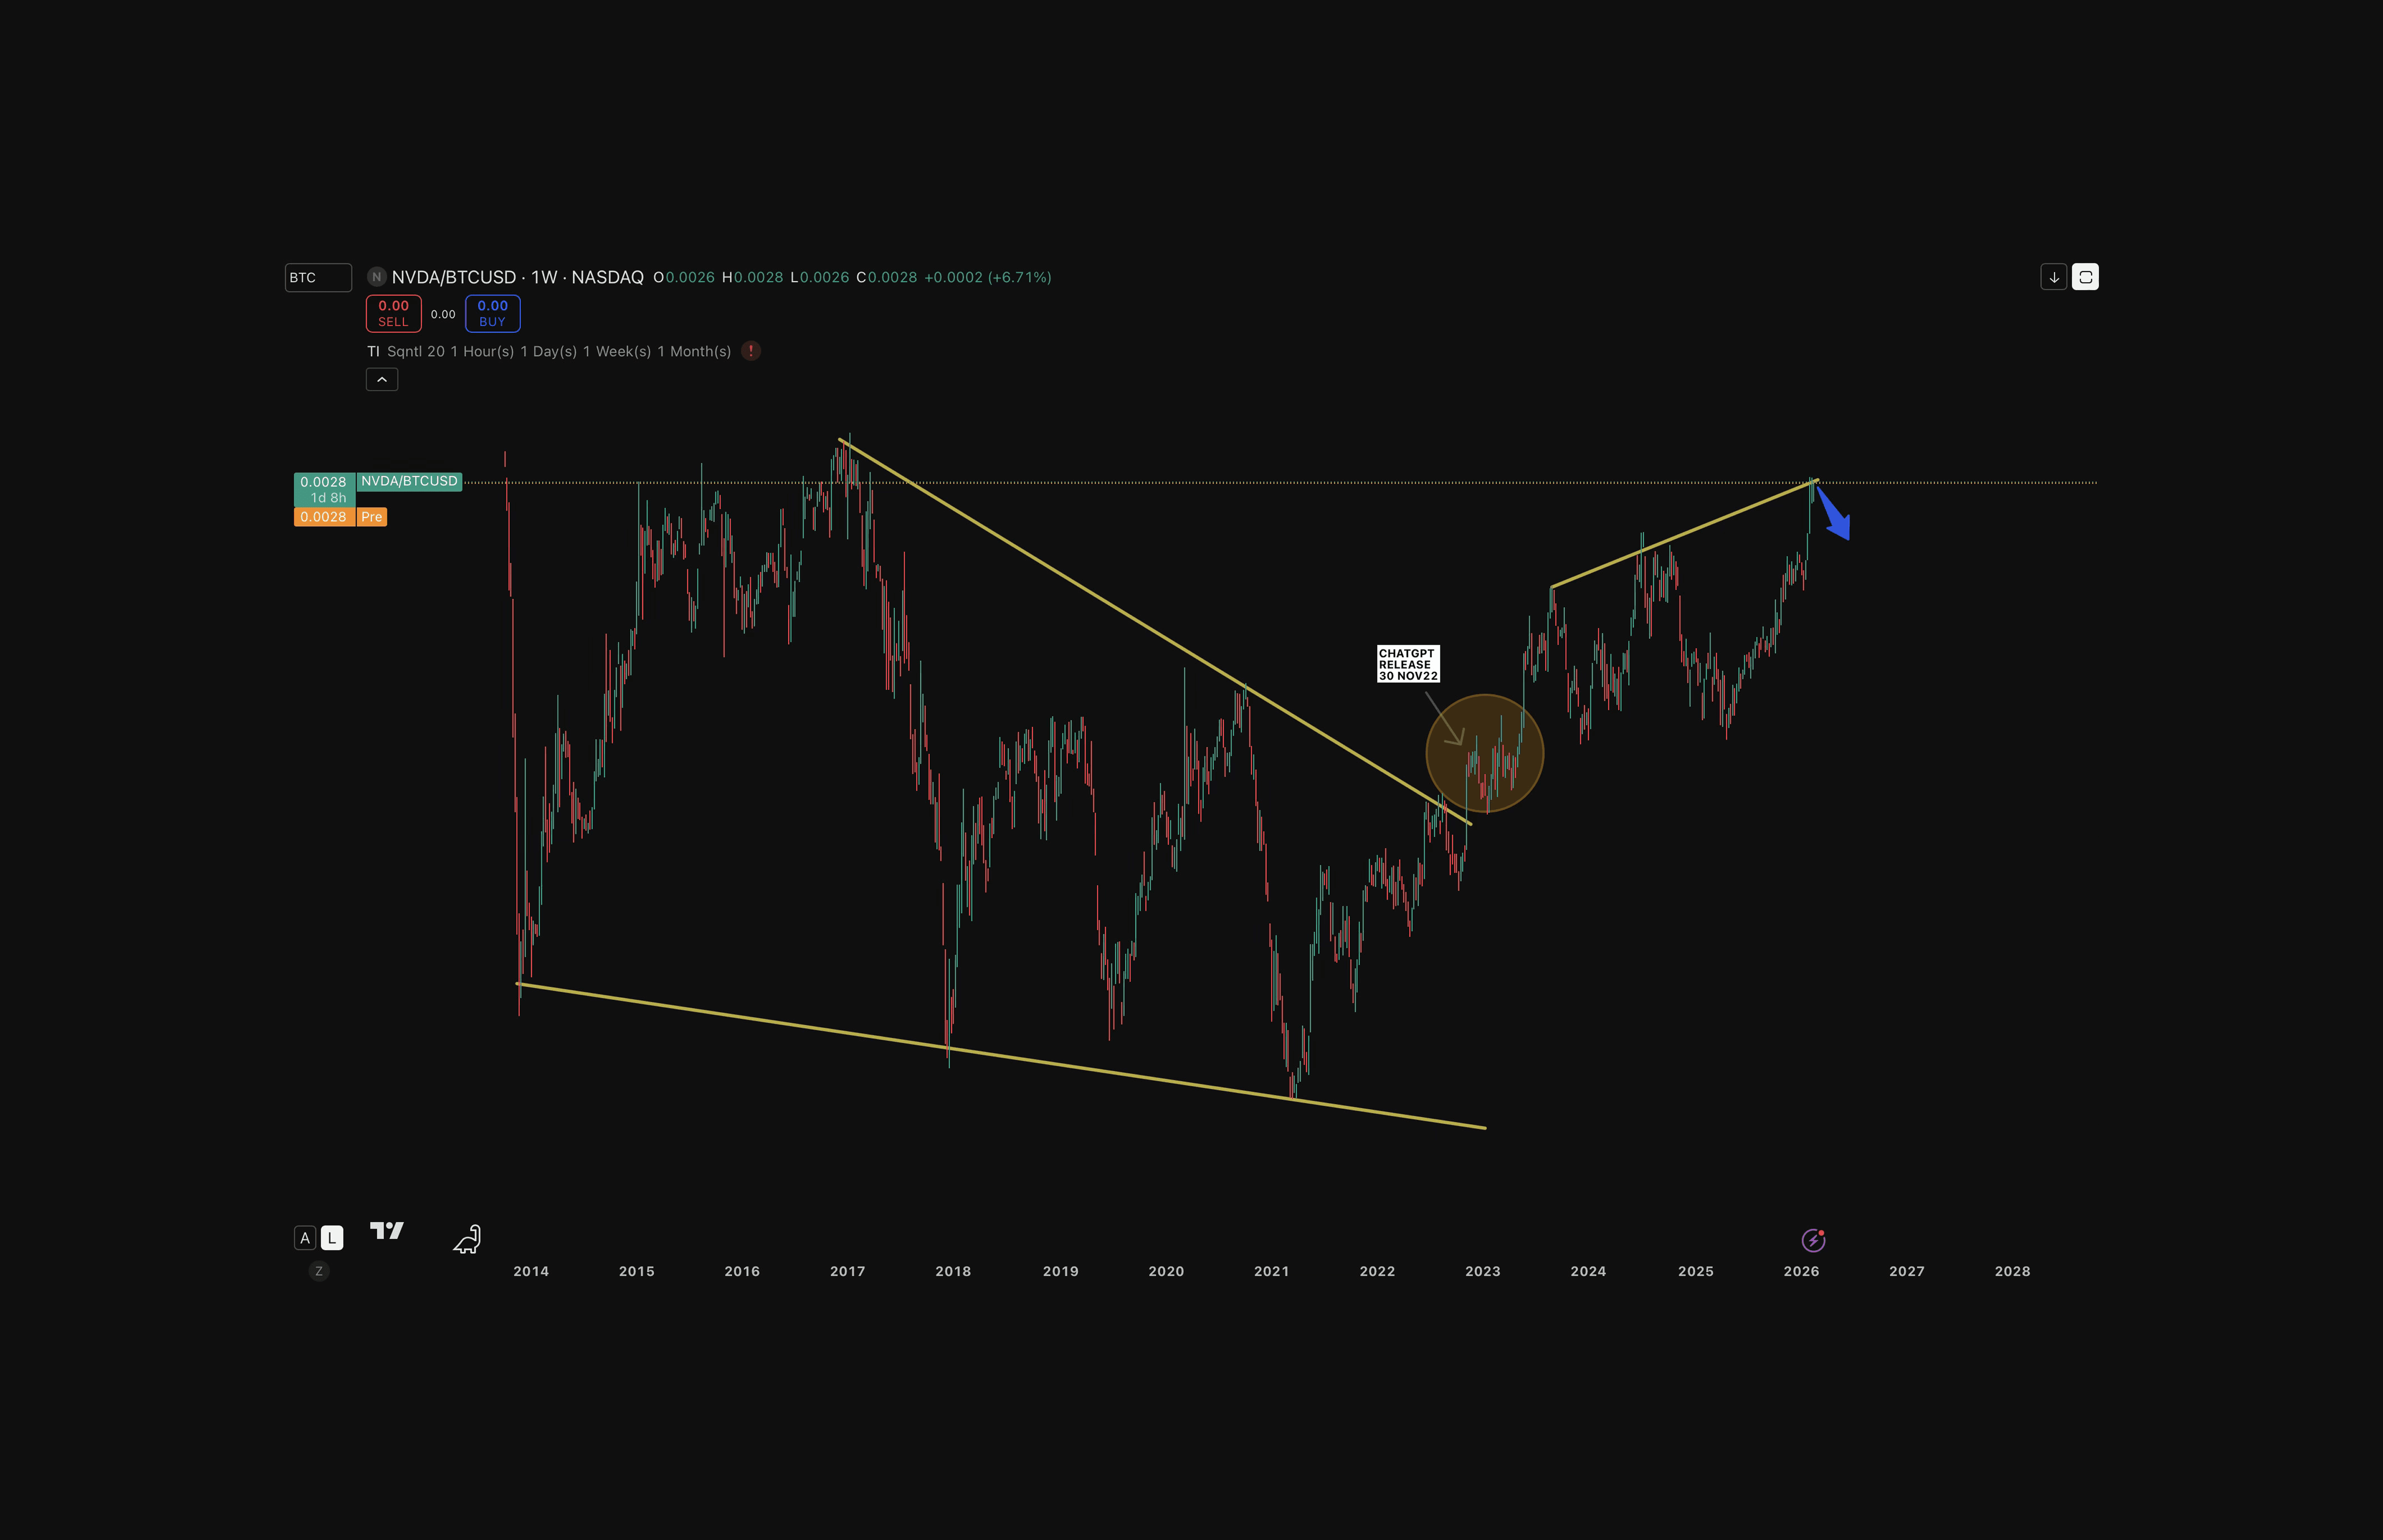
NVDA/BTC Monthly Timeframe
The NVDA/BTC ratio reflects a structural shift that began years before the AI boom and resolved with a decisive breakout in November 2022. The NVDA/BTC chart above illustrates:
Long-Term Structure: A descending wedge formed from 2017, defined by persistent lower highs and lower lows converging to an apex.
November 2022 Breakout: Following ChatGPT’s launch, November 30, 2022, Nvidia broke out decisively, ending the multi-year wedge.
Structural Advantage: The AI narrative gave Nvidia sustained relative strength over Bitcoin during the period April 2021- February 2026.
NVDA/BTC at Major Resistance: Breakout or Bitcoin Rotation?
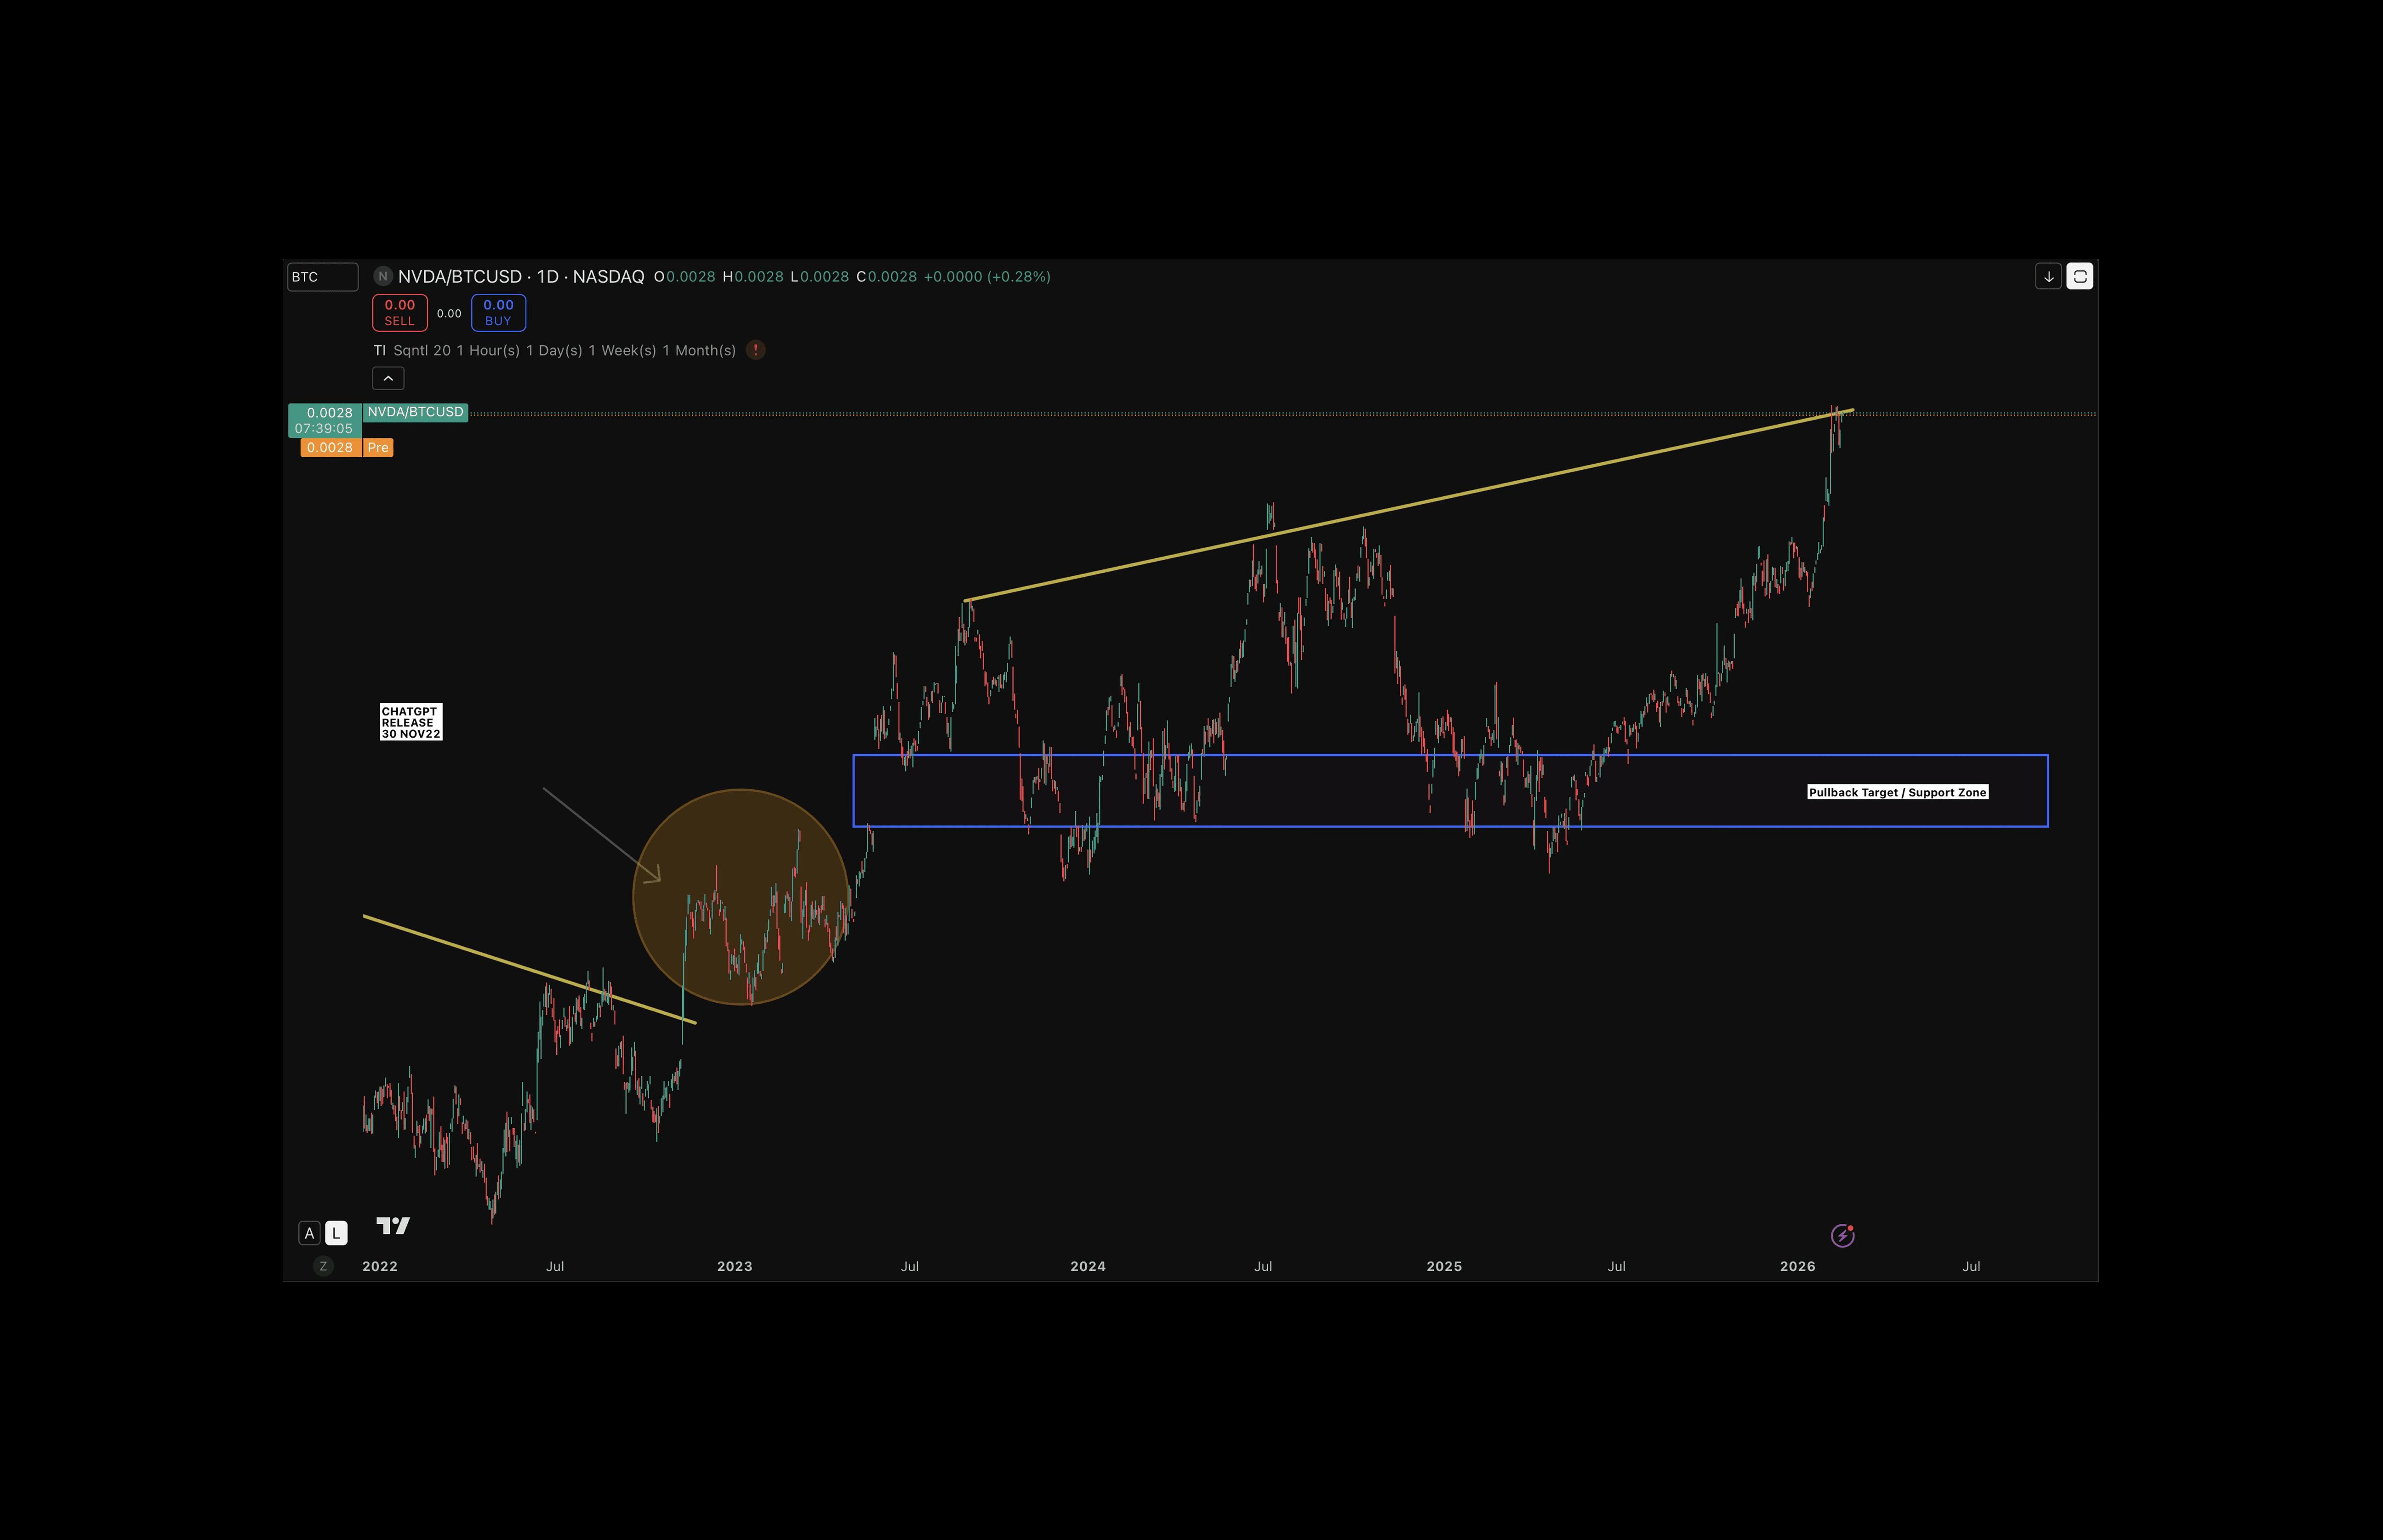
NVDA/BTC Daily timeframe
Fast forward to February 2026, and the ratio is now hitting resistance for the third time since the breakout, around 180% above the ChatGPT launch levels.
This is a classic decision zone. Either Nvidia breaks out to new highs against Bitcoin, a move that could technically extend another 800%+ if the channel projection plays out, or it gets rejected, and liquidity starts rotating back toward Bitcoin.
If you want a straightforward way to read charts, check out this ebook. In about 90 minutes, you’ll understand exactly when to enter and exit, clean and simple.
자주 묻는 질문
How much has Nvidia outperformed Bitcoin since April 2021?
Since April 2021, Nvidia has outperformed Bitcoin by around 1,200%.
What long-term structure did the NVDA/BTC ratio form starting in 2017?
It formed a descending wedge defined by persistent lower highs and lower lows converging to an apex.
What key event occurred on the NVDA/BTC chart around November 30, 2022?
Following ChatGPT’s launch on November 30, 2022, Nvidia broke out decisively against Bitcoin, ending the multi-year wedge.
What is significant about the NVDA/BTC ratio in February 2026?
By February 2026, the ratio is hitting major resistance for the third time since the breakout, about 180% above the ChatGPT launch levels, creating a decision zone where it may either break out to new highs with a potential 800%+ extension or be rejected, leading to liquidity rotating back toward Bitcoin.
면책 조항
이 글에 제공된 정보는 정보 제공을 위한 것입니다. 이는 금융 자문으로 간주되어서는 안 되며, 금융 자문을 의미하지 않습니다. 우리는 이 정보의 완전성, 신뢰성, 정확성에 대해 어떠한 보증도 하지 않습니다. 모든 투자는 위험을 수반하며 과거의 실적이 미래의 결과를 보장하지 않습니다. 투자 결정을 내리기 전에 금융 자문가와 상담할 것을 권장합니다.


