


Quick summary
DRV is a thin-liquidity small-cap token with a clean, tradeable base structure developing
Price around €0.089 sits above recent bases and a rising trendline from March 2026
Key buy zones are €0.065–0.070 base and deeper €0.038–0.044 gap support
Primary exit target is €0.115–0.120 backward base, with predefined upside and downside levels
Market cap $74.88M.
Ranked #273 on CoinMarketCap.
This is a small-cap token, the kind where liquidity is thin, moves are fast, and most people have not heard of it yet.
After going through the Derive (DRV) fundamentals, the chart structure is clean enough to map out potential entries. Tracking it for a few months and with the fundamentals holding for at least another year it's worth watching.
What the chart is saying:
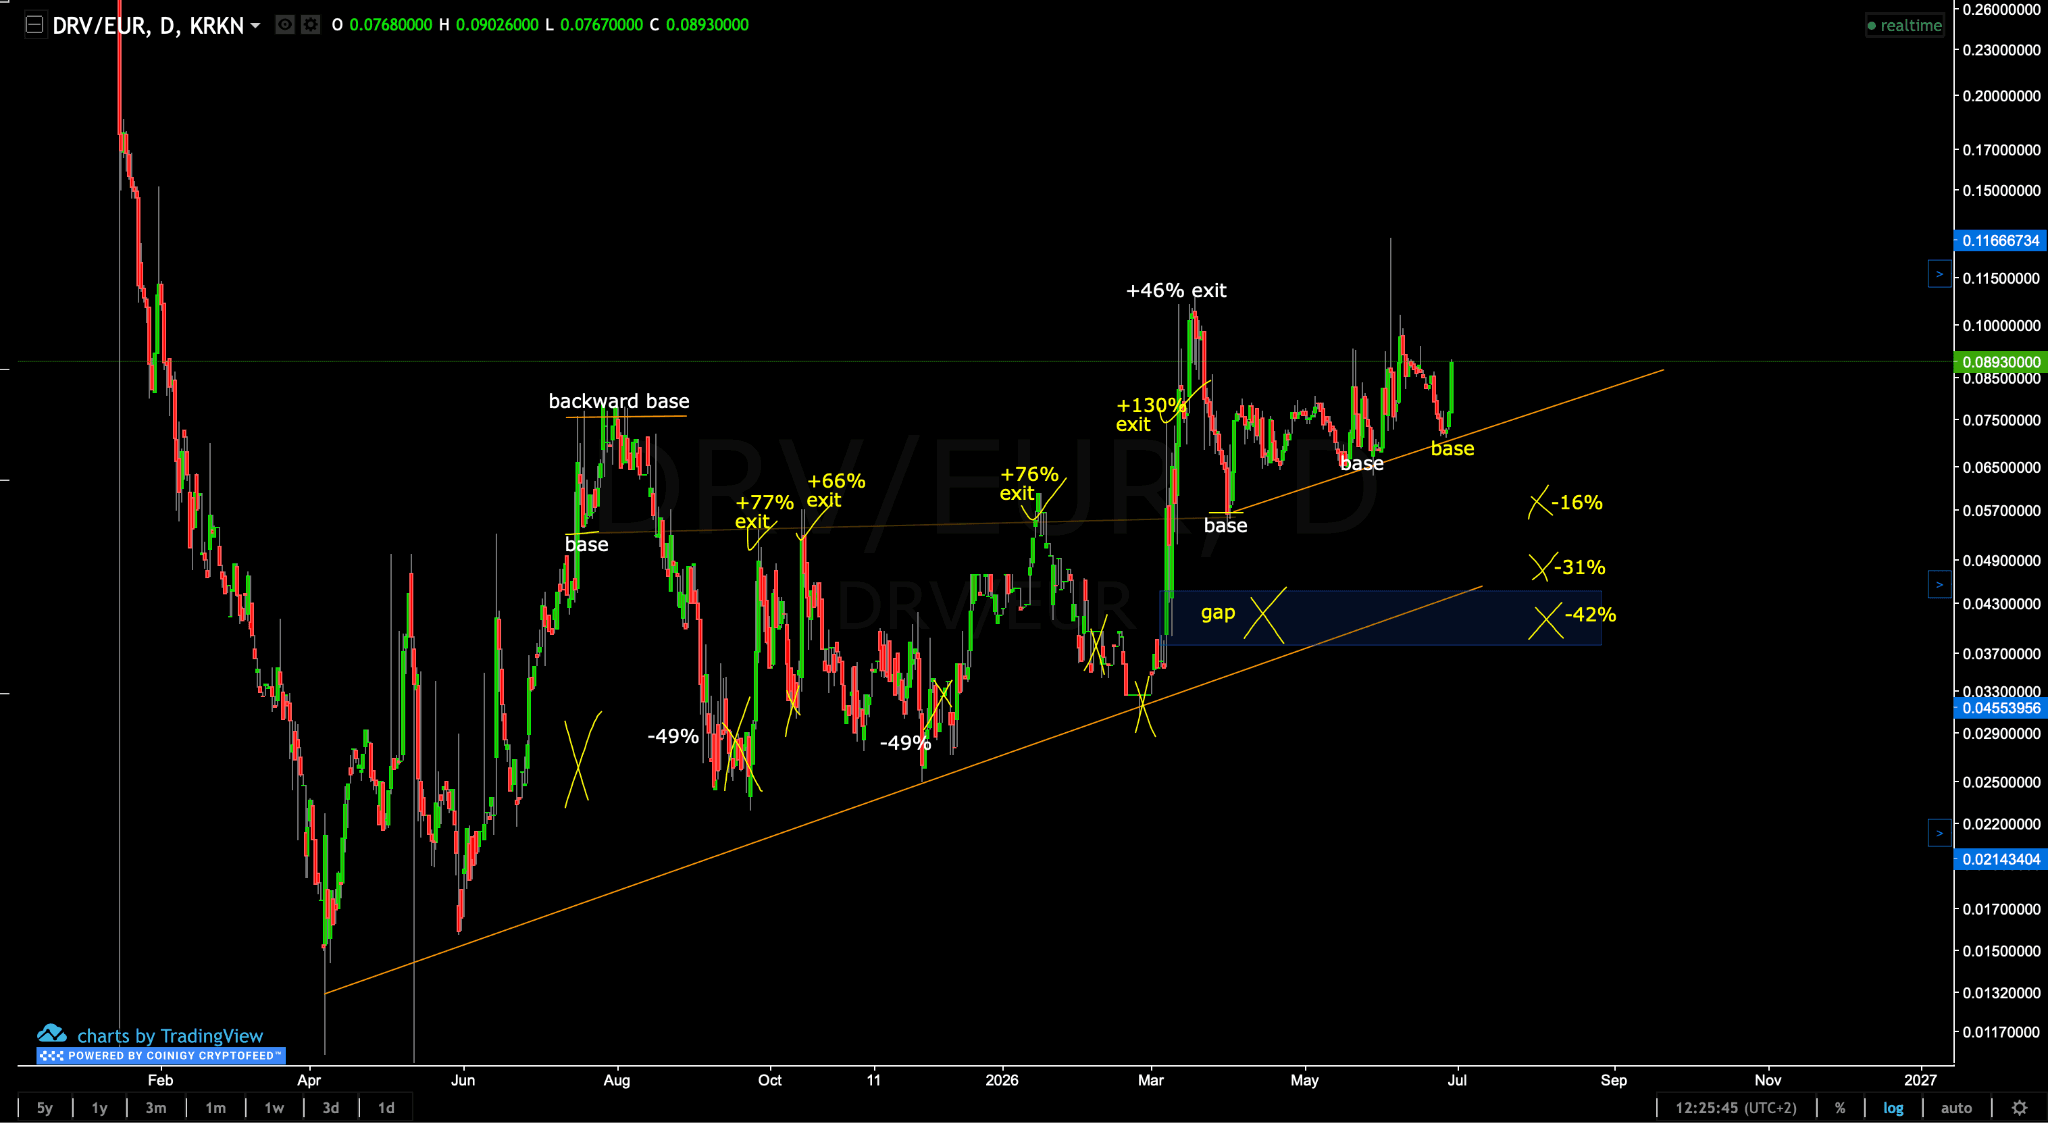
Base: Multiple bases and backward bases identified. Set up limit orders below a base of your risk and time tolerance
The trade history on this chart: Multiple opportunities for decent percentage gain from base structure setups across late 2025 and before. Exits of +77%, +66%, +76%, +130%, +46% all from entries near confirmed bases
Where price is right now: Around €0.089, sitting above two recently confirmed bases on the right side of the chart look to retest the backward base. A rising trendline from the March 2026 low is holding beneath it
The gap zone: The blue shaded area around €0.038–0.044 is the gap left behind after the big move up in early 2026. That gap is unfilled. If price corrects and the bases beneath current price fail, that zone is a meaningful reference point to capture a bottom target at the -31% to -42% targets marked on the chart

Which Entries Look Appetizing:
The base directly below current price, around the €0.065–0.070 area.
If that base fails and price pushes into the gap zone (€0.038–0.044), that becomes the deeper accumulation area. More risk is likely.
Where I would be looking to exit:
The backward base overhead at the resistance zone that has capped every rally on this chart, sits around €0.115–0.120. That was the fractal high in March 2026. It is the natural first target from any base entry.
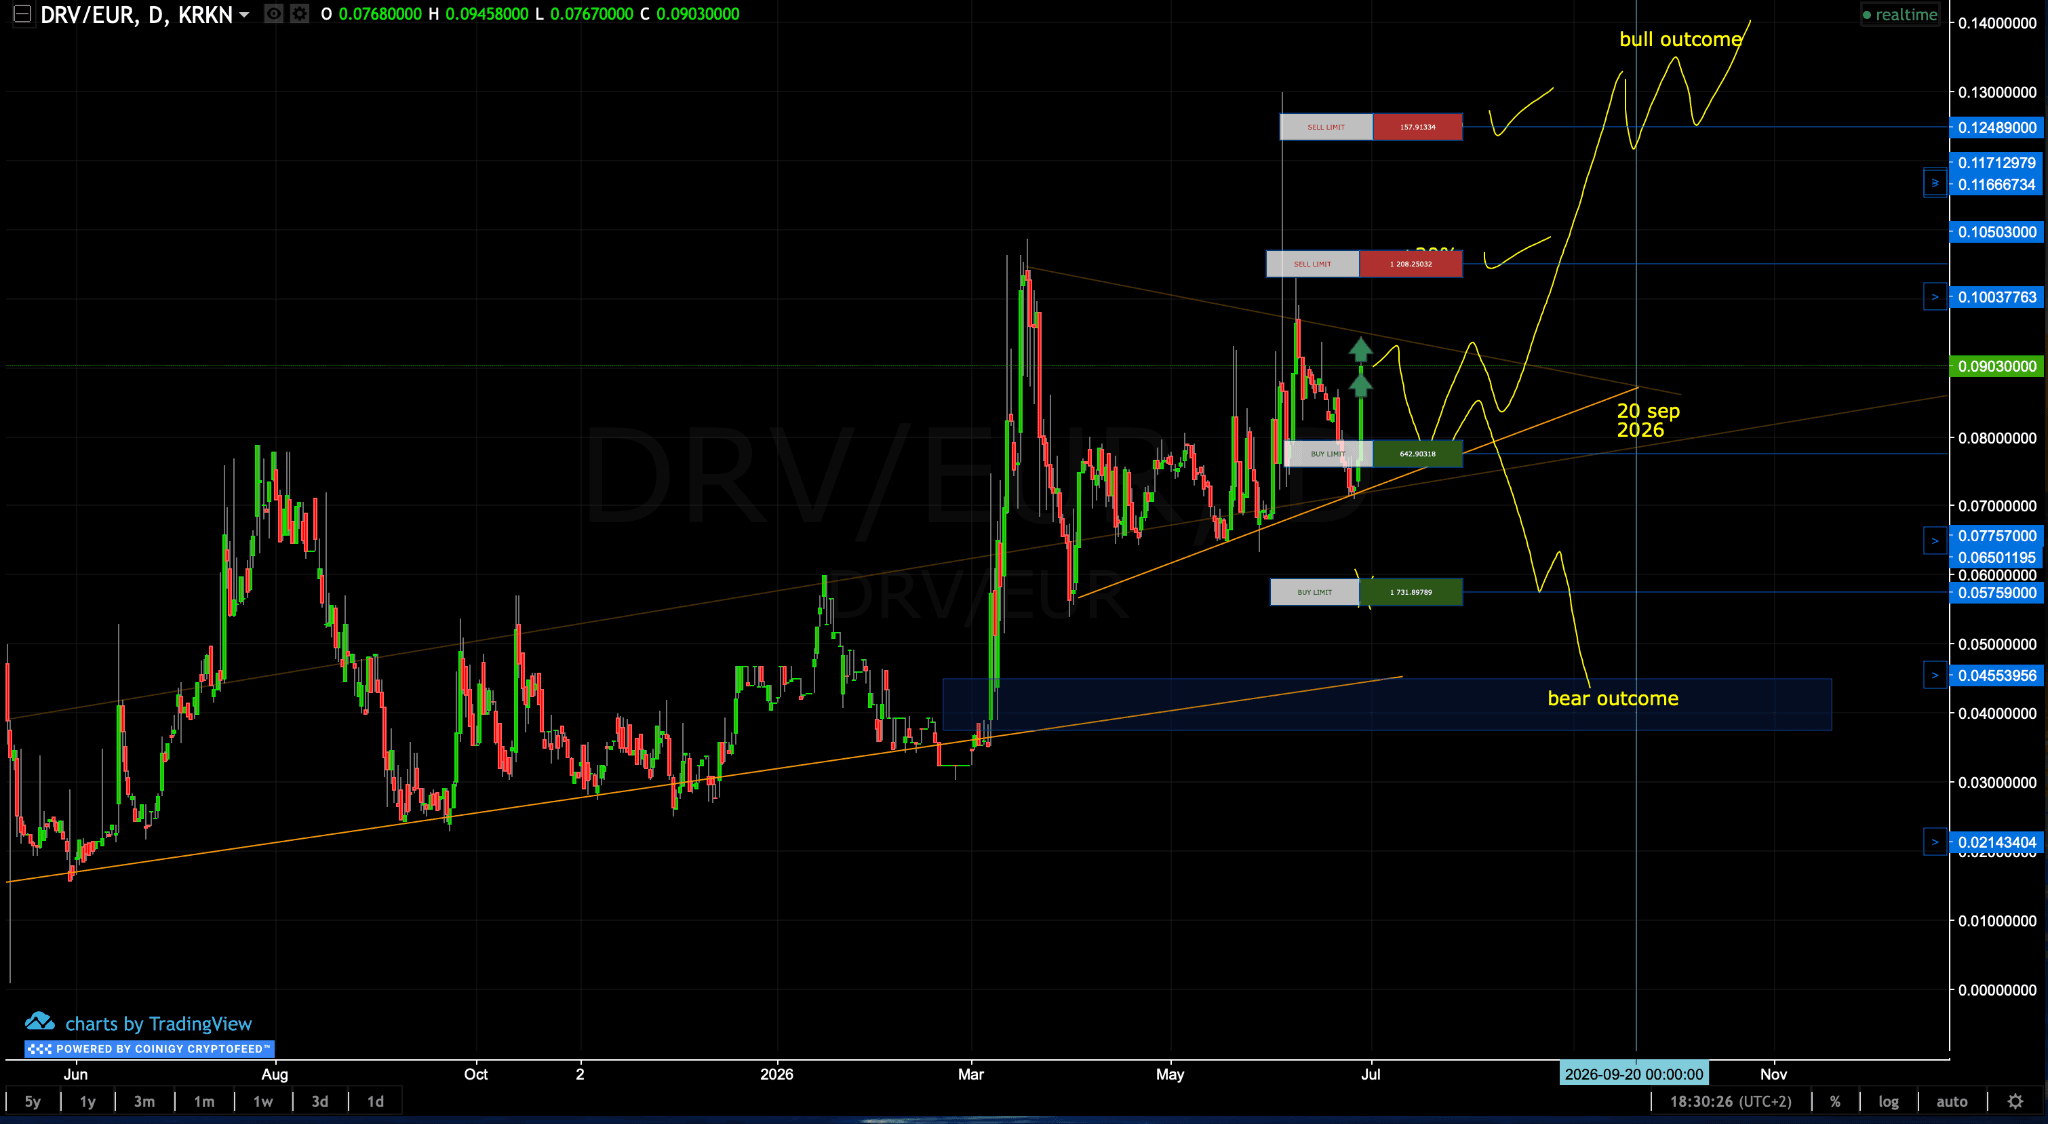
The position is open. Exits are set above. Reload levels are set below. Now it waits.
This is the setup with partial position on, exits planned above, reload levels planned below. I may have entered a little early, and the chart acknowledges that with the buy limit orders sitting lower if price pulls back further.
This is not a call. It is a map of the structure as I read it. Small cap, real liquidity risk, and the -49% scenarios.
If you want to understand the base structure framework behind this kind of chart reading, that is what the Coinjuice trading ebook is built around. It is one of the cleaner methods for reading setups on a chart like this, straightforward once you see it, and worth having in your toolkit.
FAQ
What kind of token is DRV in terms of size and liquidity?
DRV is a small-cap token with a market cap of $74.88M, ranked #273 on CoinMarketCap, where liquidity is thin, moves are fast, and most people have not heard of it yet.
How is the DRV/EUR daily chart structured and interpreted?
Time runs from early 2025 to late 2026 on the horizontal axis, price in euros is on a logarithmic vertical axis, and each candle is one day, with green candles closing higher than they opened and red candles closing lower. A rising orange trendline connects major lows, and a blue gap zone highlights a price area that was quickly skipped on the way up in early 2026.
Where are the key entry areas currently being watched for DRV?
The base directly below current price around €0.065–0.070 is an entry area. If that base fails and price moves into the gap zone at €0.038–0.044, that deeper zone becomes an accumulation area with more risk.
What are the main exit and downside reference levels on this setup?
The primary exit target is the backward base and resistance zone at €0.115–0.120, which was the fractal high in March 2026. Potential downside scenarios from current price are -16%, -31%, and -42%, with the €0.038–0.044 gap zone serving as a key reference for the -31% to -42% targets.
Disclaimer
The information provided in this article is for informational purposes only. It is not intended to be, nor should it be construed as, financial advice. We do not make any warranties regarding the completeness, reliability, or accuracy of this information. All investments involve risk, and past performance does not guarantee future results. We recommend consulting a financial advisor before making any investment decisions.
Written by

Andrew Kamsky
Andrew Kamsky is a Bitcoin analyst. He spent a decade in traditional finance across a Big Four firm and a listed fintech bank before going deep on Bitcoin full-time.


