• $

    Loading

    미국 달러

  • $

    Loading

    미국 달러

  • $

    Loading

    미국 달러

  • $

    Loading

    미국 달러

  • $

    Loading

    미국 달러

  • $

    Loading

    미국 달러

  • $

    Loading

    미국 달러

  • $

    Loading

    미국 달러

  • $

    Loading

    미국 달러

  • $

    Loading

    미국 달러

  • $

    Loading

    미국 달러

  • $

    Loading

    미국 달러

  • $

    Loading

    미국 달러

  • $

    Loading

    미국 달러

  • $

    Loading

    미국 달러

  • $

    Loading

    미국 달러

  • $

    Loading

    미국 달러

  • $

    Loading

    미국 달러

  • $

    Loading

    미국 달러

  • $

    Loading

    미국 달러

Bitcoin's 3,075-Day Momentum Signal: What 86% Bullish Time Above RSI 50 Reveals

앤드류 캠스

2026. 1. 13.

읽기 시간

5 mins

공유하기

오디오로 듣기

0:00/1:34

Bitcoin's 3,075-Day Momentum Signal: What 86% Bullish Time Above RSI 50 Reveals

빠른 요약

  • For 86 percent of the decade Bitcoin stayed above monthly RSI 50 signaling bullishness

  • The remaining 487 days below RSI 50 align with prolonged bears in 2018 and 2022

  • These bear markets saw price drops from 20,000 to 3,000 and 69,000 to 16,000

  • RSI 50 framework favors long trades above 50 and capital preservation below 50

The RSI-50 framework suggests favoring long exposure when RSI is above 50, while prioritizing capital preservation when it falls below. For 86% of the past decade, Bitcoin has maintained bullish RSI momentum on the monthly timeframe. That's 3,075 days above RSI 50 out of 3,562 total days analyzed a pattern that redefines what "normal" looks like for Bitcoin's market structure.

On January 13, 2026, Bitcoin's monthly RSI sat at 56, above the dividing line that has defined trend direction for nearly ten years. 

Breaking Down Bitcoin's Monthly RSI History Since 2016

From April 2016 through January 13, 2026, Bitcoin's monthly Relative Strength Index tells an unambiguous story. The asset has experienced only two meaningful periods below the critical 50 threshold:

  • November 2018 to April 2019: 5 months (151 days) below 50 

  • May 2022 to April 2023: 11 months (336 days) below 50

Taken together, bearish momentum accounted for just 487 days, or 13.7% of the total period analyzed. Throughout the remaining 3,075 days, RSI stayed above 50, indicating that monthly gains consistently outweighed losses.

Viewed on the chart, those 3,075 days above RSI 50 encompass every major rally since 2016, while the brief 487-day stretch below 50 corresponds exclusively to the two prolonged bear markets of the era.

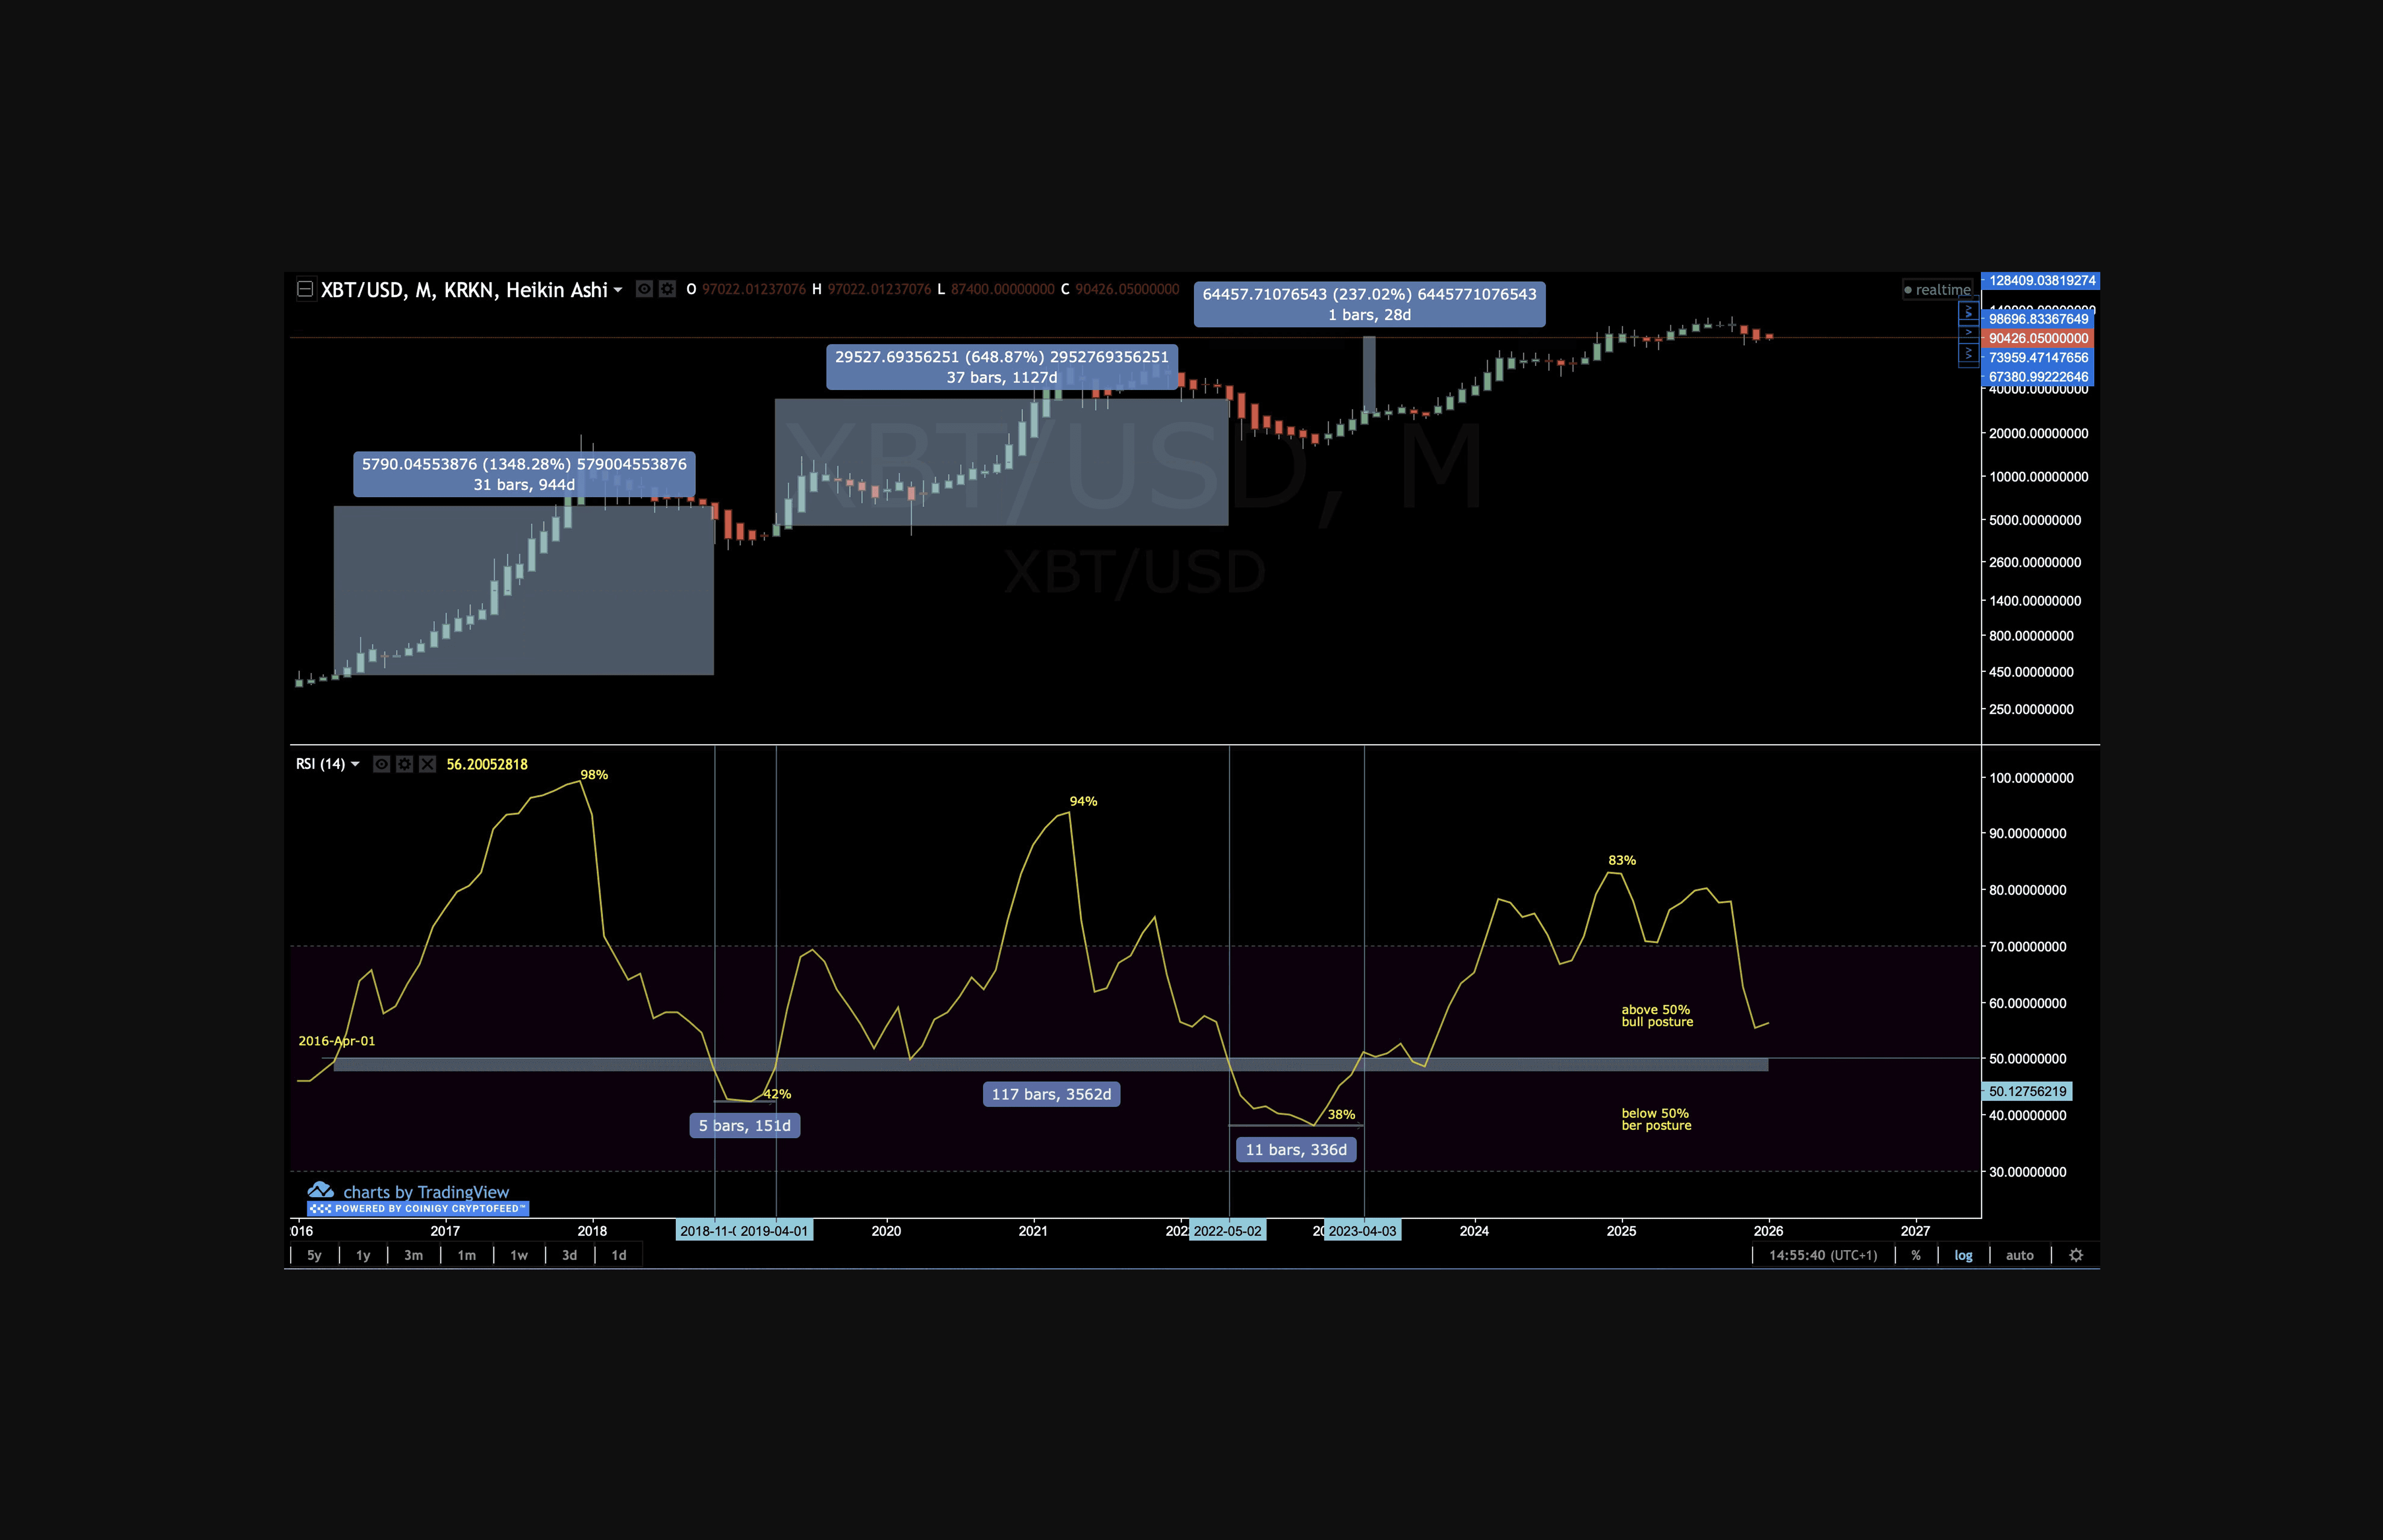
Bitcoin RSI Monthly Above 50% for 3,075 days out of 3,562 total days analyzed

The two bear markets weren't brief dips. 

  • 2018-2019:  This period saw Bitcoin collapse from $20,000 on November 28, 2017 to approximately $3,000.

  • 2022-2023: The correction dropped prices from $69,000 on November 10, 2021 to approximately $16,000.

These substantial declines were temporary interruptions in a larger bullish structure that reasserted itself once RSI reclaimed 50.  When RSI crossed back above 50 in January 2023, Bitcoin was trading around $17,000. Within two years, it rallied past $100,000.

Current Status: RSI at 56 and Holding Above Support

As of January 13, 2026, Bitcoin's monthly RSI reads 56 three points above the line that separates bullish from bearish momentum trends. While weekly timeframes have shown consolidation recently, the monthly indicator remains in bullish territory, consistent with the pattern that has dominated for 86% of the past decade.

This matters because the 50 level isn't arbitrary. It represents the point where recent buying pressure equals recent selling pressure. Above it, bulls have control. Below it, bears take over. At 56, Bitcoin maintains a constructive momentum posture.

Why the RSI 50 Framework Works for Bitcoin

Traditional RSI analysis focuses on 30/70 levels buying "oversold" conditions and selling "overbought" readings. 

This framework breaks down in strongly trending assets like Bitcoin, where momentum can remain elevated for extended periods during bull markets, while prices can stay suppressed throughout prolonged bear phases.

The RSI 50 framework, detailed in our previous analysis, offers a better approach.

  • Above 50 RSI: Suggests conditions favor long positioning and trend continuation. 

  • Below 50 RSI: Indicates increased downside risk and defensive posturing appropriate.

For active traders, when monthly RSI is:

  • Above 50 RSI: Default bias looking for entries on pullbacks rather than shorting strength.

  • Below 50 RSI: Capital preservation takes priority over aggressive positioning.

Bitcoin's history validates the RSI 50 framework interpretation.

The chart highlights 3,075 days in which RSI remained above 50, coinciding with every major rally since 2016. In contrast, the 487 days below 50 align precisely with the only two prolonged bear markets during that period.

Conclusion

Bitcoin has maintained bullish momentum for 3,075 of the past 3,562 days on the monthly timeframe. Two brief bear marketstotaling just 487 days, accounted for the remaining time. With RSI currently at 56, Bitcoin remains in the same bullish posture that has characterized 86% of its market structure since 2016.

The RSI 50 framework doesn't forecast direction. It identifies conditions. At 56, Bitcoin sits comfortably above the threshold that has mattered for a decade. Whether momentum continues or eventually breaks below 50 will emerge through price action. Until then, the data suggests one thing clearly: betting against Bitcoin's dominant trend has been wrong 86% of the time.

자주 묻는 질문

What does it mean that Bitcoin has spent 3,075 days above RSI 50 since 2016?

It means that for about 86% of the 3,562 days analyzed on the monthly timeframe, Bitcoin’s RSI was above 50, indicating that monthly gains consistently outweighed losses and that bullish momentum has been the dominant state.

When did Bitcoin’s monthly RSI fall below 50, and for how long?

Bitcoin’s monthly RSI fell below 50 during two periods: from November 2018 to April 2019 for 5 months (151 days), and from May 2022 to April 2023 for 11 months (336 days), totaling 487 days below 50.

How did Bitcoin’s price behave during the two bear markets linked to RSI below 50?

In the 2018–2019 bear market, Bitcoin fell from $20,000 to about $3,000. In the 2022–2023 bear market, it dropped from $69,000 to about $16,000. These declines were temporary interruptions in a larger bullish structure that resumed after RSI moved back above 50.

What is the RSI 50 framework and how is it used for Bitcoin?

The RSI 50 framework treats 50 as the key dividing line: above 50, conditions favor long positioning and trend continuation; below 50, downside risk is higher and capital preservation becomes the priority. It does not forecast direction but identifies whether bulls or bears have control.

면책 조항

이 글에 제공된 정보는 정보 제공을 위한 것입니다. 이는 금융 자문으로 간주되어서는 안 되며, 금융 자문을 의미하지 않습니다. 우리는 이 정보의 완전성, 신뢰성, 정확성에 대해 어떠한 보증도 하지 않습니다. 모든 투자는 위험을 수반하며 과거의 실적이 미래의 결과를 보장하지 않습니다. 투자 결정을 내리기 전에 금융 자문가와 상담할 것을 권장합니다.

공유하기

작성자

앤드류 캠스

2026. 1. 13.

공유하기

작성자

앤드류 캠스

2026. 1. 13.

당신이 찾던 유일한 전자책

이 전자책은 기본적으로 암호화폐 치트 시트입니다. 첫 거래를 시작하기 위해 알아야 할 모든 것을 담고 있으며, 복잡한 용어 없이 쉽게 이해할 수 있습니다.

당신이 찾던 유일한 전자책

이 전자책은 기본적으로 암호화폐 치트 시트입니다. 첫 거래를 시작하기 위해 알아야 할 모든 것을 담고 있으며, 복잡한 용어 없이 쉽게 이해할 수 있습니다.

당신이 찾던 유일한 전자책

이 전자책은 기본적으로 암호화폐 치트 시트입니다. 첫 거래를 시작하기 위해 알아야 할 모든 것을 담고 있으며, 복잡한 용어 없이 쉽게 이해할 수 있습니다.

당신이 찾던 유일한 전자책

이 전자책은 기본적으로 암호화폐 치트 시트입니다. 첫 거래를 시작하기 위해 알아야 할 모든 것을 담고 있으며, 복잡한 용어 없이 쉽게 이해할 수 있습니다.