• $

    Loading

    미국 달러

  • $

    Loading

    미국 달러

  • $

    Loading

    미국 달러

  • $

    Loading

    미국 달러

  • $

    Loading

    미국 달러

  • $

    Loading

    미국 달러

  • $

    Loading

    미국 달러

  • $

    Loading

    미국 달러

  • $

    Loading

    미국 달러

  • $

    Loading

    미국 달러

  • $

    Loading

    미국 달러

  • $

    Loading

    미국 달러

  • $

    Loading

    미국 달러

  • $

    Loading

    미국 달러

  • $

    Loading

    미국 달러

  • $

    Loading

    미국 달러

  • $

    Loading

    미국 달러

  • $

    Loading

    미국 달러

  • $

    Loading

    미국 달러

  • $

    Loading

    미국 달러

Bitcoin Technical Analysis: Reading Price from Left to Right to Plan Entries

앤드류 캠스

2026. 1. 21.

읽기 시간

6 mins

공유하기

오디오로 듣기

0:00/1:34

Bitcoin Technical Analysis: Identifying Low-Risk Entry Zones at $77,900

빠른 요약

  • Price sits around $88,495 below multiple key bases, but monthly RSI remains above 50, preserving bullish bias.

  • Three months into correction from October 2025 high; $100K medium base remains unresolved

  • November 2024 CME gap ($76K-$80K) filled multiple times throughout 2025, now a primary bounce zone

  • First entry: $78K (±3%) approximately 12% below current price, beneath multiple base structures

  • Deeper backup: $71K zone 5% below the $80K strong base if capitulation accelerates

  • Set panic buy entries in advance using limit orders instead of reacting emotionally when volatility hits

  • Either strength continues (buy limit orders remain in cash) or weakness creates opportunity at predefined levels putting limit orders to work during a panic

Current Price: $88,495 | Daily timeframe perspective

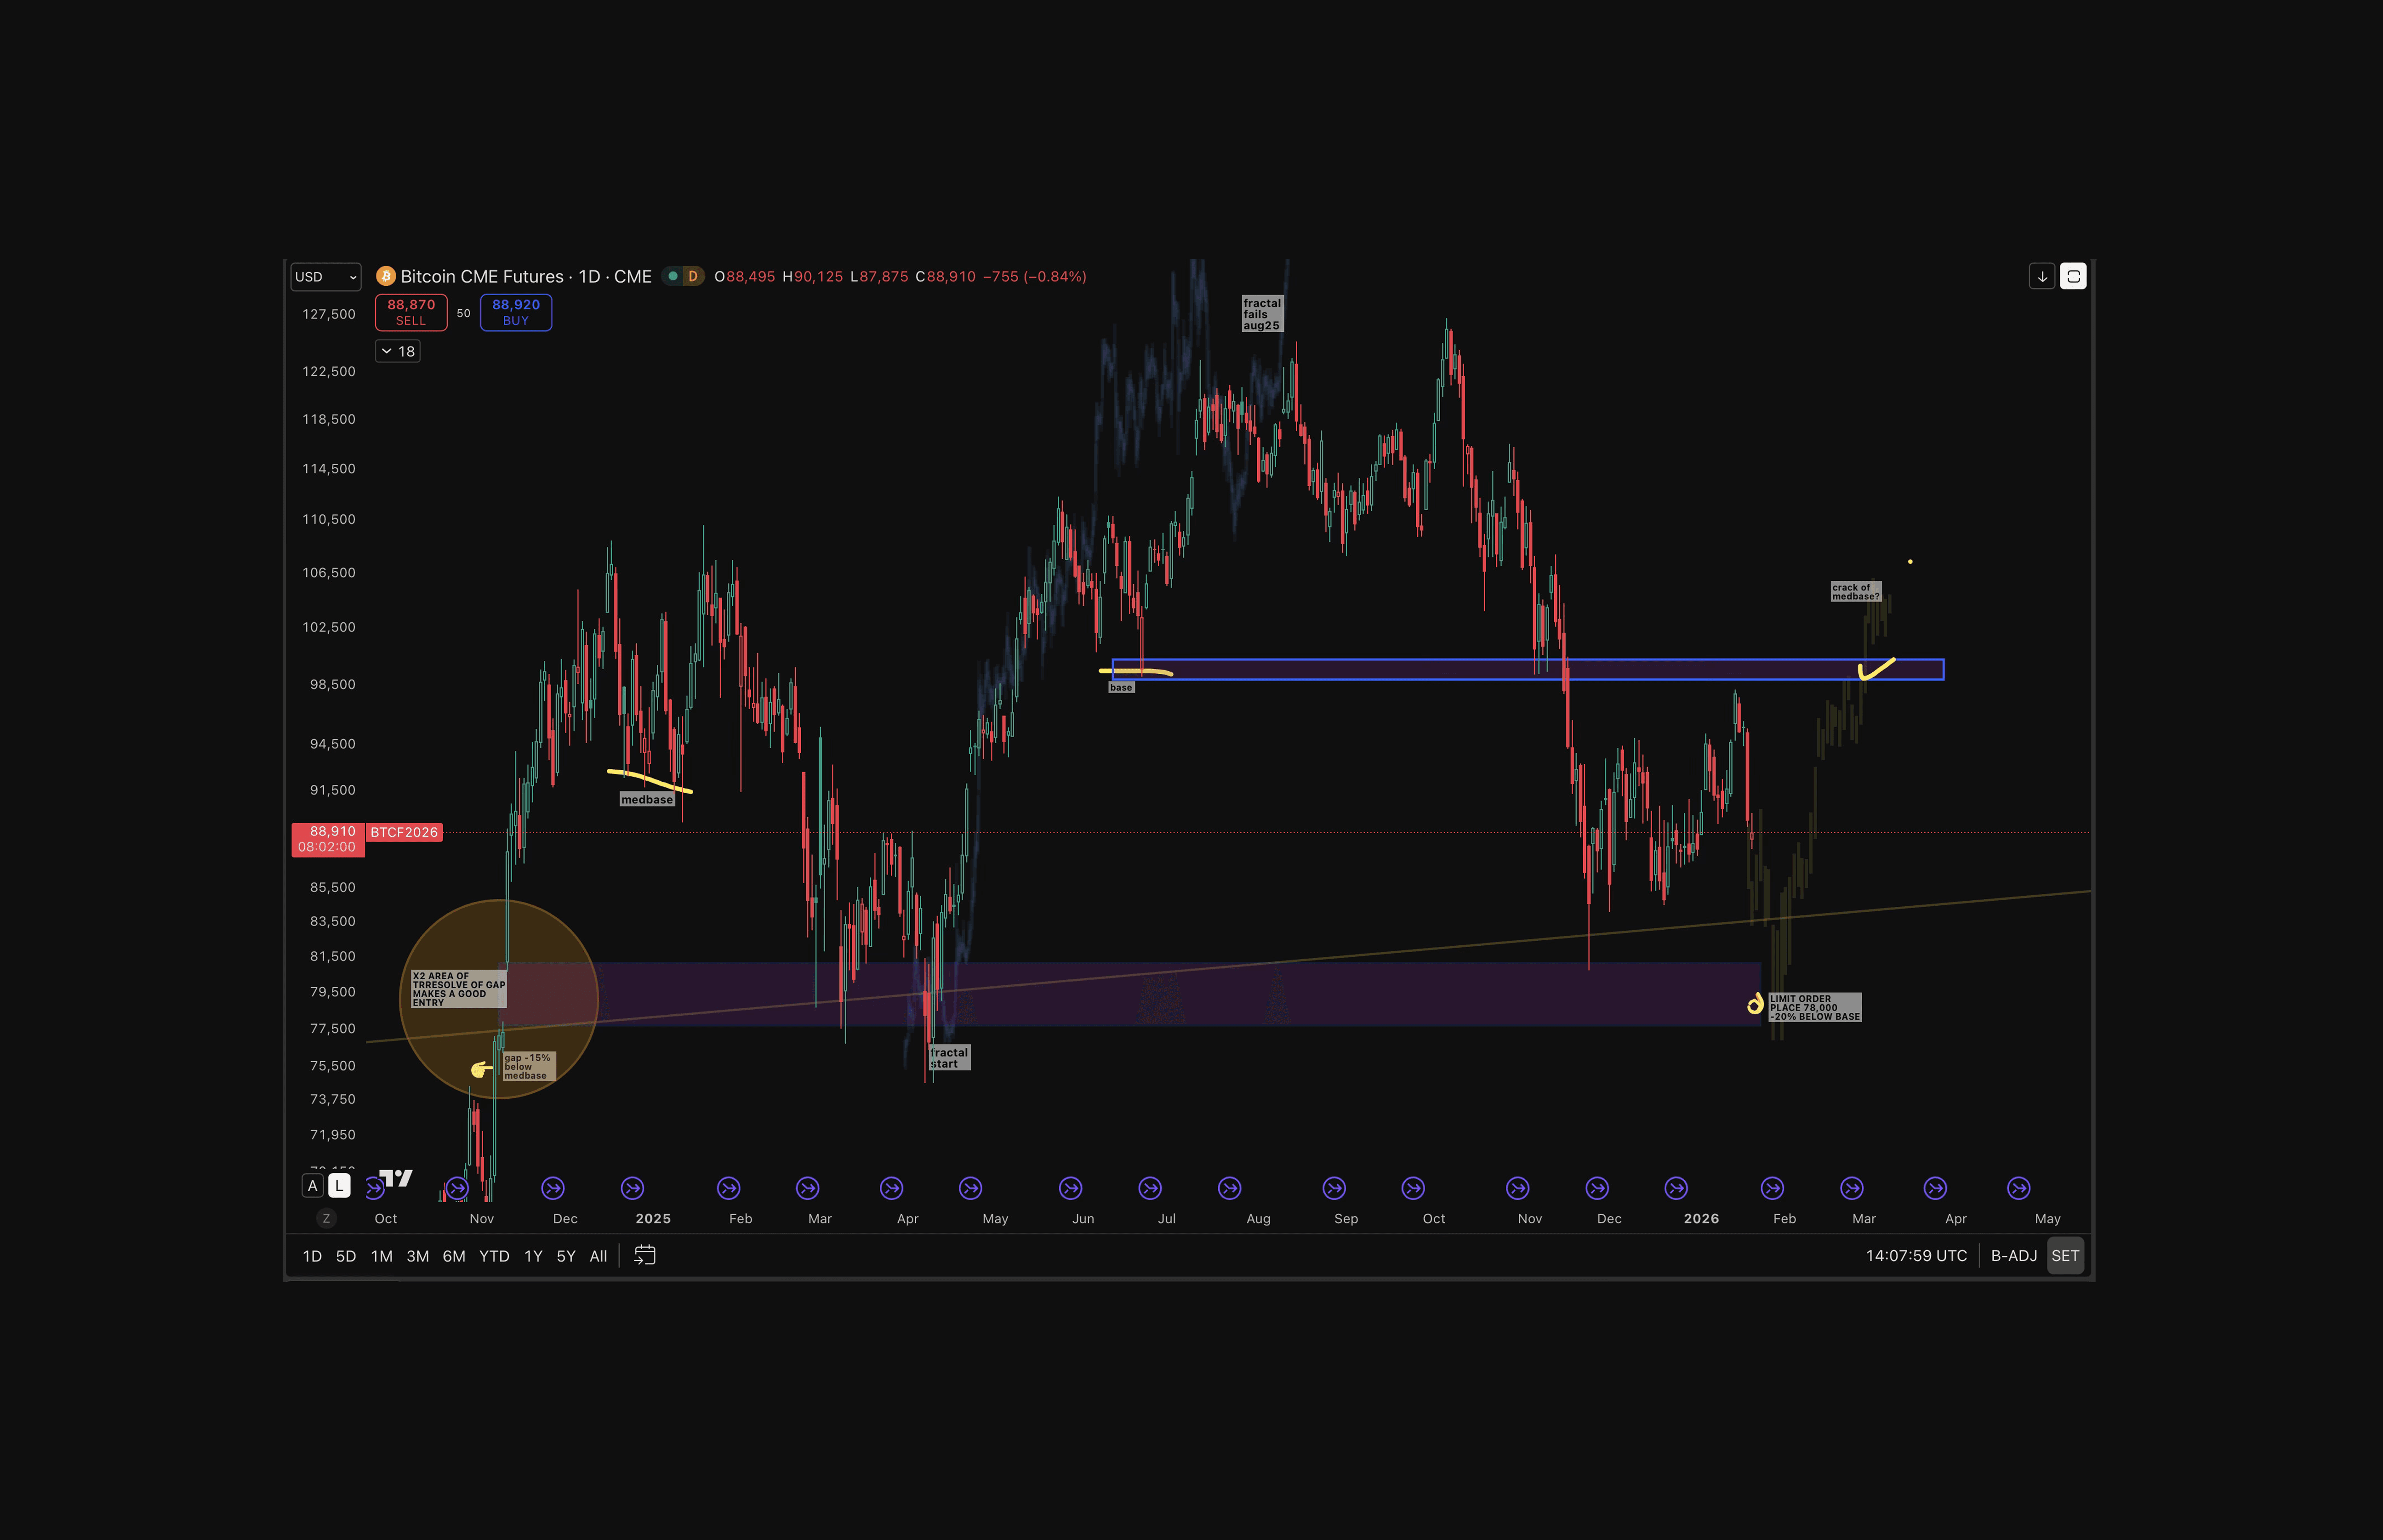
Bitcoin CME Future daily chart | Use this chart to scout for possible entry lows via “gaps”

This analysis prepared on January 21, 2025, identifies where a positional investor with a hodl stack or a trader might place an advantageous limit buy order for a low-risk higher probability bounce area entry. 

Starting Point: The Gap Resolution

Looking from the left side of the chart to the right side of the chart on top, a CME price gap formed in November 2024 on the daily timeframe (highlighted by the circle). Bitcoin jumped from roughly $76,000 to $80,000 in a single session, leaving no candle activity in between. What happened was it later consolidated around a $90,000 “medium base” level. Later cracking that base to refill the CME gap.

Why look for gaps?

  • Why gaps tend to fill: The gap creates an imbalance that markets often revisit. Making its price range a target for entries or exits.

  • When was the November 2024 gap filled?: Bitcoin retraced into the gap with a sharp wick in late February 2025, again in March and April 2025, and later formed a micro base within the gap in November 2025, a year later.

How to Hedge Volatility and Buy BTC on Market Panic

As long as monthly BTC RSI holds above ~49, Bitcoin remains in a bullish structural posture based on historical data going back to 2016. From that perspective, higher prices +-10% moves or sideways action are likely and acceptable. No action is required, and forcing trades out of boredom is rarely productive.

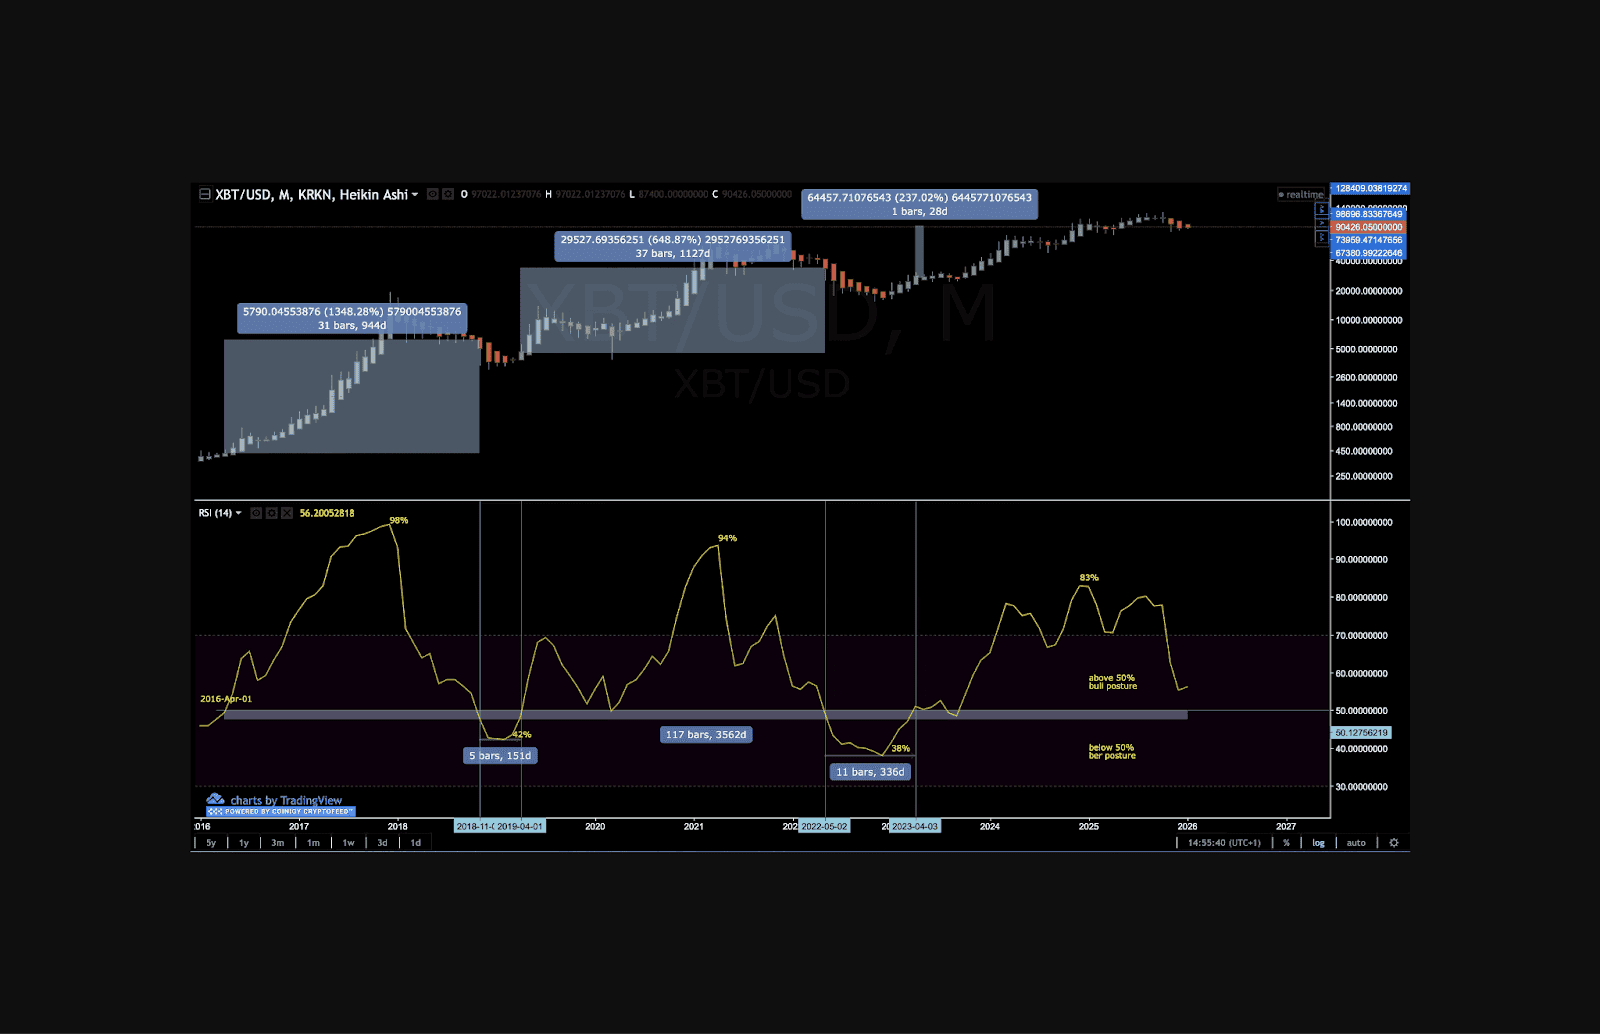
RSI Monthly timeframe illustrates below 50 is a bear market start. The current RSI is above 50. No need to panic yet but plan for the panic.

That said, preparation matters.

By identifying high-probability panic zones in advance and placing limit orders there, you create a plan to capitalize on any capitulation event without emotion. These orders can remain in place for extended periods, especially given the possibility that BTC may spend time in a broader bear or consolidation phase within its four-year cycle until October 2026.

At the same time, the chart below illustrates how to hedge a bullish bias by preparing for short-term downside volatility rather than predicting it.

Instead of guessing when panic might occur, the strategy is to predefine levels where buying into weakness makes sense and risk shifts in the odds of the buyer.

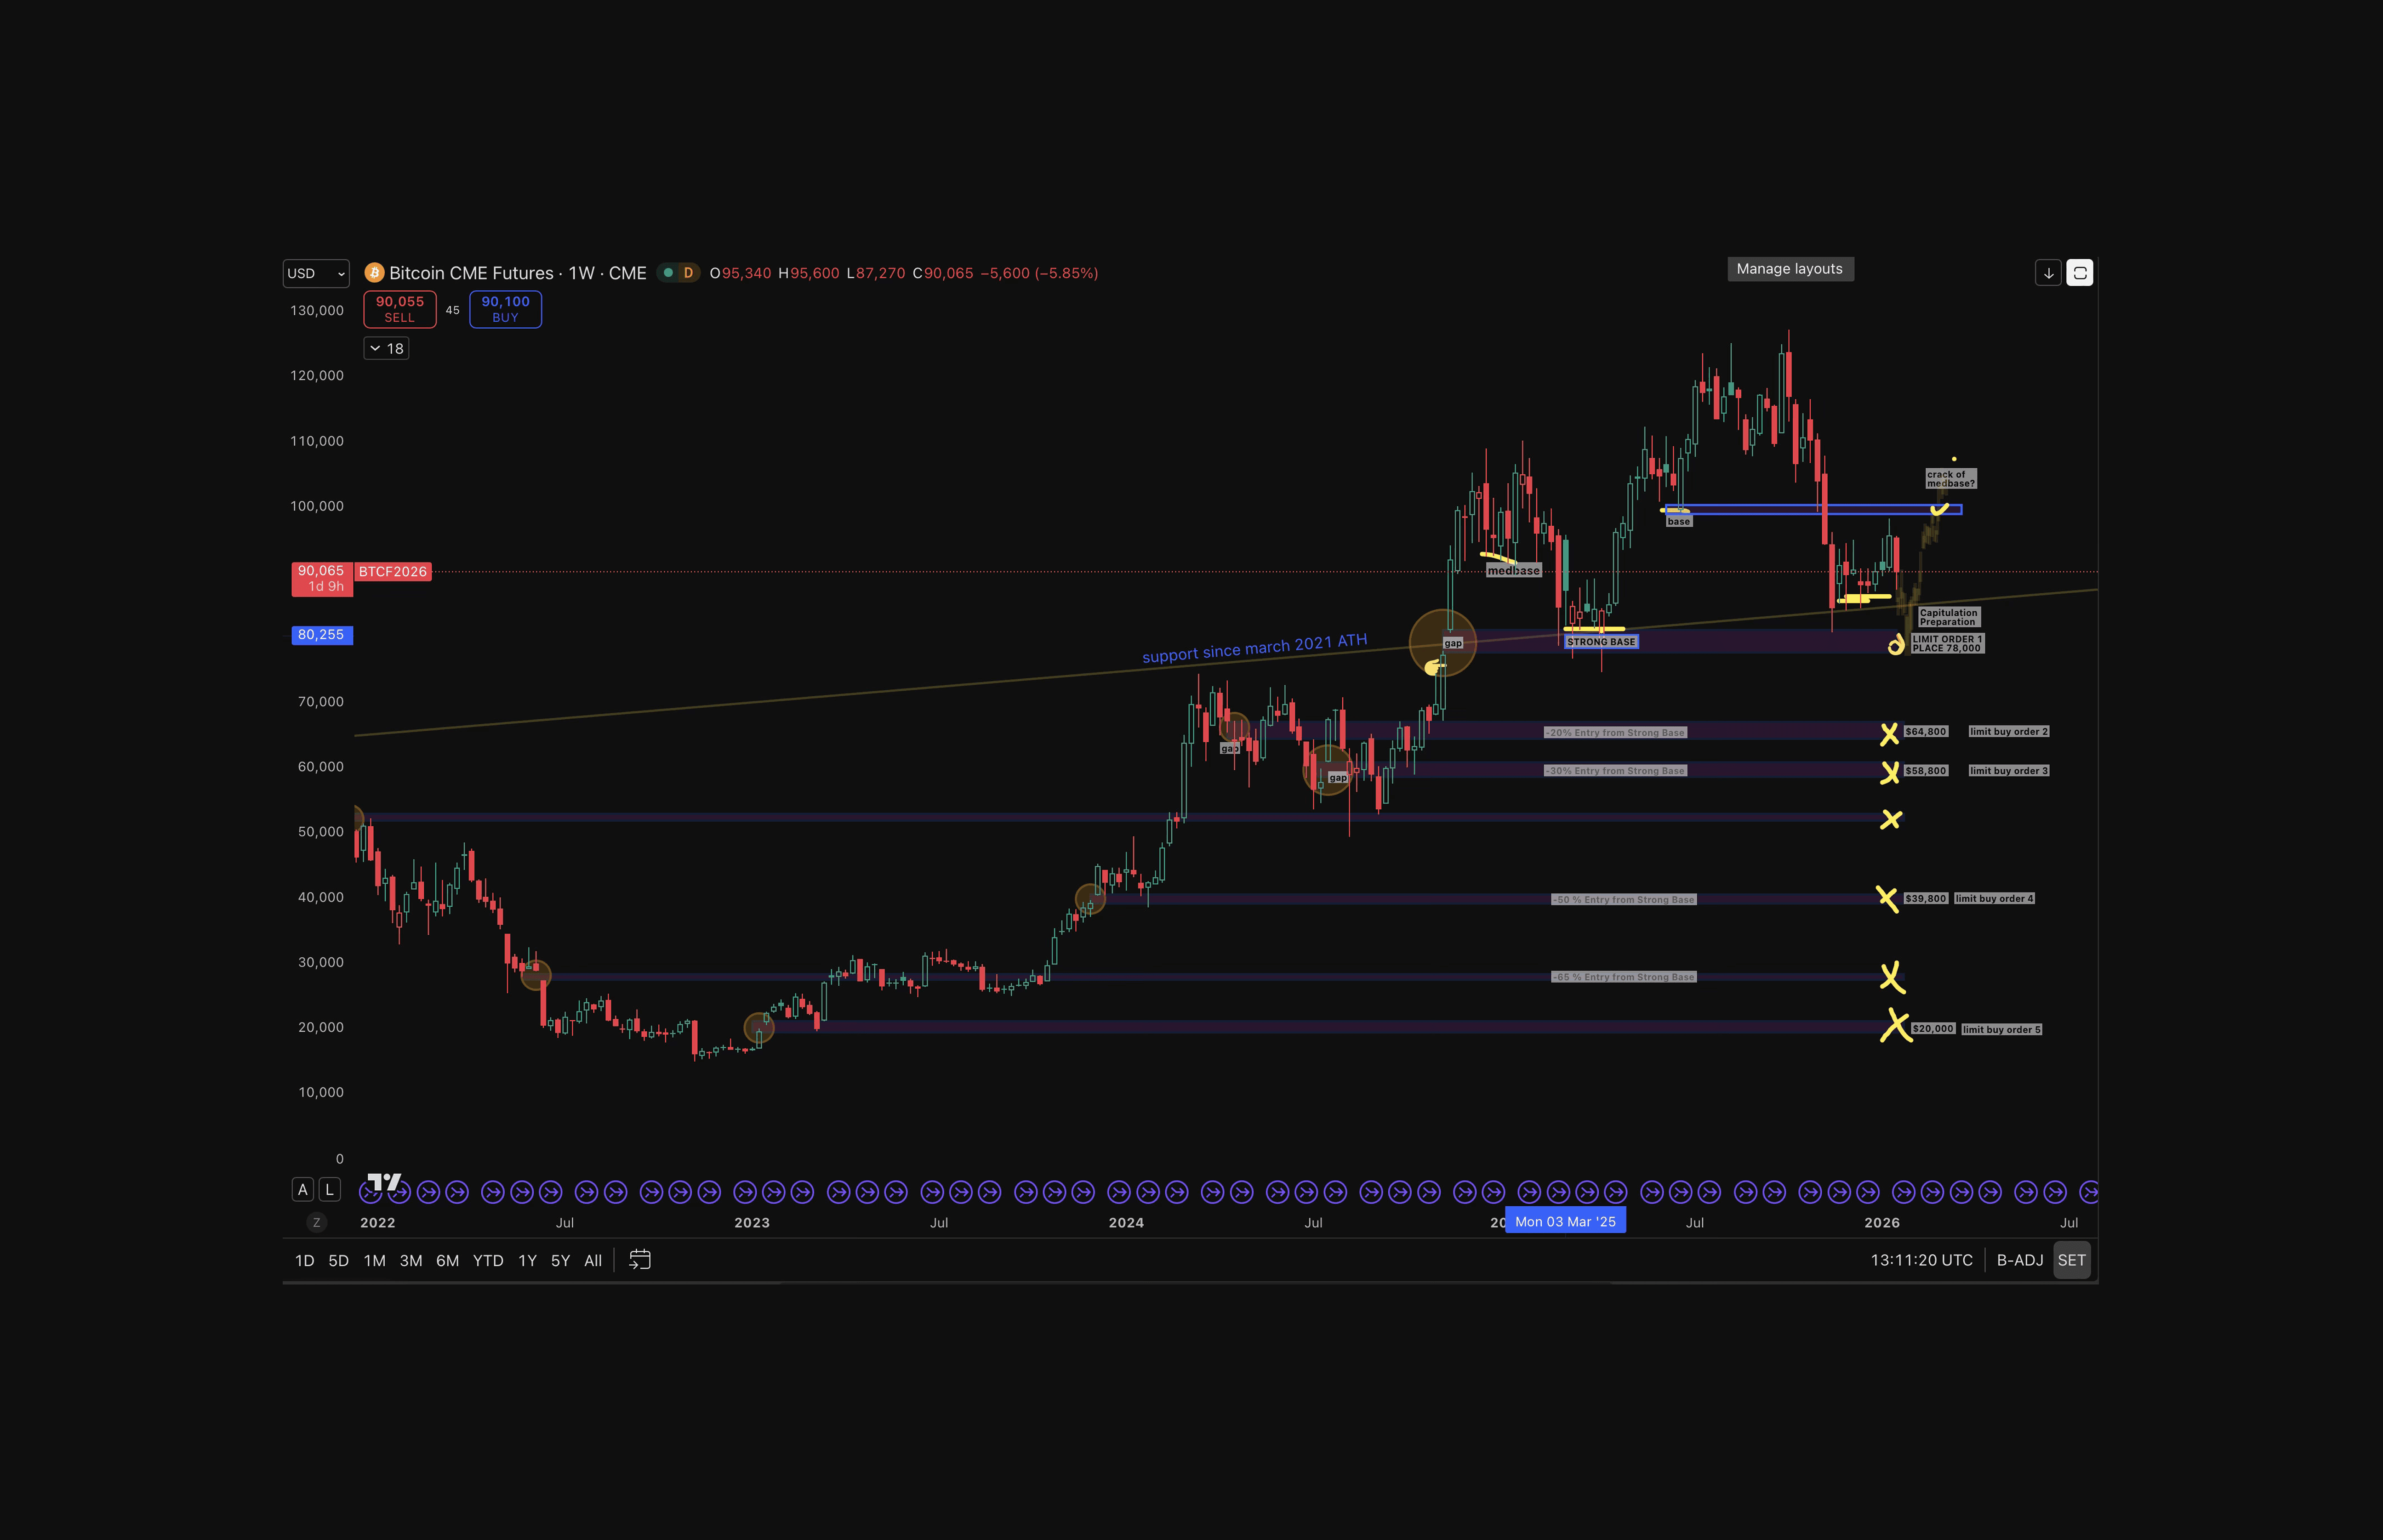
Limit order entries are aligned with prior CME gaps, highlighting historically reactive zones where price has repeatedly sought liquidity during drawdowns

The price entry order levels marked on the chart above are below a “strong base” meaning entries are not forced. From there, the first nibble or downside trade area of interest is the November 2024 CME gap, roughly 4% below the “strong base.” This level is suited for a smaller hedge position, allowing participation without overexposure if price flushes further into capitulation or selling into the “medium base” if price extends upwards.

Below that, a deeper demand zone appears around $71,000, approximately 15% below the $80K “strong base.” 

If price trades below both zones, the lower boxed region on the chart marks where BTC could attempt to form a local low might end up, while still remaining within a broader bullish structure.

The takeaway is balance:

  • If price continues higher, the bullish thesis remains intact and no action is needed.

  • If price pulls back sharply, limit orders are already in place to buy the dip strategically, not emotionally based on gap CME gap analysis.

Either outcome is acceptable, strength is respected, and weakness is treated as opportunity.

The First Entry Zone: $77,900

For position traders $78,000 (±3%) offers a compelling entry within a high-probability bounce zone. A limit order near $78,000 (approximately 12% below current price) sits beneath several base structures.

Why this level matters:

  • Time: We are arguably three months into the year’s corrective phase, assuming the October 6, 2025 high marked the cycle ATH. A relief rally might be close but being prepared for more downside is a good discipline.

  • Capitulation: A first capitulation event occurred on November 21, 2025. A second one is expected at some point or not.

  • Structure: The median base near $100,000 has not yet been cleanly resolved. A relief rally would satisfy the resolution of the “medium base.”

  • Probability: The likelihood of a second, deeper capitulation is unclear and highly dependent on how price responds to surrounding structure.

The Current Position: Below Key Bases

Price is currently trading beneath several structural bases formed over the past year, suggesting the market has entered a corrective phase, even though the depth and duration remain uncertain.

To learn more about how to trade base structure refer to the How to Trade Without Leverage ebook on Coinjuice.

The November–December 2025 low did establish initial support. However, in January 2026 the lack of sustained follow-through toward $100,000 leaves the “medium base” arguably unresolved, meaning this price level is still likely to be addressed at some point, either from current price or after an additional period of downside or consolidation lower.

If the latter unfolds entry levels listed above are likely to be close to a low.

This analysis is based on market structure and probability, not certainty. Markets are inherently unpredictable, and there are no guarantees. Position sizing, risk tolerance, and execution decisions remain the responsibility of each individual. This content is for informational purposes only and does not constitute financial or trading advice. Always do your own research.

자주 묻는 질문

What is the critical limit buy zone identified in this analysis, and why is it considered a compelling entry?

The critical limit buy zone is around $78,000 (±3%), approximately 12% below the current price. It is considered a compelling, high-probability bounce zone because it sits beneath several base structures and offers a low-risk entry for position traders.

What is the significance of the October 2024 CME gap in Bitcoin’s price structure?

In October 2024, Bitcoin jumped from roughly $76,000 to $80,000 in one session, creating a CME gap where no trading occurred. Such gaps create an imbalance that markets often revisit. This gap was later retraced with sharp wicks in late February 2025, again in March and April 2025, and a micro base formed within it in November 2025. A single limit order in the rectangle area of this gap may be advantageous if a capitulation takes place.

What does Bitcoin’s current position relative to key bases indicate about the market phase?

Price is trading beneath several structural bases formed over the past year, suggesting the market has entered a corrective phase, though the depth and duration are uncertain. The November–December 2025 low established initial support, but the lack of sustained follow-through toward $100,000 in January 2026 leaves the “medium base” near $100,000 arguably unresolved, meaning this level is still likely to be addressed from current price or after further downside or consolidation.

How does the monthly RSI reading shape the scenarios for Bitcoin’s next move and the role of the $77,900 limit order?

Despite price trading below the October 2025 high, Bitcoin is not technically in a bear market because the monthly RSI remains above 50, with a reading of 54 suggesting broader uptrend continuation. This supports two scenarios: (1) if the $77,900 limit order fills, price has corrected to a statistically advantageous entry, setting up a swing toward the ATH range or at least a retracement to sell near $84,600; (2) if price holds within about ±5% of current levels, Bitcoin may consolidate and later attempt a breakout toward the ATH and the $100,000 “medium base” retracement. With RSI in bullish territory, it is considered more likely that price does not reach the $77,900 limit, which serves as a safety net in case of a sharp, emotional move lower rather than as a prediction.

면책 조항

이 글에 제공된 정보는 정보 제공을 위한 것입니다. 이는 금융 자문으로 간주되어서는 안 되며, 금융 자문을 의미하지 않습니다. 우리는 이 정보의 완전성, 신뢰성, 정확성에 대해 어떠한 보증도 하지 않습니다. 모든 투자는 위험을 수반하며 과거의 실적이 미래의 결과를 보장하지 않습니다. 투자 결정을 내리기 전에 금융 자문가와 상담할 것을 권장합니다.

공유하기

작성자

앤드류 캠스

2026. 1. 21.

공유하기

작성자

앤드류 캠스

2026. 1. 21.

당신이 찾던 유일한 전자책

이 전자책은 기본적으로 암호화폐 치트 시트입니다. 첫 거래를 시작하기 위해 알아야 할 모든 것을 담고 있으며, 복잡한 용어 없이 쉽게 이해할 수 있습니다.

당신이 찾던 유일한 전자책

이 전자책은 기본적으로 암호화폐 치트 시트입니다. 첫 거래를 시작하기 위해 알아야 할 모든 것을 담고 있으며, 복잡한 용어 없이 쉽게 이해할 수 있습니다.

당신이 찾던 유일한 전자책

이 전자책은 기본적으로 암호화폐 치트 시트입니다. 첫 거래를 시작하기 위해 알아야 할 모든 것을 담고 있으며, 복잡한 용어 없이 쉽게 이해할 수 있습니다.

당신이 찾던 유일한 전자책

이 전자책은 기본적으로 암호화폐 치트 시트입니다. 첫 거래를 시작하기 위해 알아야 할 모든 것을 담고 있으며, 복잡한 용어 없이 쉽게 이해할 수 있습니다.