


빠른 요약
2023년에 각인이 등장하여 대량의 데이터를 내포하고 일반 결제 거래와 경쟁했습니다
거래 수수료가 증가하여 최고 기간 동안 7,092 BTC의 채굴자 수익을 발생시켰습니다
노드 운영자는 추가 저장 공간(80–100GB)을 흡수하면서 전체 노드 수는 안정적으로 유지되었습니다
이 에피소드는 희소한 블록 공간, 시장 기반 수수료 할당, 그리고 지속적인 문맥과 영속성이 주입된 온체인 데이터를 강조했습니다
비트코인 각인은 개별 사토시에 데이터를 연관시키는 새로운 방법으로 2023년 초에 활성화되어 비트코인 블록에 직접 기록된 임의의 데이터를 의미합니다. 기본 메커니즘은 다른 곳에서 다뤄지지만, 각인의 출현은 비트코인의 제한된 블록 공간에 대한 새로운 수요를 불러일으켰습니다.
실험적 사용으로 시작된 것이 빠르게 확장되었습니다. 각인 양이 증가함에 따라 데이터 중점의 거래가 표준적인 비트코인 결제와 블록 포함을 위해 경쟁하기 시작했습니다. 비트코인의 수수료 시장과 채굴자 수익 역학을 물질적으로 변화시켰습니다. 이 기사는 2023년부터 2025년까지 그 경쟁이 어떻게 진행되었고 그 결과로 무엇이 영구적으로 바뀌었는지를 조사합니다.
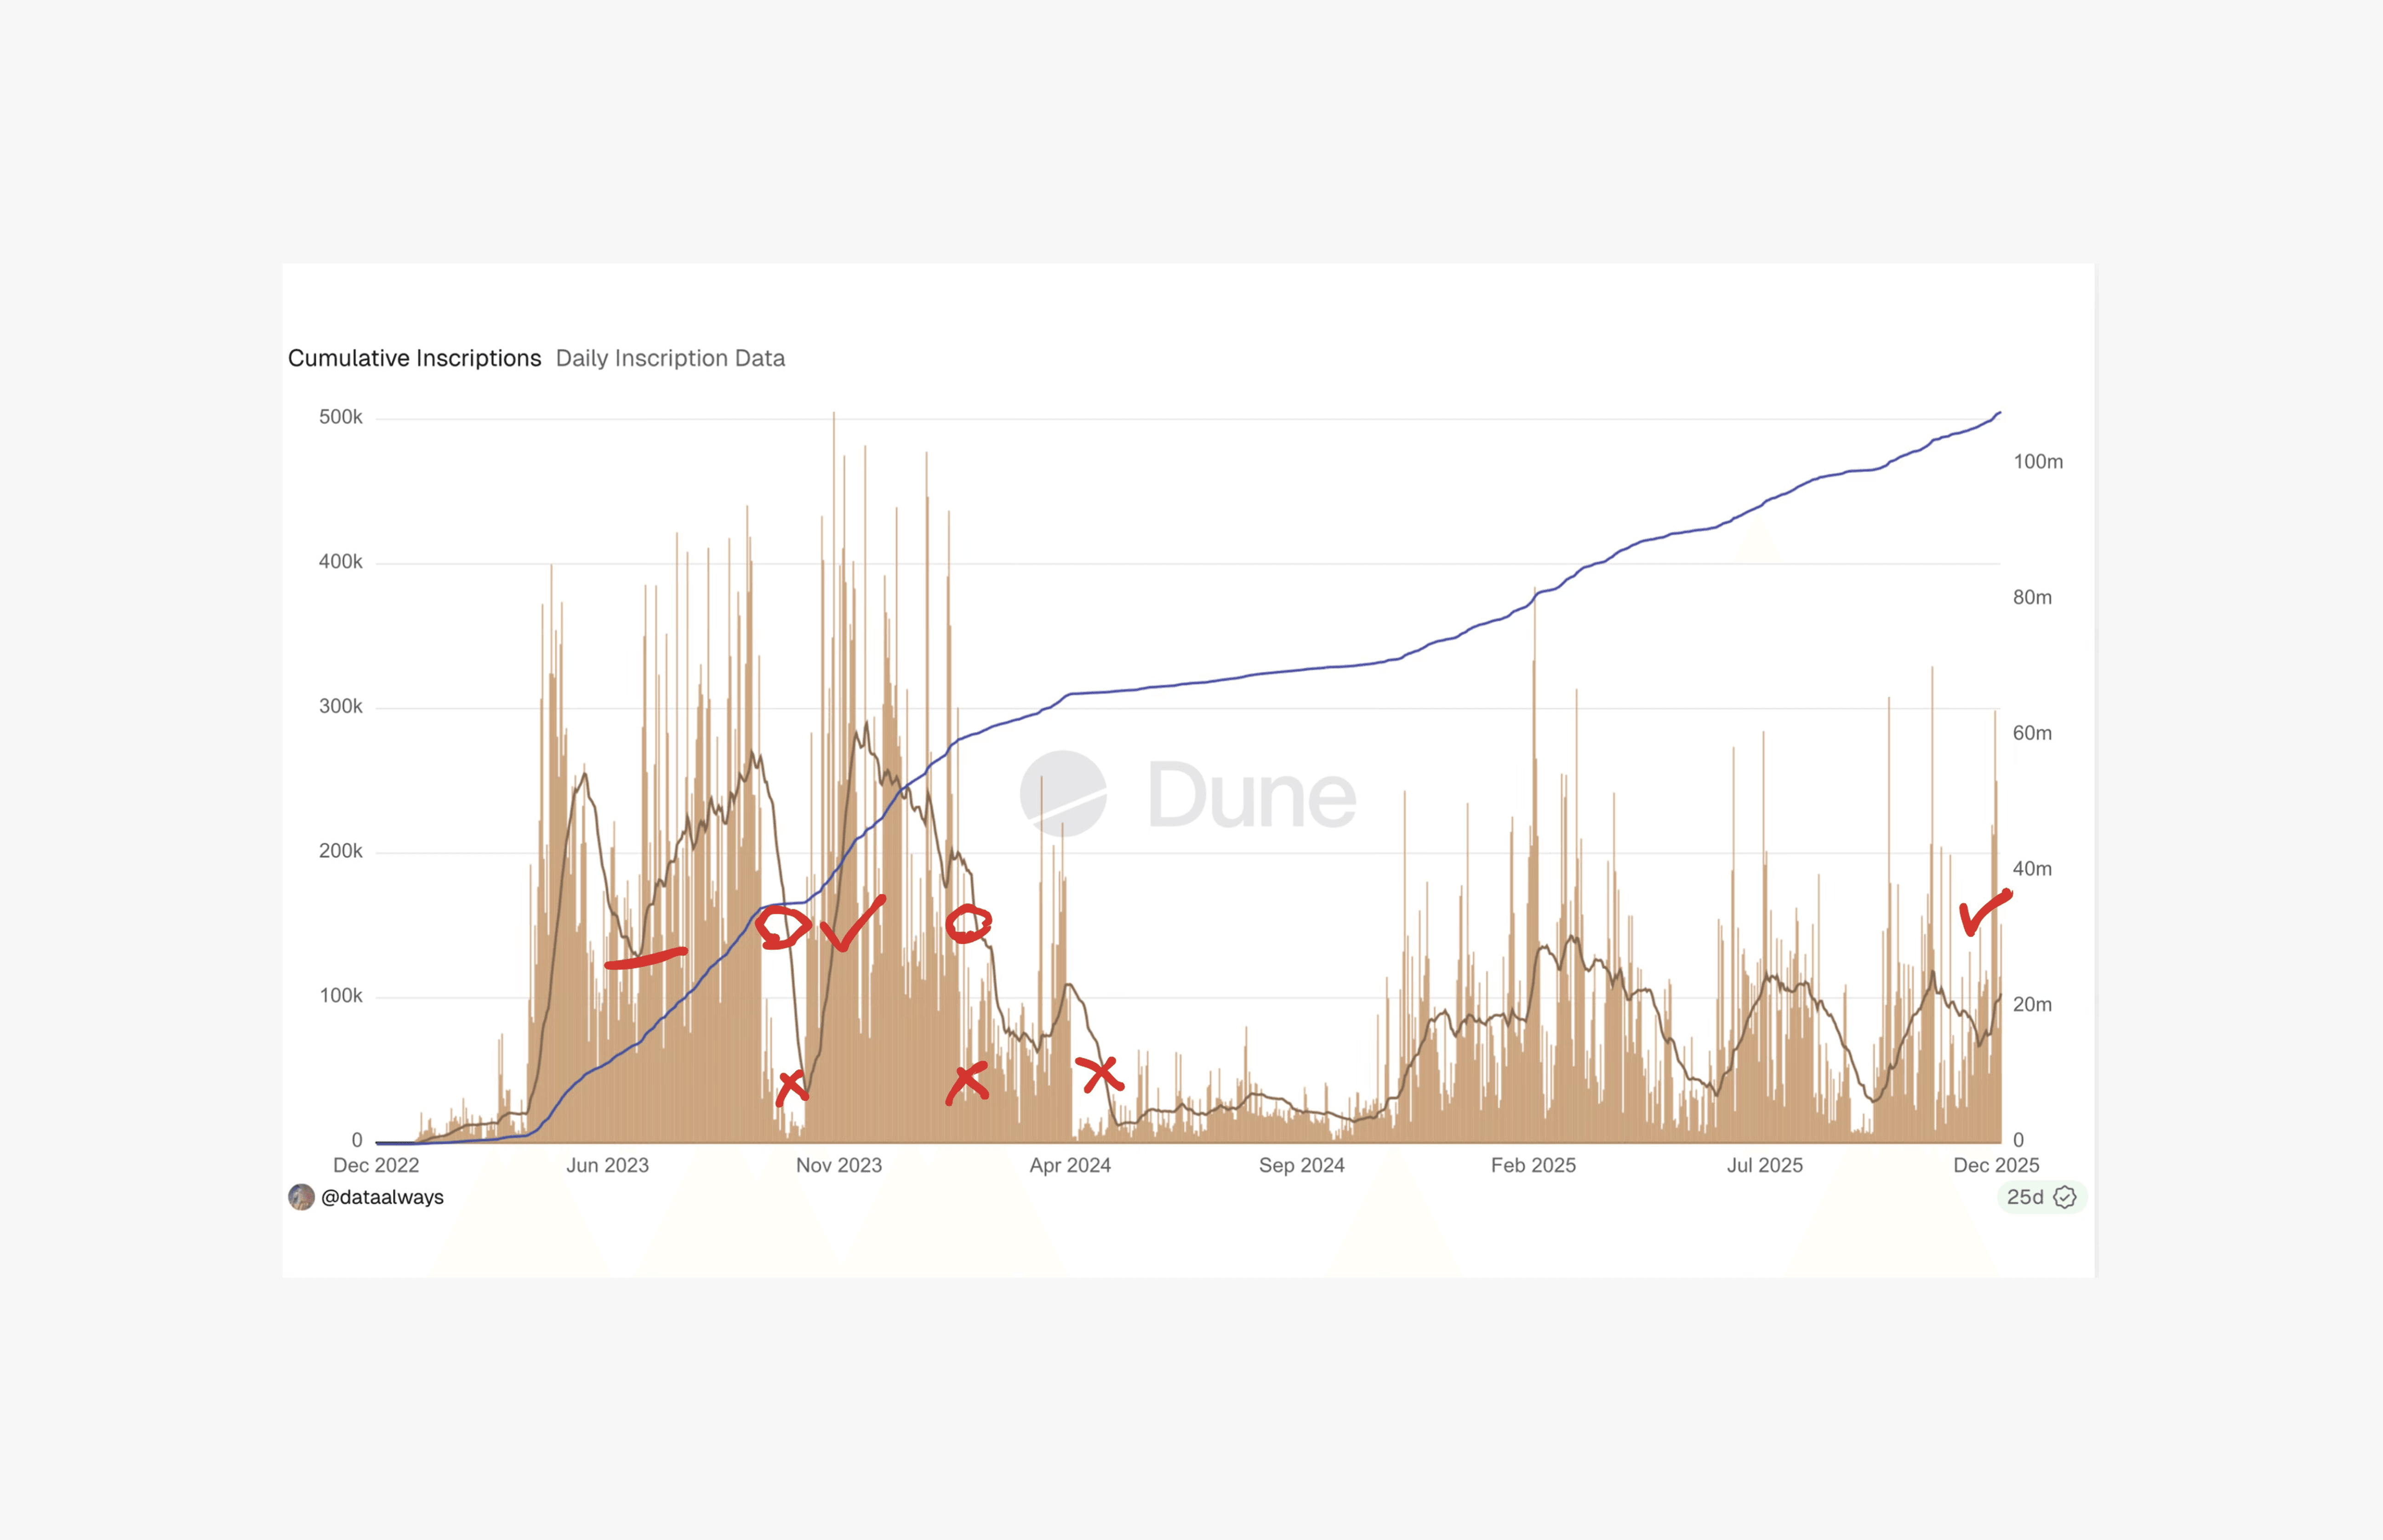
일일 각인 차트 | 출처: 던
비트코인 각인 및 수수료의 연표
2023년 1분기 (첫 90일):
생성된 각인: 총 663,000개가 있었으며, 3월에만 420,000개가 생성됨
지불된 수수료: 총 152 BTC (~매일 1.7 BTC)
패턴: 프로토콜이 주목받음에 따라 초기 폭발
2023년 5월까지 (0-4개월):
총 각인: 880만 개, 1분기 대비 1,300% 증가
일일 볼륨: 1분기의 전체 월과 일치하는 단일 일 활동
지불된 수수료: 총 1,480 BTC (~매일 10.3 BTC), 605% 증가
최고 활동 (2023년 후반):
최고 볼륨: 2023년 9월-12월에는 지속적인 최고 활동이 있었음
일일 각인: 자주 하루 400,000개를 초과함
수수료 경쟁: 최대 강도로 사용자들이 블록 공간을 위해 적극적으로 입찰
오늘날 (2026년 1월):
총 각인: 블록체인에 영구적으로 104,892,336개
지불된 총 수수료: 채굴자에게 7,092 BTC
현재 활동: 상당히 감소했지만 낮은 수준에서 지속됨
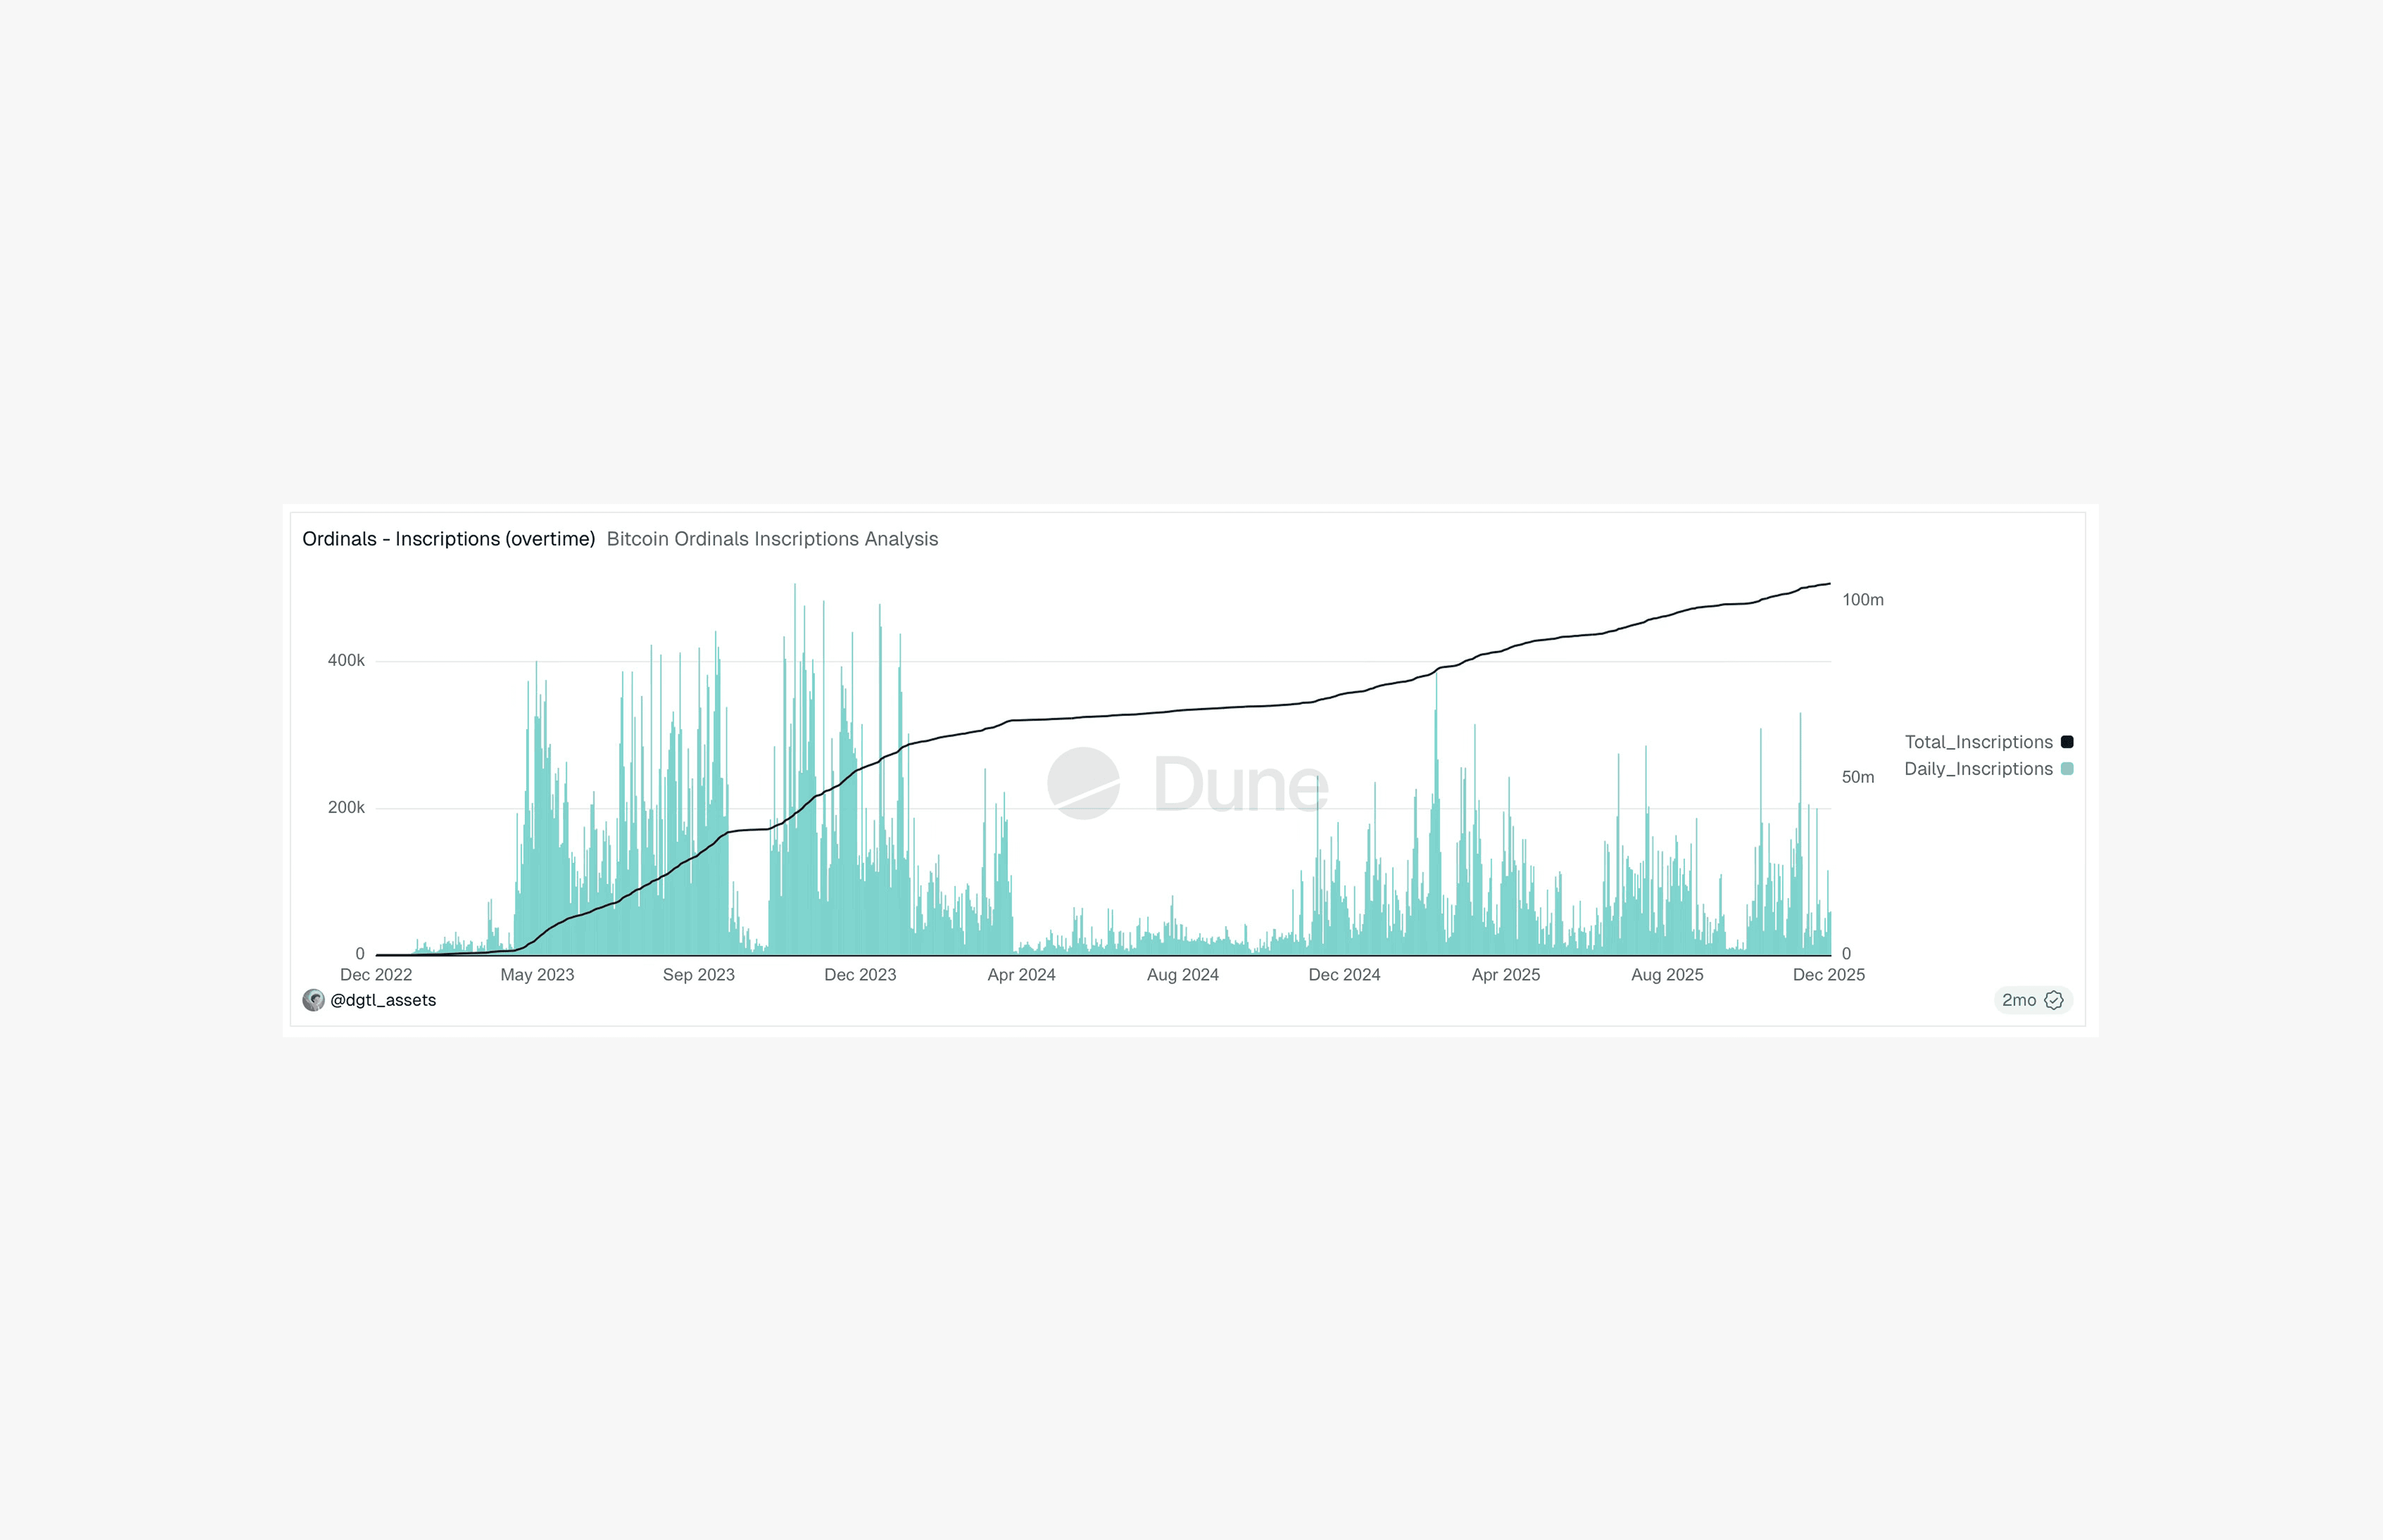
일일 및 누적 각인 차트 | 출처: 던
비트코인 오디널은 2023년 초에 폭발적으로 증가하여 그 해 후반에 최고 강도로 달했으며 2024-2025년 동안 지속적인 감소가 있었습니다.
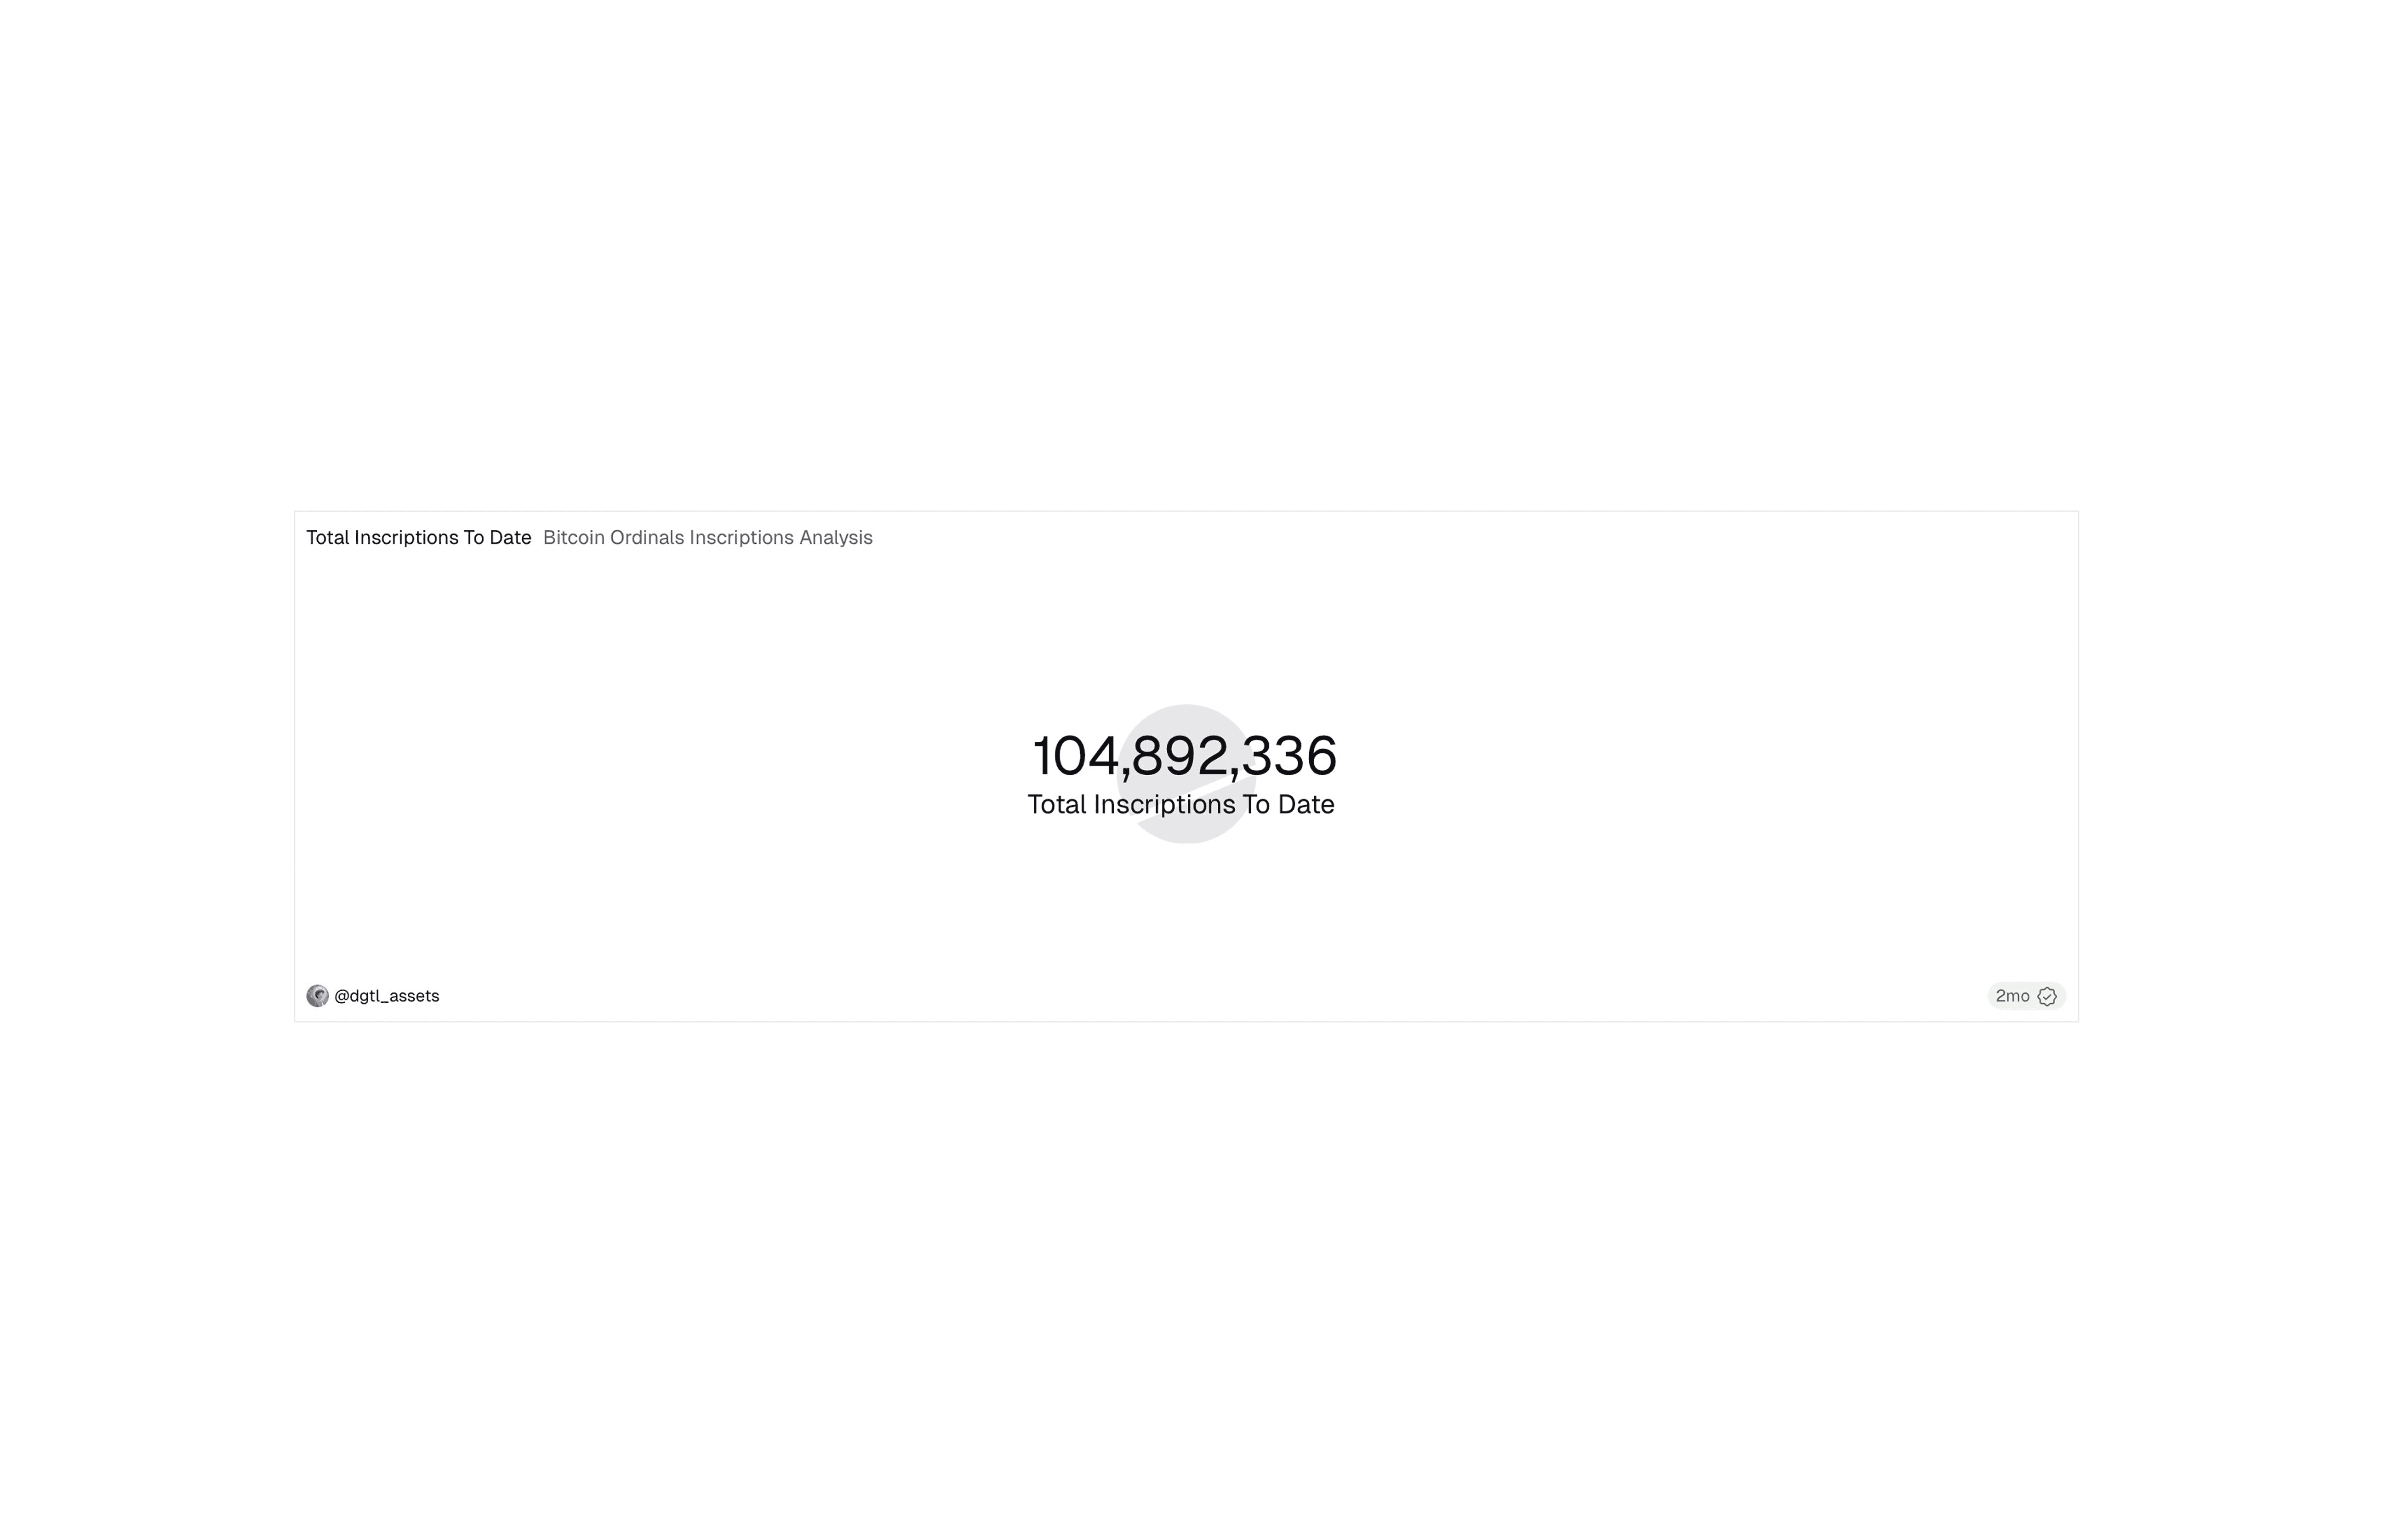
차트 총 각인 날짜까지 | 출처: 던
2023년의 집중된 붐은 비트코인 이해관계자들에게 다르게 영향을 미쳤습니다:
채굴자: 특정 기간 동안 상당한 수수료 수익을 얻었으며, 대부분의 수입은 블록 공간 경쟁이 절정에 달한 2023년 후반에 집중됨 (총 7,092 BTC)
일반 사용자: 2023년 붐 동안 예측할 수 없는 수수료 급등을 경험했습니다. 일반적으로 $2의 수수료로 비트코인을 온체인에 보내는 기간이 각인 러쉬 동안 $15+의 수수료가 필요할 수 있어 기본 레이어 거래가 더 비쌌음
노드 운영자: 12개월 동안 80-100GB의 영구 저장 추가를 감수해야 했습니다
각인 생성자: 경쟁이 비용을 높이기 시작하기 전 비교적 저렴한 수수료로 초기 2023년에 간신히 기회를 가졌습니다
비트코인 개발자: 각인 볼륨이 폭발하자 빠르게 커뮤니티 분열에 직면했습니다
장기 보유자: 비트코인의 목적에 대한 논쟁이 몇 달 동안 강해지면서 네트워크 방향에 대한 의문을 2026년까지 제기했습니다
롤업 및 레이어 2 프로젝트: 각인 붐은 불량한 데이터 저장 방법의 문제를 드러내었으며, 비트코인의 UTXO 집합을 영구적으로 팽창시키는 가짜 주소가 체인에 증명을 게시하기 위해 더 나은 인프라를 필요로 한다는 것을 강조함.
수수료가 시장을 어떻게 형성했나
매 10분마다, 채굴자는 대략 4MB의 용량을 가진 블록을 만들어 2017년 세그윗 업그레이드로 가능하게 합니다.
블록 공간 수요가 공급을 초과하면, 사용자는 거래를 다음 블록에 포함시키기 위해 더 높은 수수료를 입찰합니다. 비트코인의 수수료 시장은 제한된 공간이 블록체인을 사용하려는 모든 사람들 사이에 경쟁을 창출한다는 원리에 따라 작동합니다. 이들은 결제를 보내거나 데이터를 삽입하든 상관없습니다.
각인은 이 역학을 변경했습니다, 각인은 일반 거래보다 훨씬 더 많은 공간을 차지하므로:
각인 공간 비교:
일반 결제 거래: ~250바이트
간단한 텍스트 각인: 1,000-5,000 바이트
작은 이미지 각인: 50,000-200,000 바이트
큰 이미지 각인: 400,000+ 바이트
이것은 일반 결제보다 200에서 1,600배 더 많은 데이터를 의미합니다.
수수료율 이야기
비트코인의 수수료는 버추얼 바이트당 사토시(단위 당 비트코인, 예를 들어 sat/vByte)로 측정됩니다. 이는 개인이 블록에 포함하려는 데이터 단위에 지불할 의향이 있는 금액을 본질적으로 나타냅니다. "가상 바이트"는 2017년 세그윗 업그레이드 후 거래 크기를 측정하는 비트코인의 방법으로, 고아 데이터(각인이 파일을 저장하는 곳)에 할인 혜택을 주어 각 블록에 더 많이 포함될 수 있게 합니다.
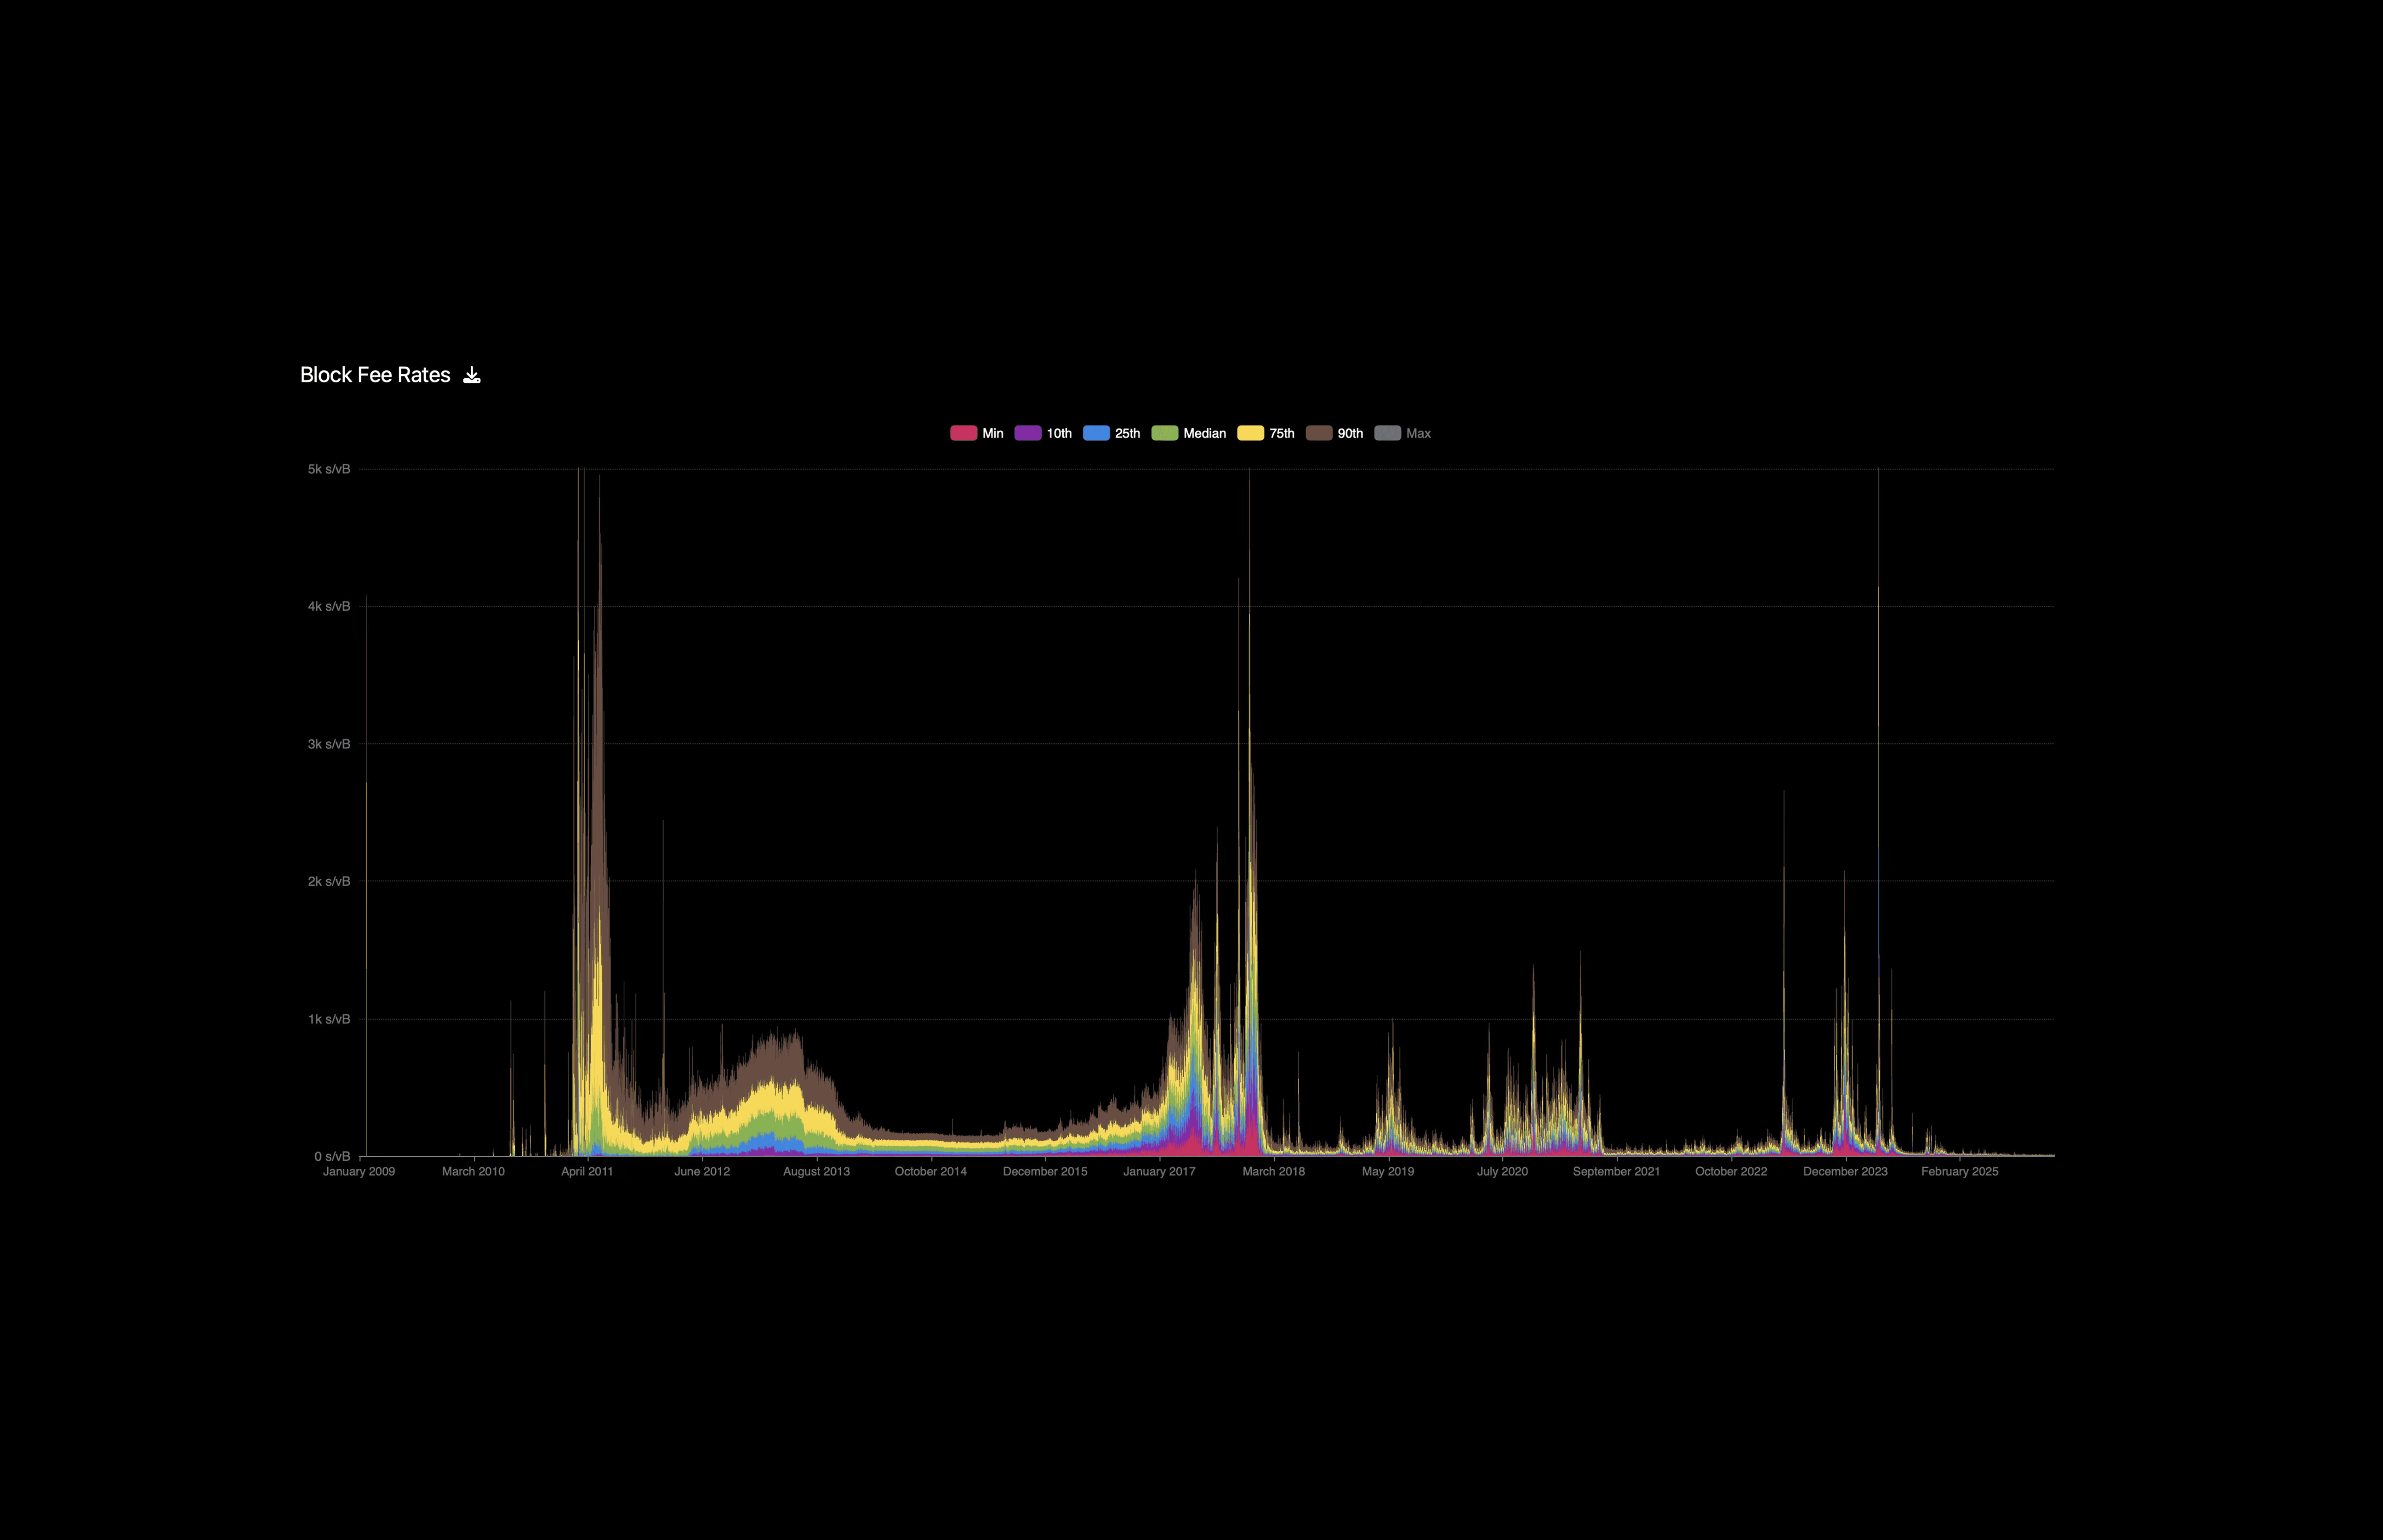
블록 수수료율 | 출처: 메모리풀
각인 활동이 증가하자, 생성자는 블록 공간을 확보하기 위해 상당한 수수료를 지불해야 하는 대형 파일(이미지, 비디오, 복잡한 데이터)을 삽입했습니다. 각인은 세그윗의 디자인 덕분에 고아 데이터(각인이 위치)가 블록 무게 계산에서 75% 할인된 혜택을 받지만, 여전히 일반 결제보다 훨씬 많은 공간을 차지합니다.
이는 비트코인을 사용하는 나머지 사람들, 특히 단순히 결제를 보내려는 사람들조차도 이러한 높은 입찰과 경쟁하도록 강제했습니다. 아래 차트는 이러한 경쟁을 실시간으로 보여주면서 2022년 말부터 2025년까지의 수수료율을 추적합니다:
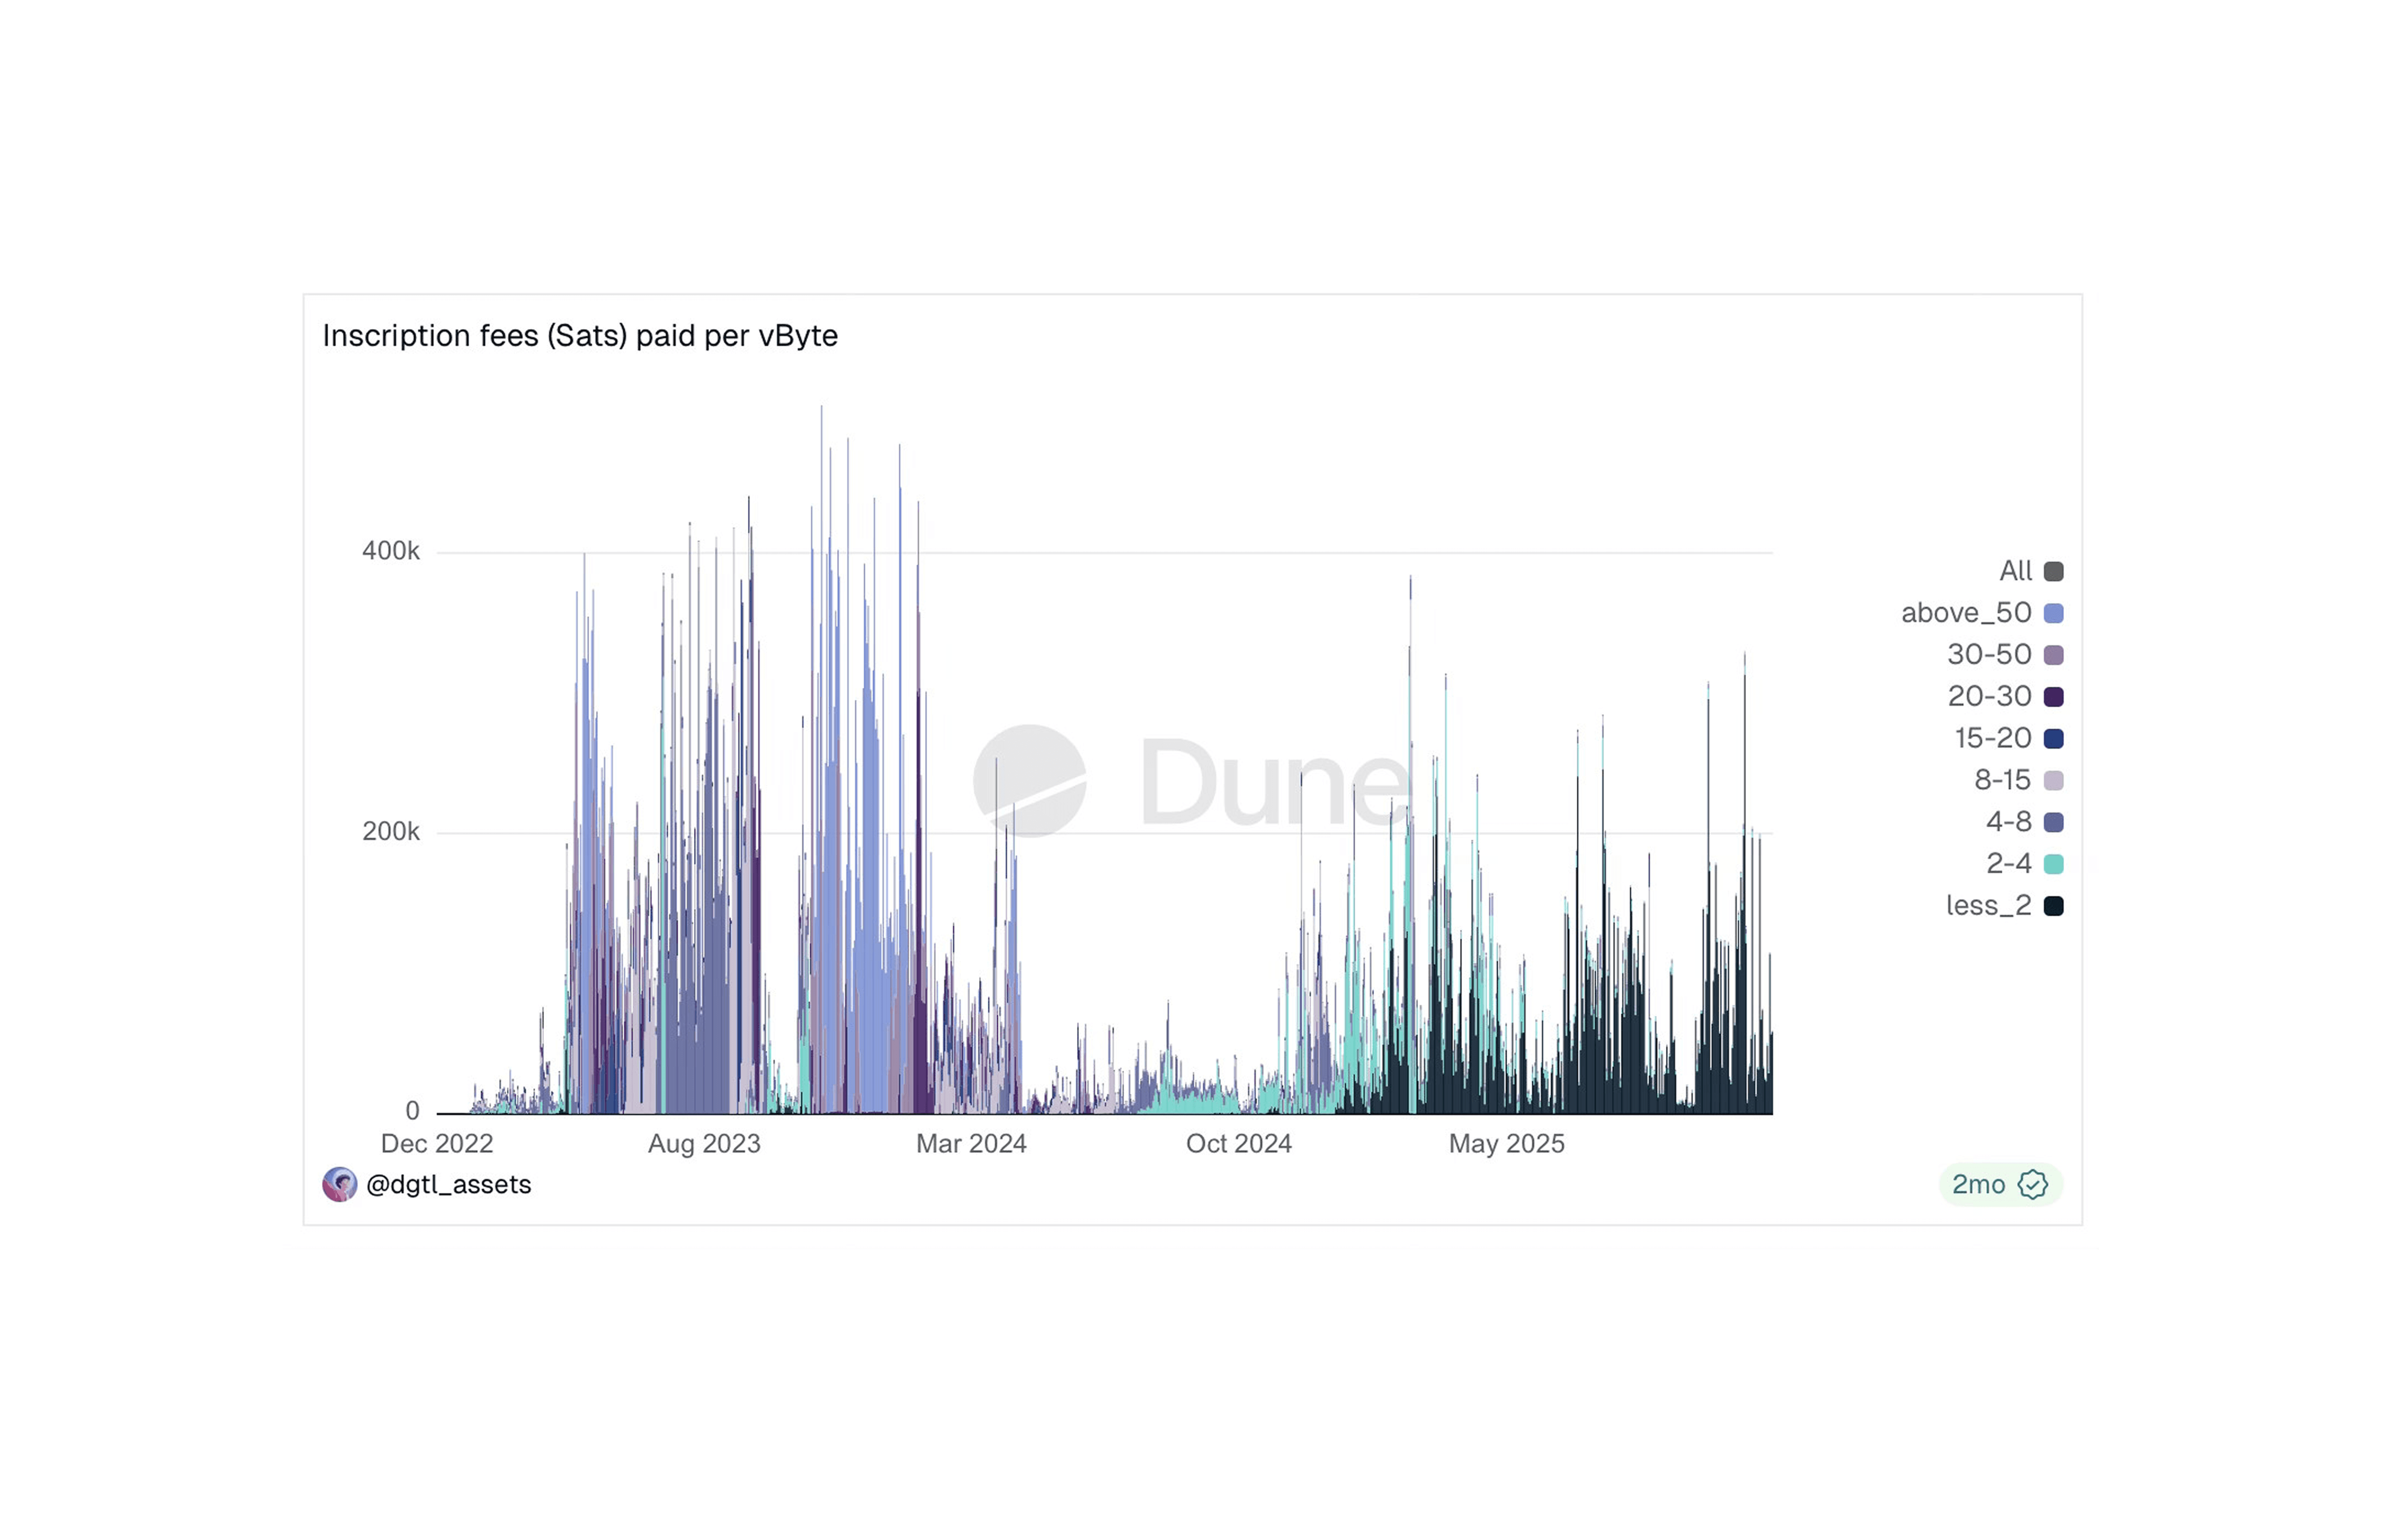
버추얼 바이트당 수수료율 차트
이 차트는 각인 수요가 모든 사람의 수수료를 높이는 방식으로 수수료를 올리고 있음을 보여줍니다. 색상 밴드는 별도의 수수료율 측면 (버추얼 바이트당 사토시로 측정됩니다)을 표시합니다:
위의 두 차트에서 형성된 주요 패턴:
최고 활동 (2023년 초-2024년 초): 수수료율은 종종 50 sat/vByte를 초과하고, 강한 경쟁 동안 일부 각인은 400+ sat/vByte를 지불
감소 (2024-2025): 각인 활동이 감소함에 따라 수수료율은 더 낮고 예측 가능한 수준으로 안정화됨
블록체인 성장 이해하기: 감소하는 비율 역설
비트코인의 블록체인은 절대적인 면에서 계속 성장하고 있으며 (오렌지선이 0GB에서 712GB까지 상승) 비율은 비트코인의 초기 몇 년 동안 100% 이상에서 오늘날 약 11.4%까지 감소하고 있습니다.
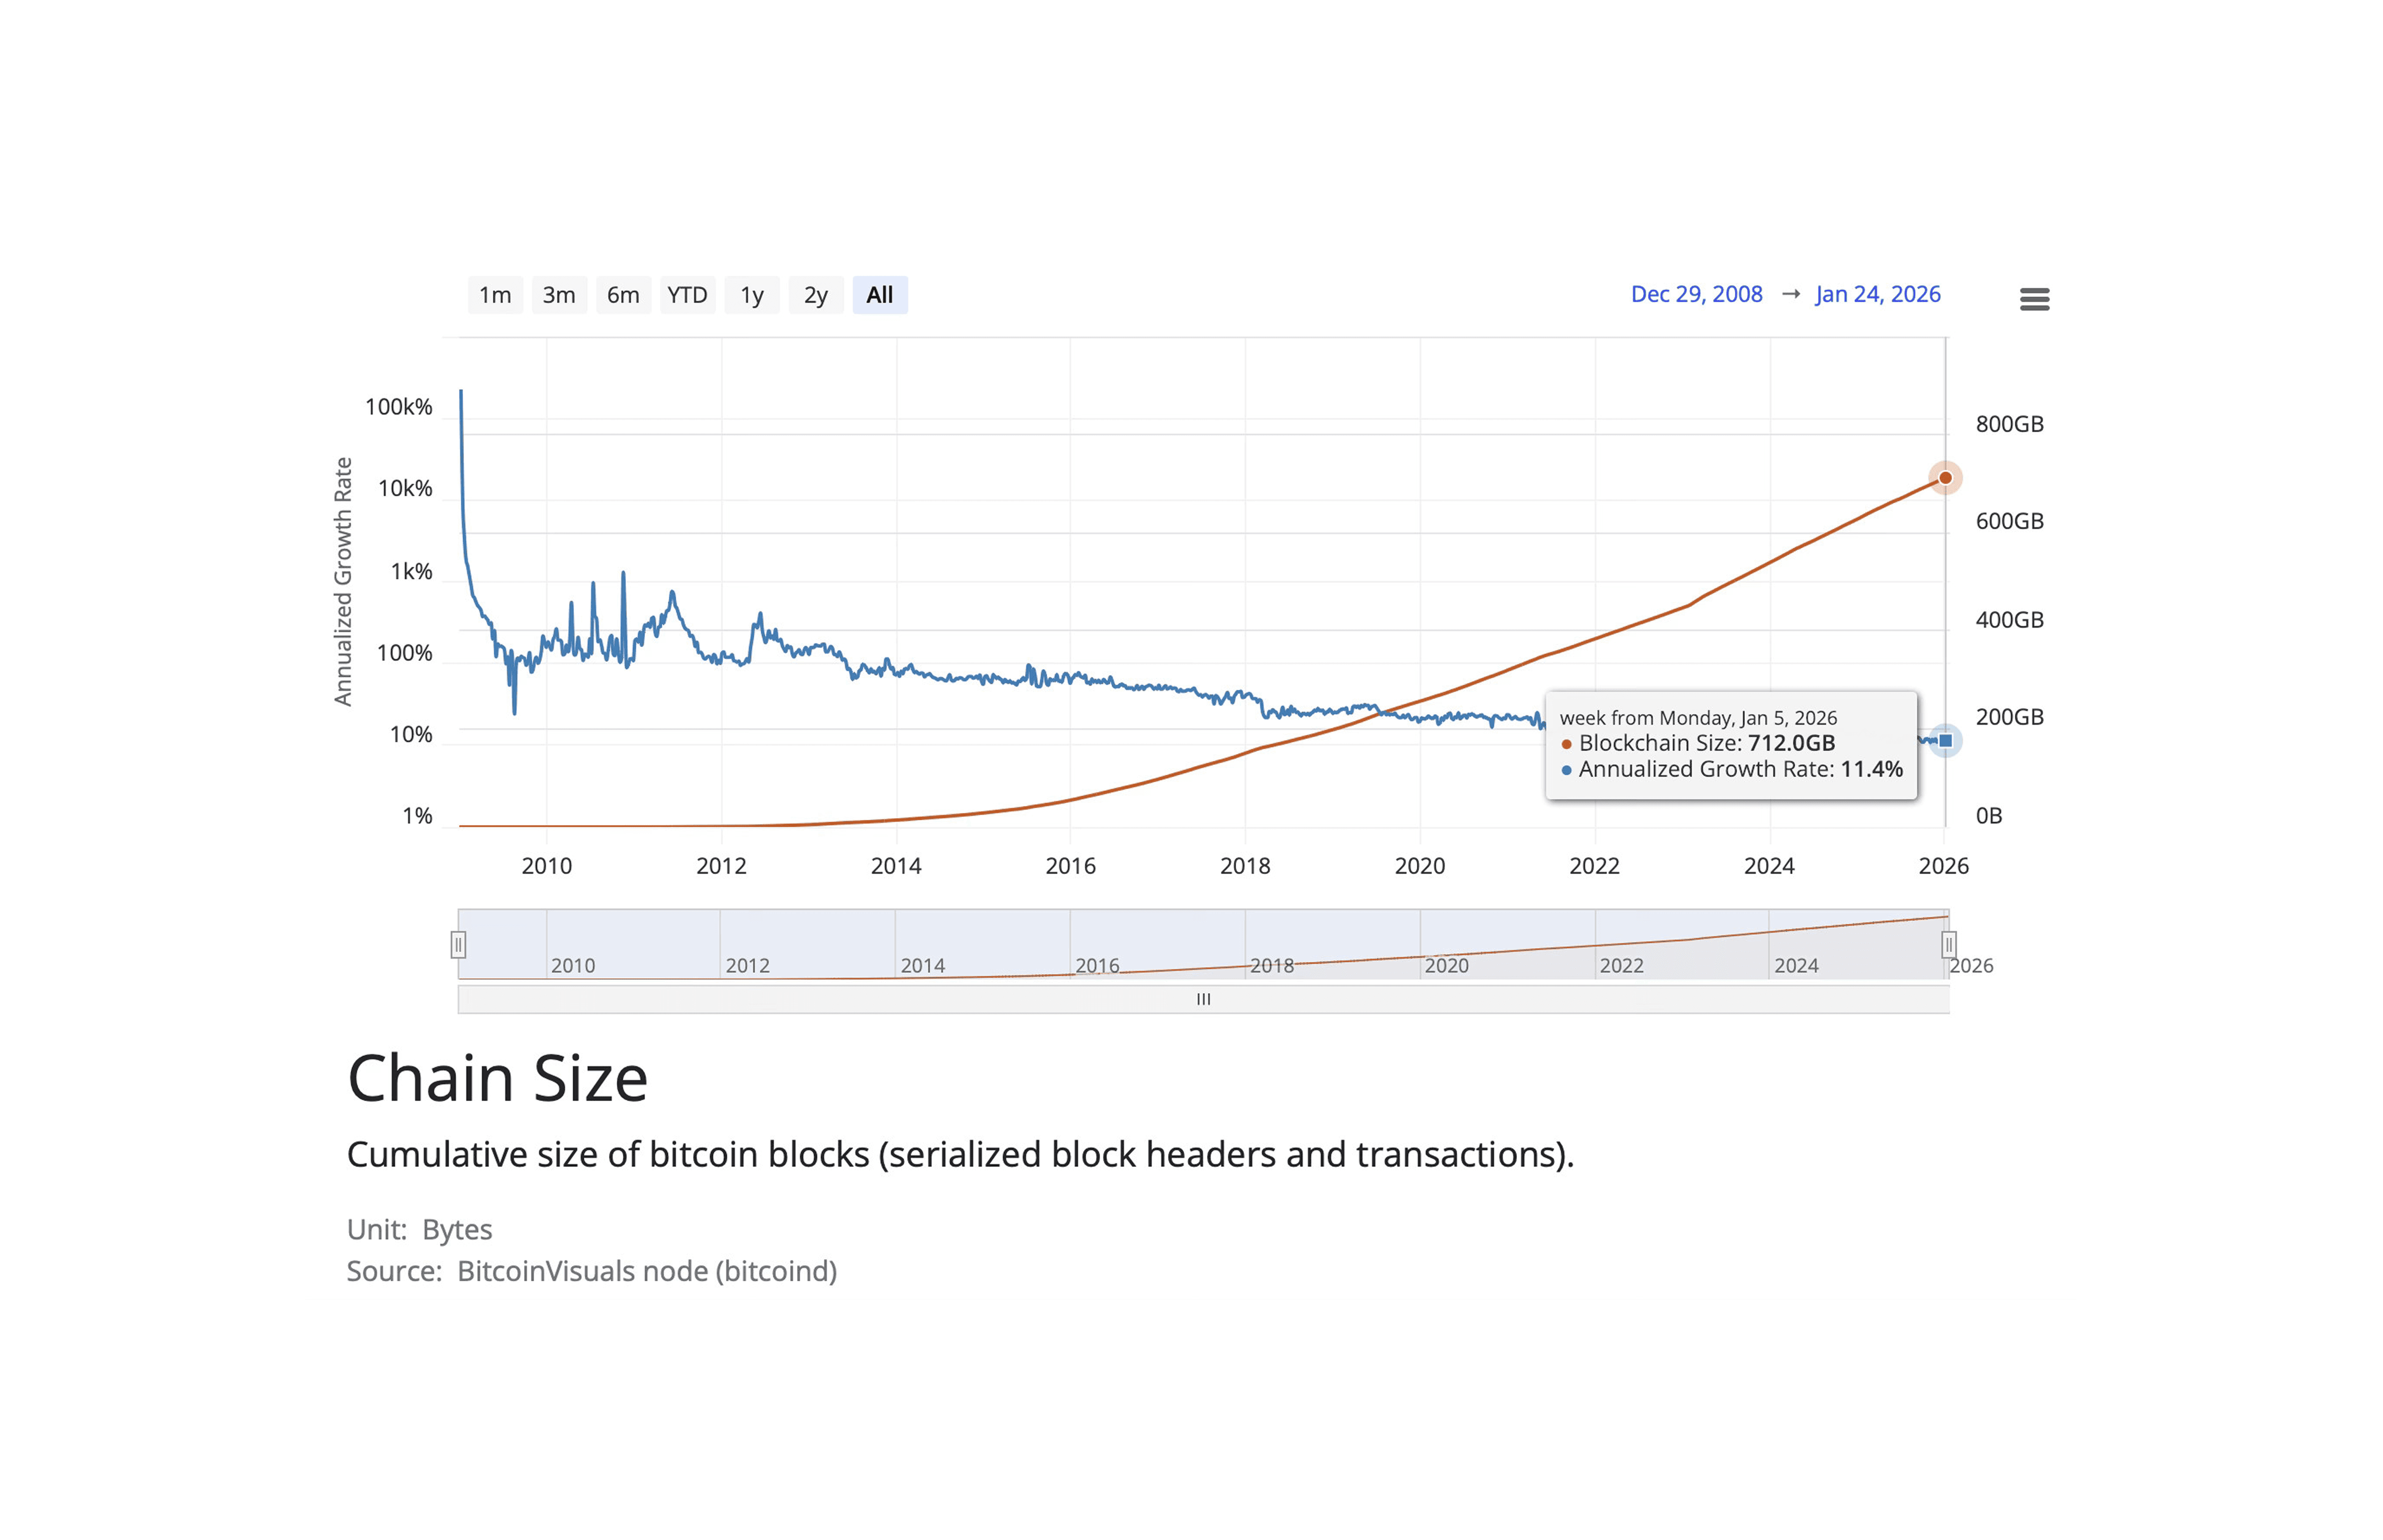
연간화 성장률이 11.4%를 반영하여 지속적이지만 적어지는 확장을 보여주는 체인 크기 | 출처: 비트코인비주얼
비트코인 블록체인 성장: 절대 대 비율
연도 | 총 블록체인 크기 | 일일 추가 | 연간 성장 (GB) | 연간 성장률 (%) |
2015 | 50 GB | ~200 MB | ~73 GB | 146% |
2023 | 500 GB | ~300 MB | ~110 GB | 22% |
2026 | 712 GB | ~200 MB | ~80 GB | 11.4% |
주된 통찰력:
각인은 2023-2024년에 절대적 데이터 추가량을 일시적으로 증가시켰지만, 전체 블록체인 크기의 비율로서 성장률은 2012년 이후 자연적인 감소를 지속하고 있습니다. 이는 분모(총 블록체인 크기)가 지속적으로 커지면서 일일 추가량이 블록 크기 제한에 의해 제한되기 때문입니다.
노드 운영자에게 이것이 의미하는 바:
단기적인 측면: 각인은 절대적인 성장 가속화 (해마다 추가되는 GB 증가)
장기적인 추세: 총 크기의 비율로서의 연간 성장은 감소할 것이며, 절대적인 GB 추가는 상당하게 계속될 것임
저장 계획: 블록체인 크기는 시간이 지남에 따라 더 자주 두 배로 증가하지 않음 (11%에서 ~6-7년마다 두 배로 증가 vs. 50%+에서 매년 또는 2년마다)
각인처럼 지속적인 활동이 발생한다면 (단지 2023-2024의 붐이 아닌 경우), 자연적인 감소하는 추세보다 높은 성장을 유지할 수 있어, 노드 운영자는 역사적 패턴보다 더 높은 절대 저장 추가를 계획해야 할 수 있습니다.
2011-2012년 이후, 절대적인 GB 요구는 매년 증가하는 반면, 노드 운영자가 저장을 확장해야 하는 속도가 점점 느려졌습니다. 연간 두 배로 증가하는 대신 6-7년마다 두 배로 증가하는 속도로 변화했습니다.
수수료 수익의 그림
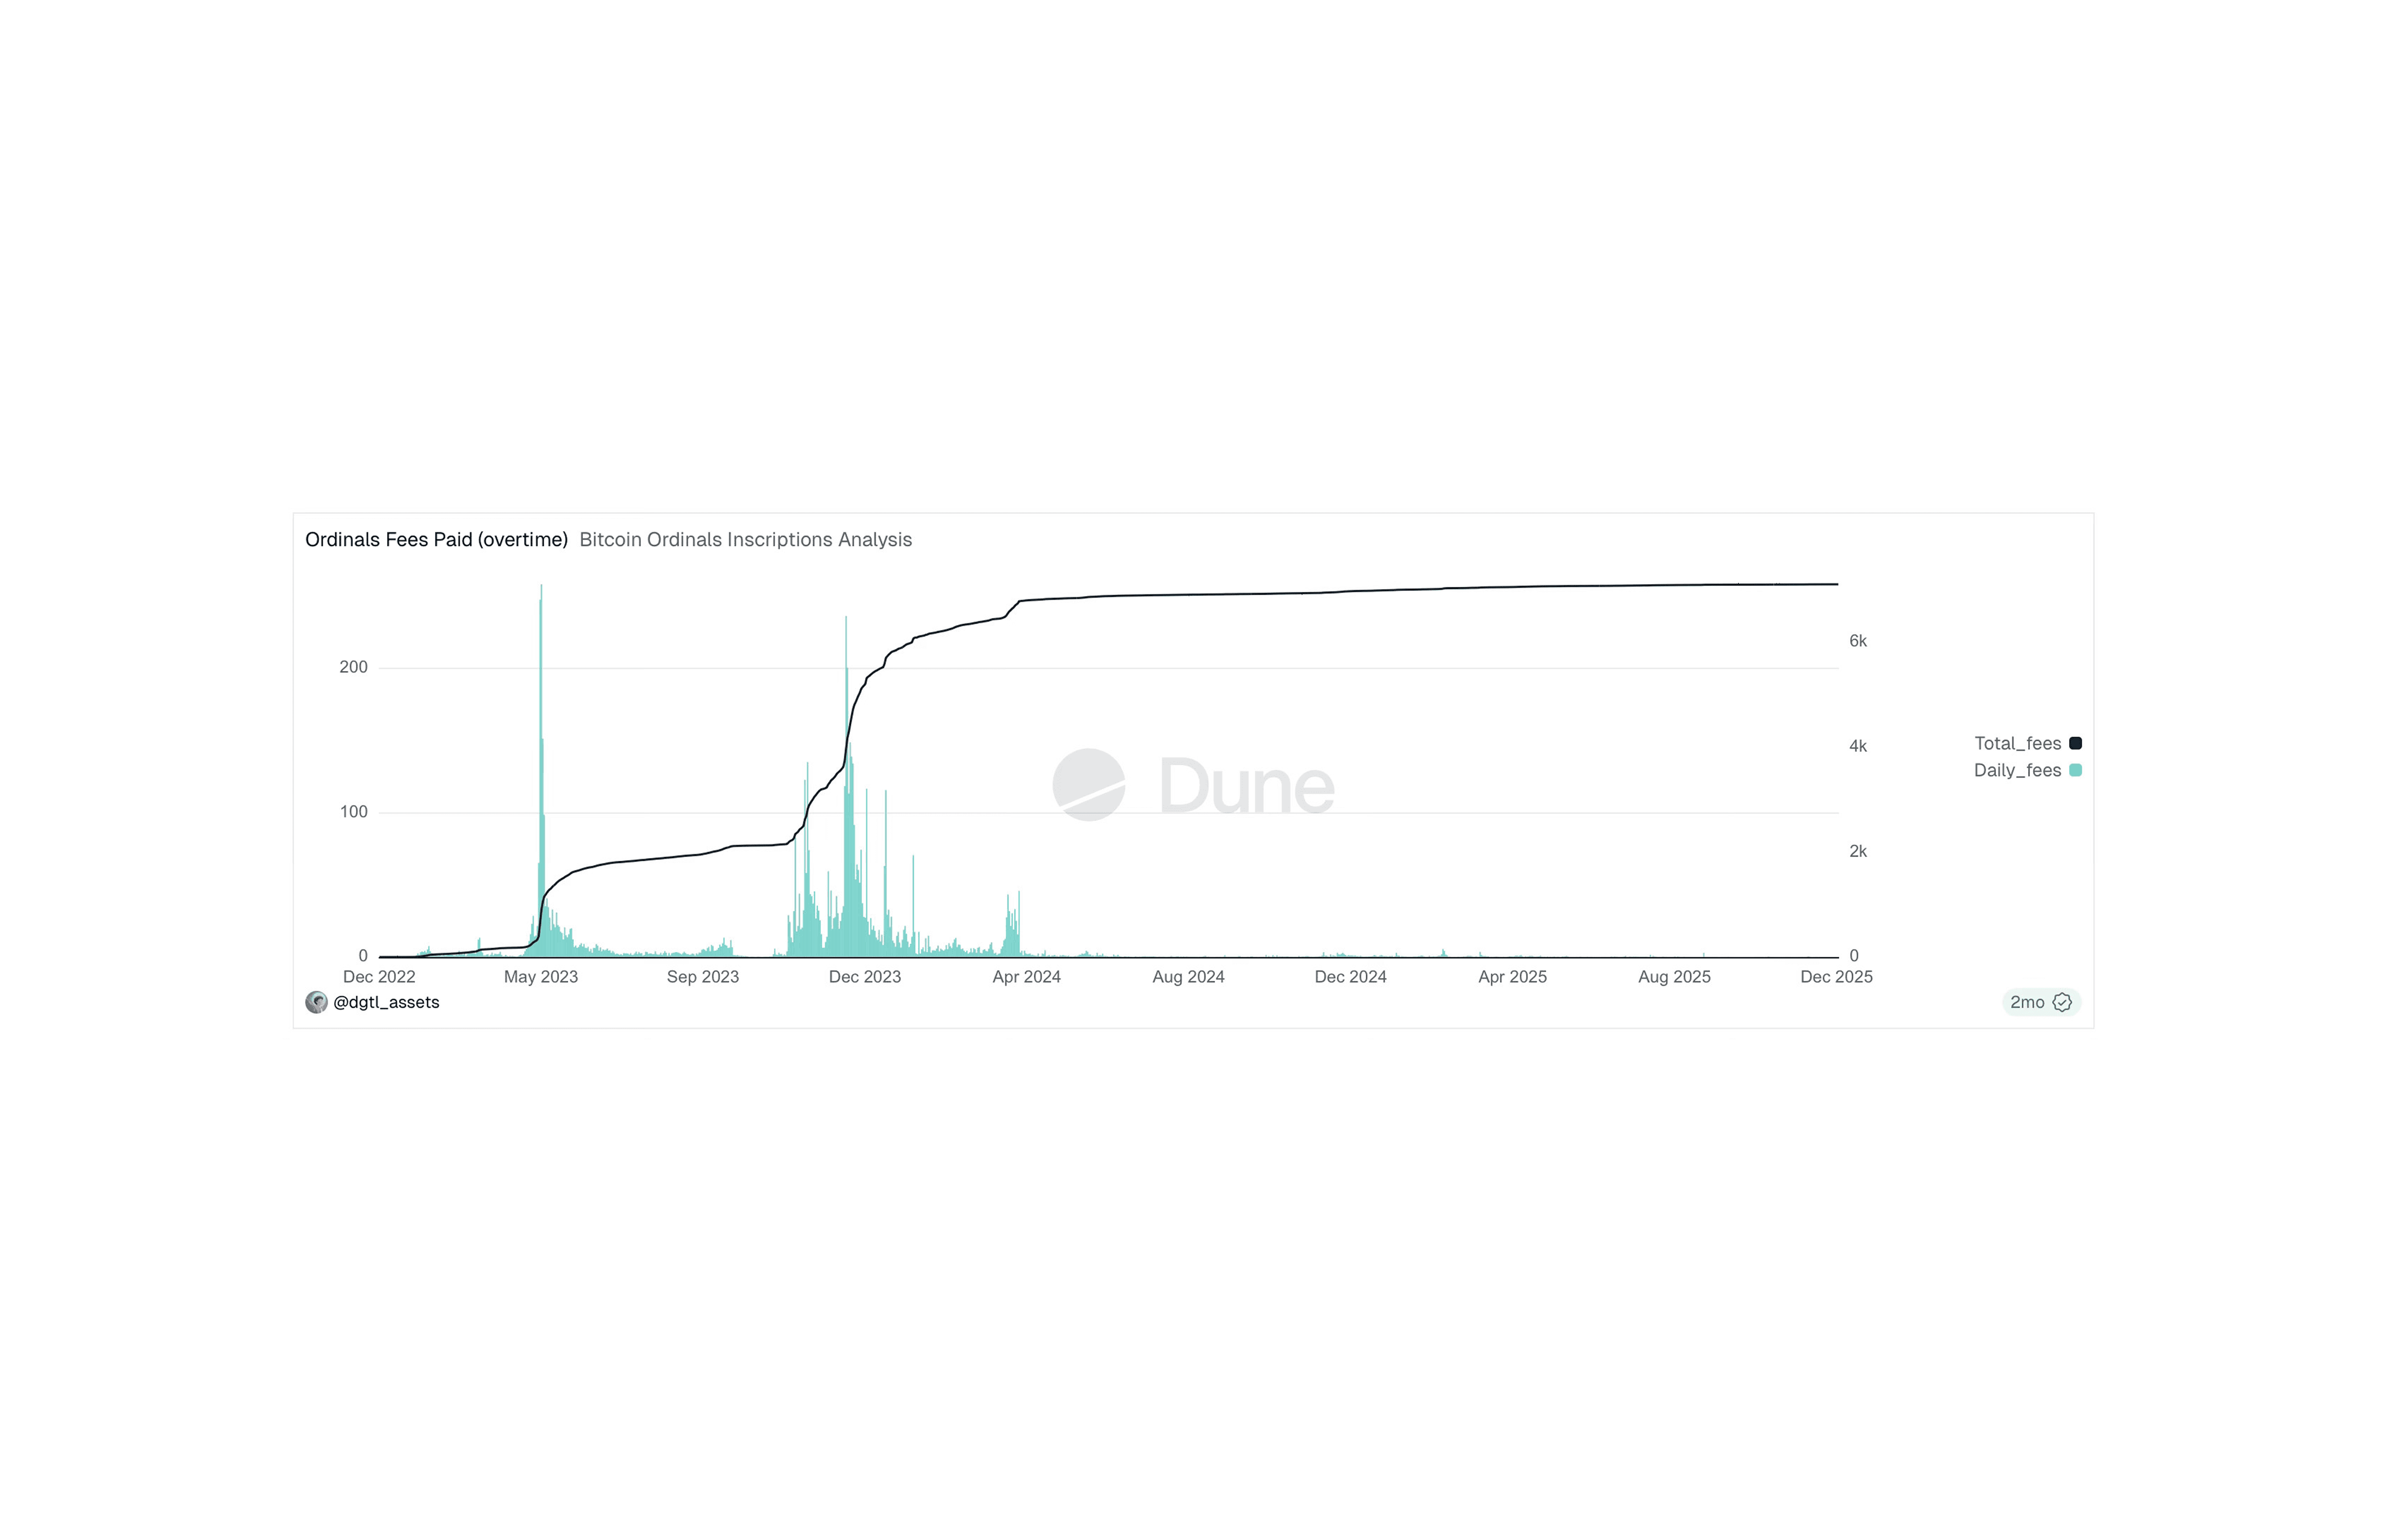
오디널 수수료 지불 시간 포함
이 차트는 각인 경제에 대한 두 가지 통찰력을 보여줍니다:
일일 수수료: 2023-2024년 활동 패턴의 급격한 상승을 반영하며, 2025년까지 감소함. 수천 달러 상당의 BTC가 한때 일일 각인 수수료로 기록되었지만 이제는 거의 의미 없는 수준으로 기록됨.
누적 수수료: 총 비용이 꾸준히 상승하여 7,092 BTC에 도달함. 이는 이 기간 동안 채굴자에게 수백만 달러의 지불을 의미합니다.
각인이 노드를 멀어지게 했나?
각인에서 증가한 저장 및 대역폭 비용이 사람들을 노드 운영에서 벗어나게 해 비트코인의 탈중앙화를 감소시킬 우려가 있었습니다. 데이터는 흥미로운 이야기를 들려줍니다:
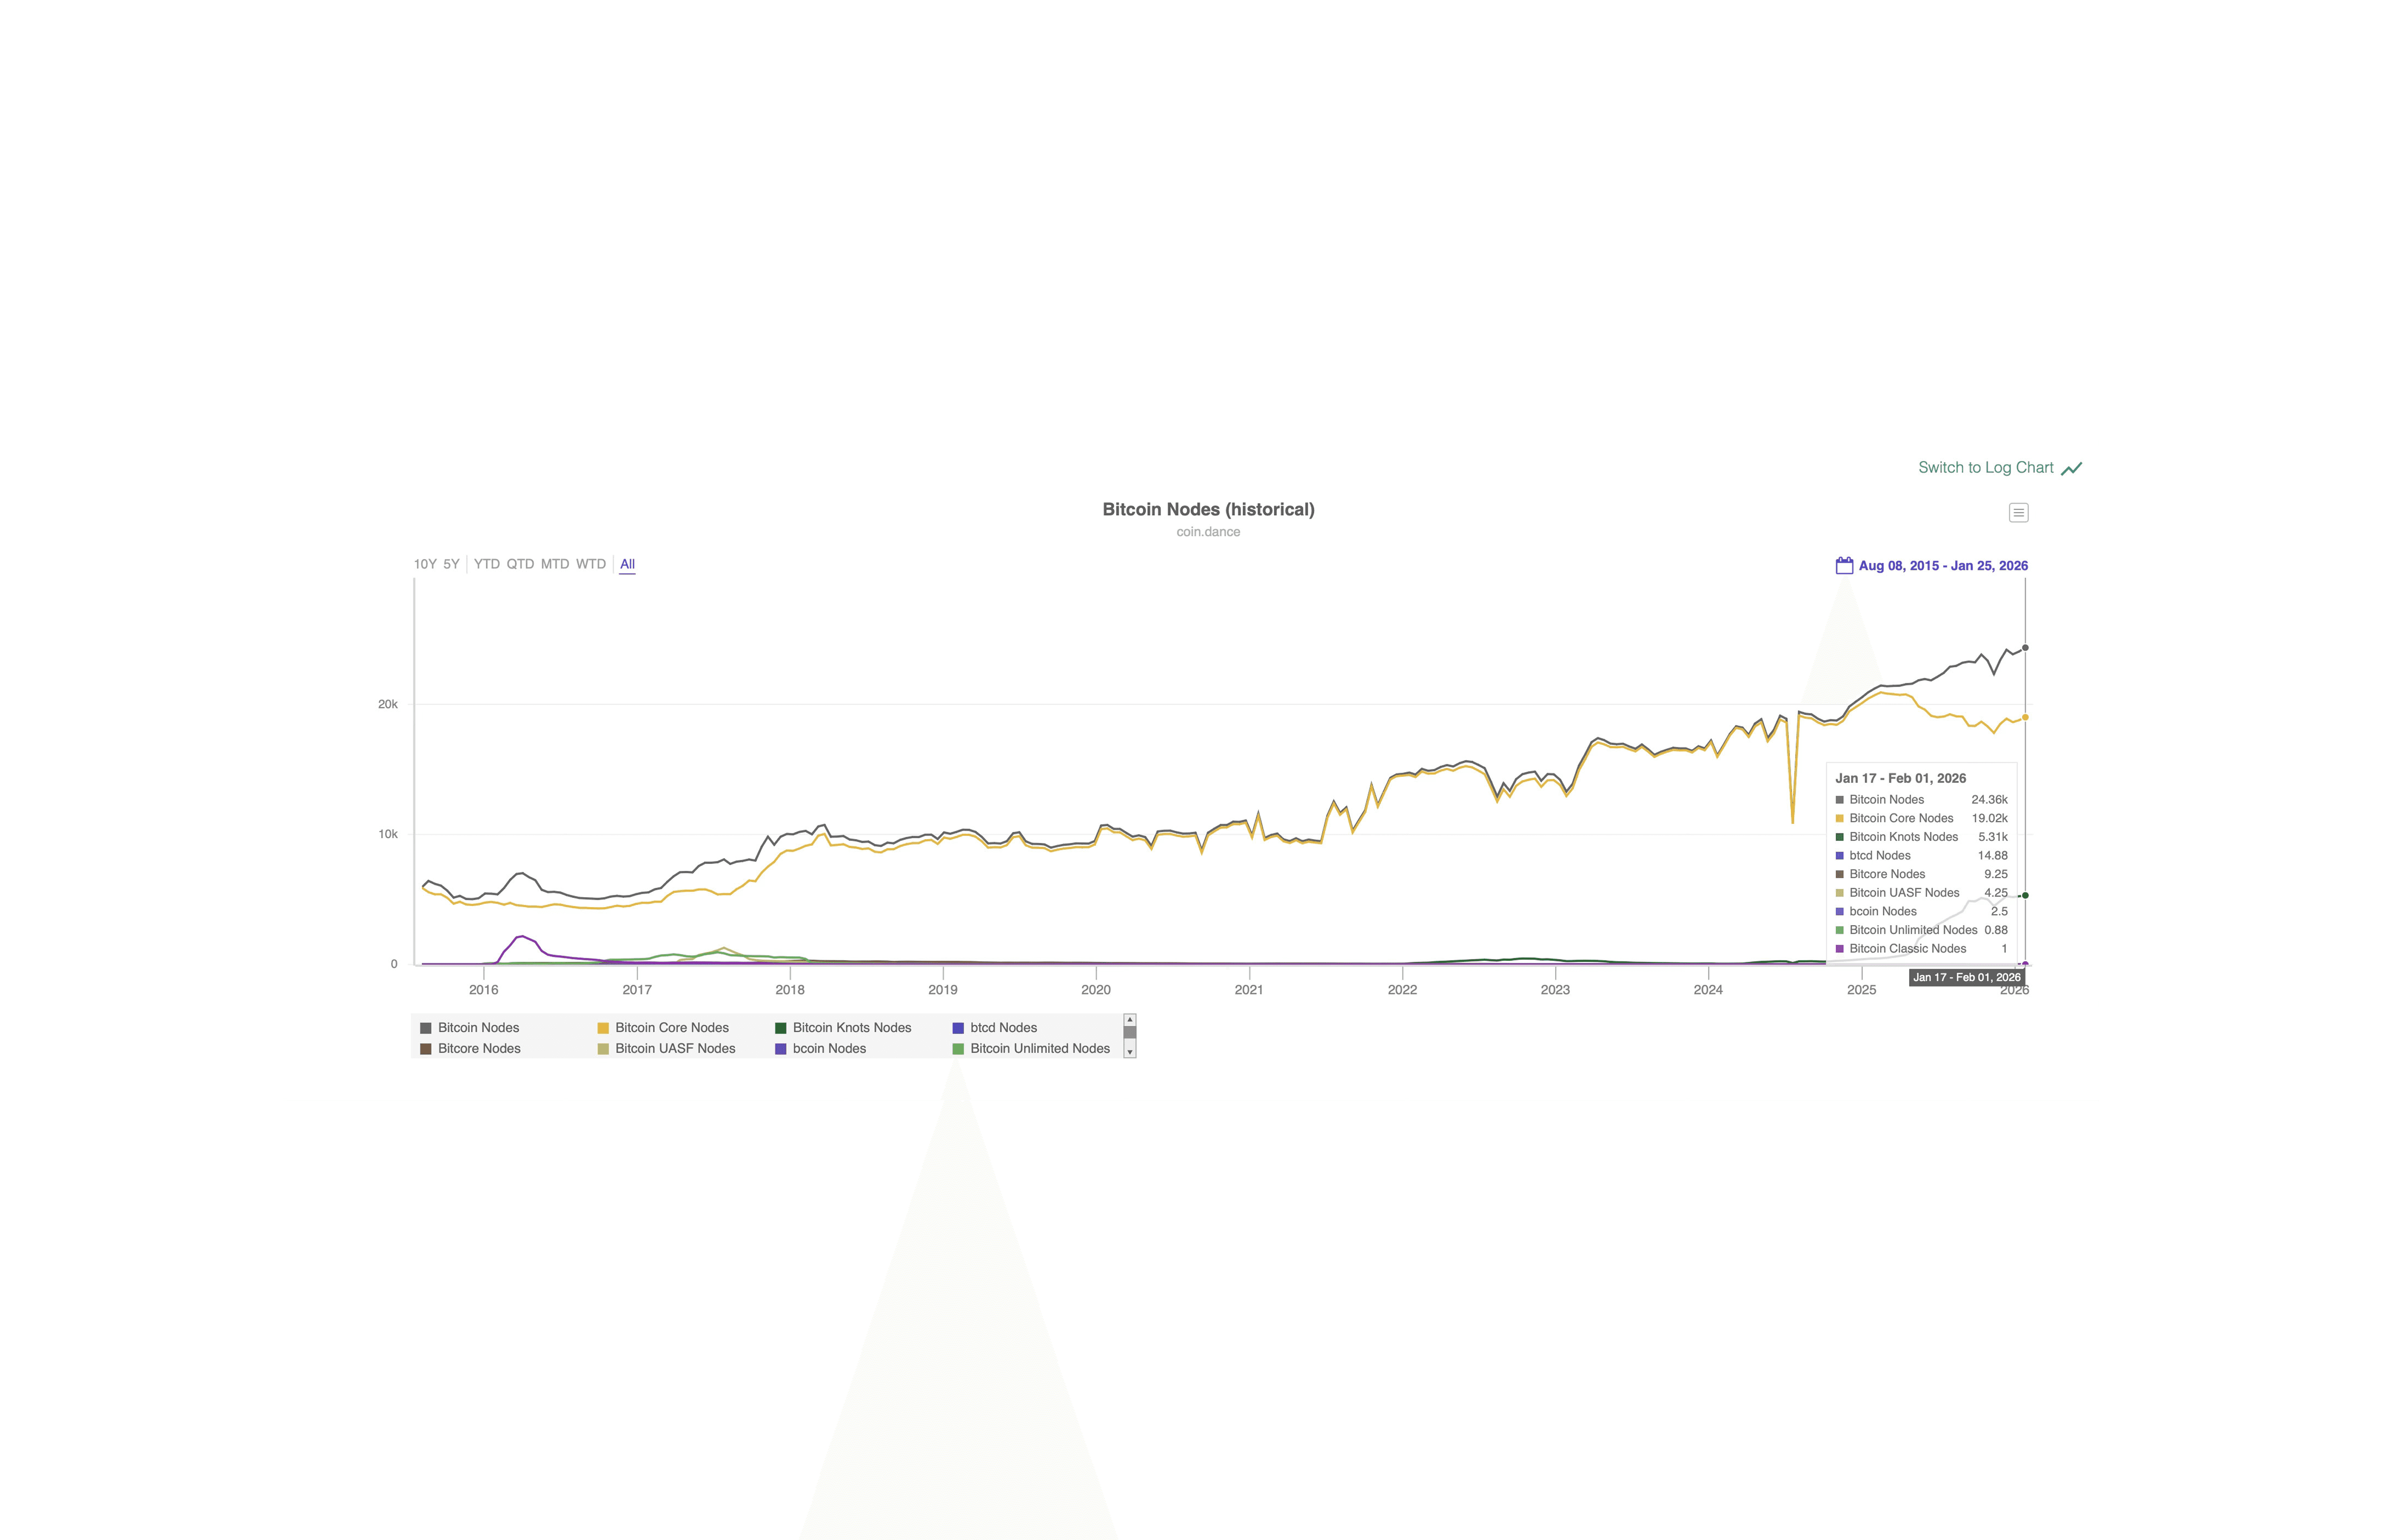
비트코인 노드 역사적 차트 - 코인.댄스
위 차트에서 비트코인 노드 수는 각인 붐 동안 상대적으로 안정적으로 유지되었습니다. 2023년 1월 각인 출발부터 2026년까지, 총 접근 가능 노드는 대략 15,000-24,000 사이에서 변동하며, 역사적인 패턴과 일치하고 극적인 이탈을 보여주지 않습니다.
주목할 점:
각인 전 기본선 (2016-2022): 노드 수는 6,000-15,000 사이에서 꾸준히 증가
각인 붐 동안 (2023-2024): 노드는 18,000-20,000 사이로 성장하며, 상당한 감소를 보이지 않음
붐 이후 (2025-2026): 노드 수는 19,000-24,000 사이로 안정적으로 유지됨
각인의 이점과 위험
각인 기능의 이점:
채굴자 수익 다양화: 각인은 의미 있는 수수료 수익 (7,092 BTC)을 창출하여 블록 보조금이 감소하는 동안 채굴자 수익을 보완합니다.
검열 저항 데이터: 비트코인의 불변성은 이제 임의의 데이터에도 적용되어, 영구적이고 검열 불가능한 온체인 저장을 가능하게 합니다.
확장된 유틸리티: 각인은 비트코인이 비지급용 사례를 지원할 수 있음을 보여주어 새로운 사용자와 활동을 유도합니다.
시장 중심의 규제: 수수료 압력이 시간이 지남에 따라 저가치 각인을 가격으로 인해 자율적으로 규제함을 보여주어 희소한 블록 공간을 통해 자율 규제를 실현합니다.
기능에 대한 위험:
영구 저장 부담: 노드 운영자는 보상 없이 1억여 개의 각인 (80-100GB)을 영구히 저장해야 하며, 하드웨어 및 운영 비용을 증가시킵니다.
네트워크 혼잡: 각인 급증은 수수료 급등을 일으켜, 피크 기간 동안 일상적인 비트코인 결제를 더 비싸고 덜 예측 가능하게 만듭니다.
중앙화 압력: 증가하는 저장, 대역폭, 동기화 요구는 시간이 지남에 따라 소규모 노드 운영자를 가격 밖으로 밀어낼 위험이 있습니다.
철학적 분열: 화폐로서의 역할과 데이터 저장의 역할에 대한 비트코인의 철학적 논쟁은 장기적인 프로토콜 합의를 복잡하게 만듭니다.
각인 붐이 비트코인의 경제에 대해서 드러낸 것
블록 공간은 희소함: 각인은 비트코인의 제한된 블록 공간이 데이터 업로드와 일반 금융 거래 사이에 공유된다는 것을 보여줌.
수수료가 결과를 결정함: 거래 수수료, 프로토콜 규칙 또는 의도가 아닌 것들이 네트워크 사용 방식이 지속되는지를 결정했으며, 수수료가 높아진 후 각인 활동이 감소함.
더높은 인센티브가 행동을 형성함: 비용이 증가함에 따라 지속적인 각인 활동이 감소하여 사용이 관심만으로가 아니라 시장 forces에 의해 관리됨을 보여줌.
사토시는 문맥을 가질 수 있음: 오디널은 개별 사토시가 비트코인의 핵심 규칙을 변경하지 않고 영구적인 온체인 데이터와 연결될 수 있게 만듦.
데이터는 영구적임: 데이터가 블록체인에 기록되면 비트코인의 불변적인 역사로 남게 되고, 장기 저장 비용을 노드 운영자가 부담하게 됨.
결과는 예측 가능함: 비트코인의 사용은 필요한 수수료를 지불하고자 하는 사용자가 있을 때만 지속됨.
결론
비트코인의 블록체인은 이제 1억 개 이상의 각인을 포함하고 있습니다. 이해 관계자가 각인을 디지털 아티팩트로 보든 스팸으로 보든, 또는 그 사이의 무언가로 보든, 각인은 비트코인의 영구적인 역사의 일부가 되었습니다.
노드 운영자에게 이 역사는 노드를 운영하는 비용을 수반합니다. 2023-2024년에 일어난 일과 계속해서 변화한 것에 대한 이해는 오늘날 노드를 운영하는 데 있어 정보에 입각한 결정을 내리는 데 유용합니다.
차트는 새로움에 의해 불타오른 관심의 이야기를 들려줌 동시에 비트코인의 기본적인 속성을 드러냅니다: 데이터가 블록체인에 들어가면, 그것은 영구적으로 남아 연감과 질감을 가지며 가치를 가진 정보와 역사와 결합됩니다.
이 의미에서 각인은 개별 기록이나 거래가 지속적인 품질과 감정을 지니고 있어 정보와 역사를 가치와 함께 전달한다는 것을 의미합니다.
자주 묻는 질문
비트코인 인스크립션이란 무엇이며 2023년부터 2026년 초까지 얼마나 많은 활동이 있었나요?
비트코인 인스크립션은 2023년 초에 개별 사토시에 데이터를 연결하는 방법을 통해 가능하게 된 비트코인 블록에 직접 기록된 임의의 데이터입니다. 활동은 2023년 1분기 663,000개의 인스크립션으로 시작되어, 2023년 5월에는 880만 개에 도달했으며, 2023년 말에는 하루 40만 개가 넘는 인스크립션으로 최고치를 기록했고, 2026년 1월에는 블록체인에 104,892,336개의 인스크립션이 기록되었으며, 7,092 BTC의 수수료가 지불되었습니다.
어떻게 명각이 비트코인 거래 수수료와 블록 공간 경쟁을 변화시켰습니까?
각인은 일반 결제보다 훨씬 많은 공간을 차지합니다. 간단한 텍스트의 경우 약 1,000~5,000바이트, 큰 이미지의 경우 400,000바이트 이상이며, 일반적인 거래는 약 250바이트입니다. 각인 양이 증가하면서 대용량 파일을 포함하는 사용자가 높은 수수료를 입찰했고, 이는 2023년부터 2024년 초까지 가상 바이트당 수수료율을 자주 50 사토시 이상, 때때로 400 사토시 이상으로 밀어올렸습니다. 이로 인해 정규 결제가 제한된 블록 공간을 두고 경쟁해야 했으며, 각인 수요가 몰리는 시기에 평소 약 2달러가 드는 거래가 15달러 이상이 필요해지는 수수료 급등이 발생했습니다.
각인(inscriptions)이 광부, 노드 운영자, 노드 수에 어떤 영향을 미쳤나요?
채굴자들은 상당한 추가 수익을 올렸으며, 2023년 말의 블록 공간 경쟁이 절정에 달했을 때 대부분의 수수료로 7,092 BTC를 받았습니다. 노드 운영자들은 약 12개월 동안 약 80~100 GB의 영구 추가 저장소를 처리해야 했습니다. 이러한 추가 비용에도 불구하고, 도달 가능한 비트코인 노드 수는 2023년부터 2026년까지 대체로 안정적으로 유지되었으며, 15,000~24,000 노드 사이에서 변동하며 이전 해와 비교하여 급격한 감소는 보이지 않았습니다.
비트코인 인스크립션과 관련된 주요 장점과 위험은 무엇인가요?
혜택에는 블록 보조금이 감소함에 따라 채굴자의 수입을 다양화하고, 임의의 데이터를 검열 없이 저장하며, 새로운 활동을 유도한 결제 외 사용 사례의 확장, 그리고 수수료가 상승하면서 저가의 인스크립션을 배제하는 시장 주도 규제가 포함됩니다. 위험에는 보상을 받지 못한 채 노드 운영자에게 영구적인 저장 부담, 네트워크 혼잡 및 급증 시 예측할 수 없는 수수료 급등, 하드웨어 및 대역폭 요구가 증가하여 중앙 집중화 압력이 가해질 가능성, 비트코인이 주로 돈으로 사용되어야 하는지 아니면 데이터 저장 계층으로 사용되어야 하는지를 둘러싼 철학적 분열이 포함됩니다.
면책 조항
이 글에 제공된 정보는 정보 제공을 위한 것입니다. 이는 금융 자문으로 간주되어서는 안 되며, 금융 자문을 의미하지 않습니다. 우리는 이 정보의 완전성, 신뢰성, 정확성에 대해 어떠한 보증도 하지 않습니다. 모든 투자는 위험을 수반하며 과거의 실적이 미래의 결과를 보장하지 않습니다. 투자 결정을 내리기 전에 금융 자문가와 상담할 것을 권장합니다.


