


Quick summary
Hi everyone,
I'm testing out a new way to provide some numbers in real-time to help us find coins which could be in more bullish posture versus others. We do this by extracting the RSI from the top 70 coins narrowing down on the 40-50 zone. This zone is normally the calmest before a move in a direction.
I am notciing that the figures are a little off sometimes but overall its finding the coins well and over time we can get more accurate.
good day
43 of 68 scanned tokens exhibit RSI readings in the 40–50 neutral consolidation zone. This represents 63.2% of the market cap elite—up sharply from 36.8% on March 31st, indicating rapid re-entry into consolidation after brief weakness.
Market Snapshot : Distribution by Signal Strength
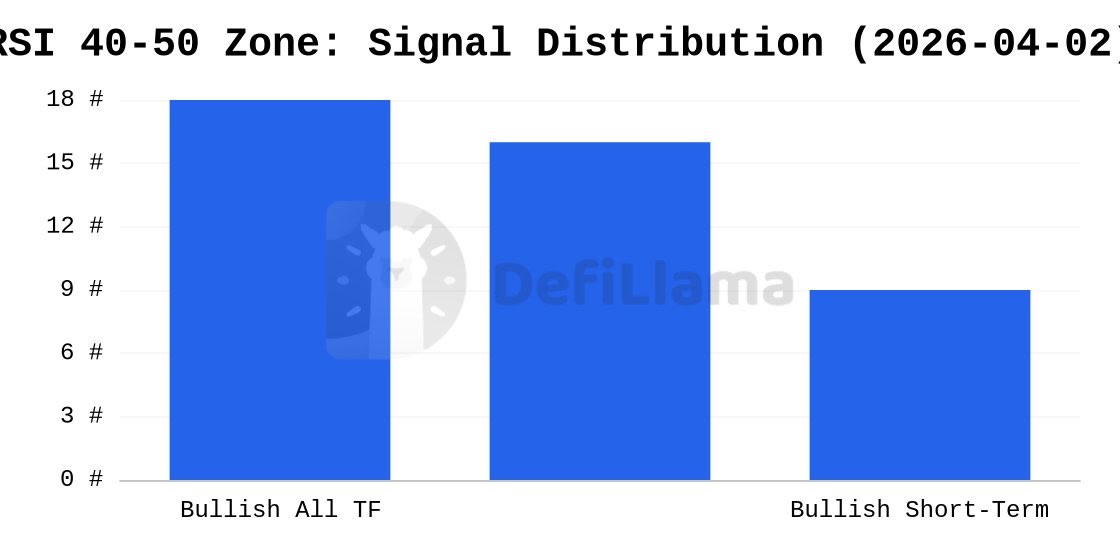
TF — 18 tokens
Highest conviction: both short-term (1D/3D) AND long-term (1W/1M) RSI converge into zone.
All 4 timeframes in zone: ASTER, CC, PAXG, USDC, XAUT
3 timeframes in zone: BFUSD, BGB, DOT, ICP, NEAR, PI, SKY, SUSDS, USDC.E, USDT0, XMR
Short-Term — 9 tokens
1D/3D in zone; longer timeframes remain elevated (>50).
HTX, JTRSY, LEO, M, SOL, SYRUPUSDC, TRX, WTRX, ZEC
Data as of 2026-04-02. RSI calculations use Wilder's smoothing method (14-period). Source: DefiLlama. Figures are approximate and may vary slightly depending on data aggregation and calculation methodology.
Disclaimer
The information provided in this article is for informational purposes only. It is not intended to be, nor should it be construed as, financial advice. We do not make any warranties regarding the completeness, reliability, or accuracy of this information. All investments involve risk, and past performance does not guarantee future results. We recommend consulting a financial advisor before making any investment decisions.
Written by

Andrew Kamsky
Andrew Kamsky is a Bitcoin analyst. He spent a decade in traditional finance across a Big Four firm and a listed fintech bank before going deep on Bitcoin full-time.


