


Quick summary
Bitcoin pulled back toward $69,500, with weekly RSI near 25 highlighting increasing technical fragility
A prolonged 2021-2026 ascending wedge structure points to potential downside risk toward the low $32,000 region
If $69,000 is cracked then $56,000 level remains critical support; a breakdown from there could accelerate losses toward the $50,000–$32,000 range
Broader altcoins markets also show weakening momentum, extreme fear sentiment, and elevated downside volatility risk
Bitcoin experienced a sharp sell-off on February 5, 2026, pushing price toward the $69,500 level and raising fresh concerns about downside risk. Current price action suggests the market is entering a technically fragile phase, with weekly RSI near 25 highlighting weakening momentum and expanding volatility.
This article outlines how the Bitcoin chart is developing, the structural risks forming beneath price, and the key levels that may define the next phase of the market.
Ascending Wedge Pattern Signals Downside Risk
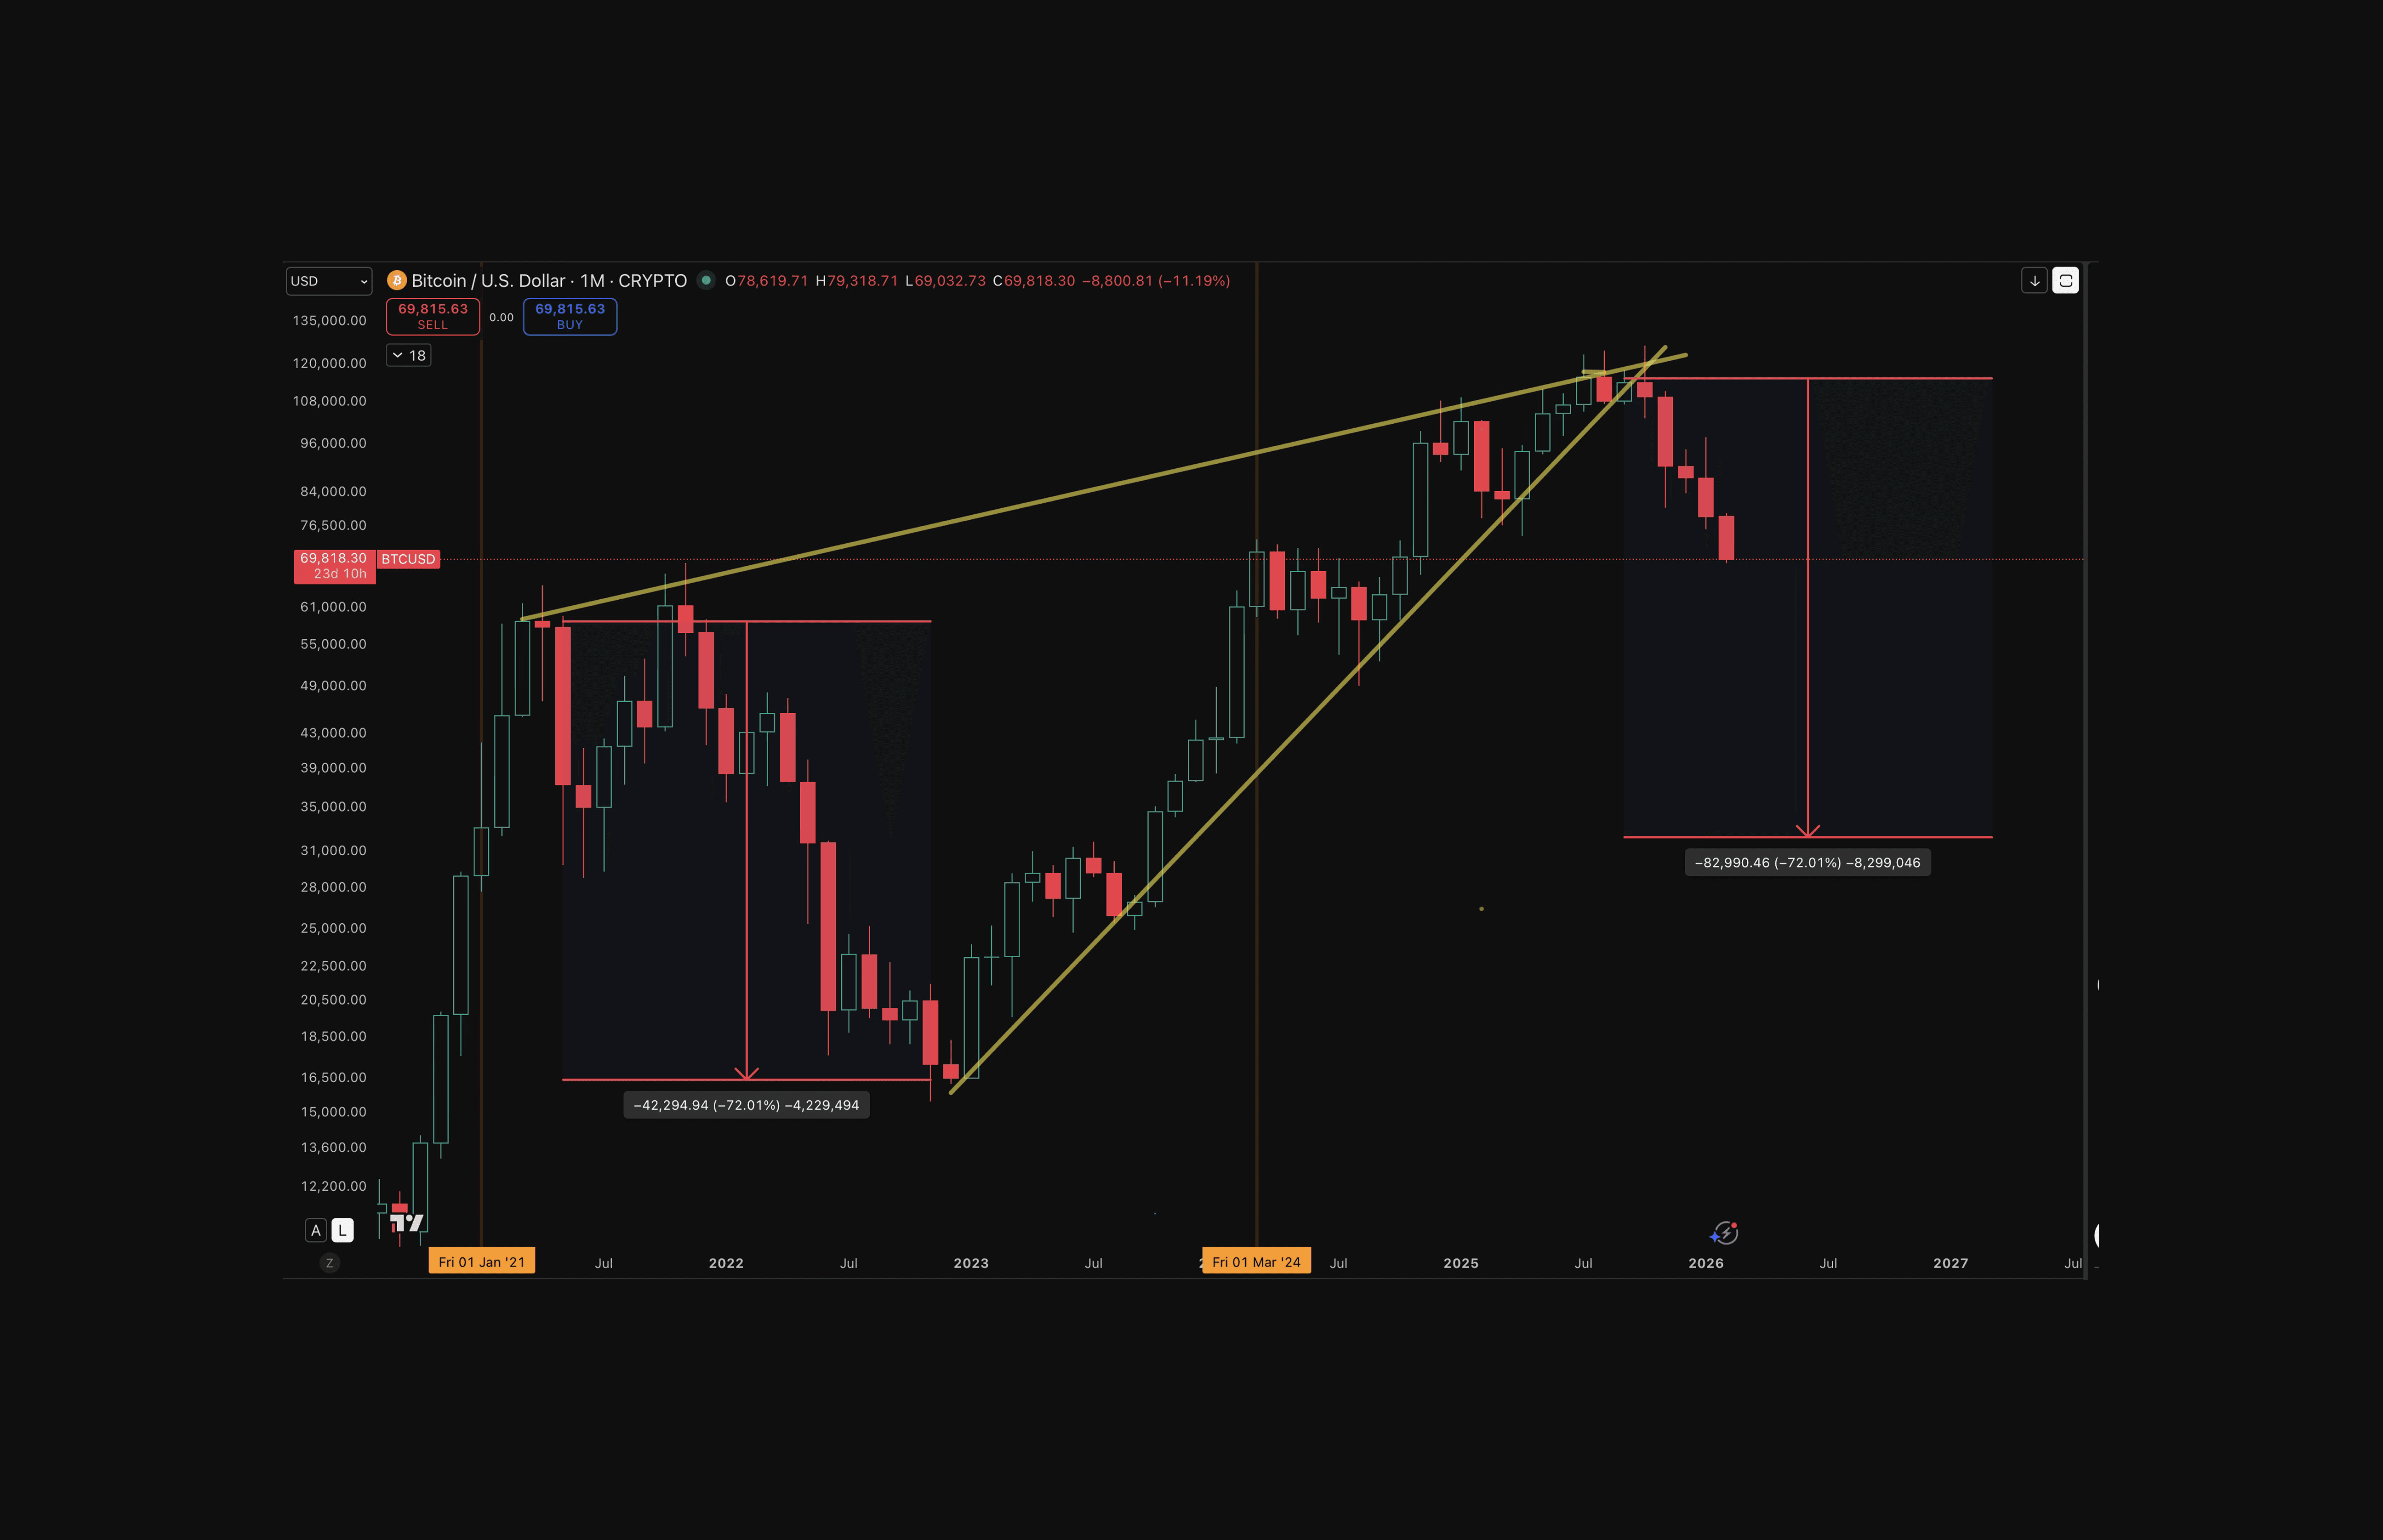
From a structural perspective, Bitcoin was trading within an ascending wedge up until October 2025, a pattern that historically resolves to the downside.
Pattern structure: Rising price with weakening momentum, often preceding sharp corrections.
Measured move: Full wedge projection suggests downside risk toward the low $32,000 range if the pattern fully plays out.
Historical alignment: This target closely matches the 2021–2022 market fractal and previous RSI-based bear market confirmations.
While the chart below, illustrating the ascending wedge with target, remains a worst-case scenario, the confluence of structure and momentum increases the probability of continued downside pressure.
Key Bitcoin Support Levels and Bear Market Scenarios
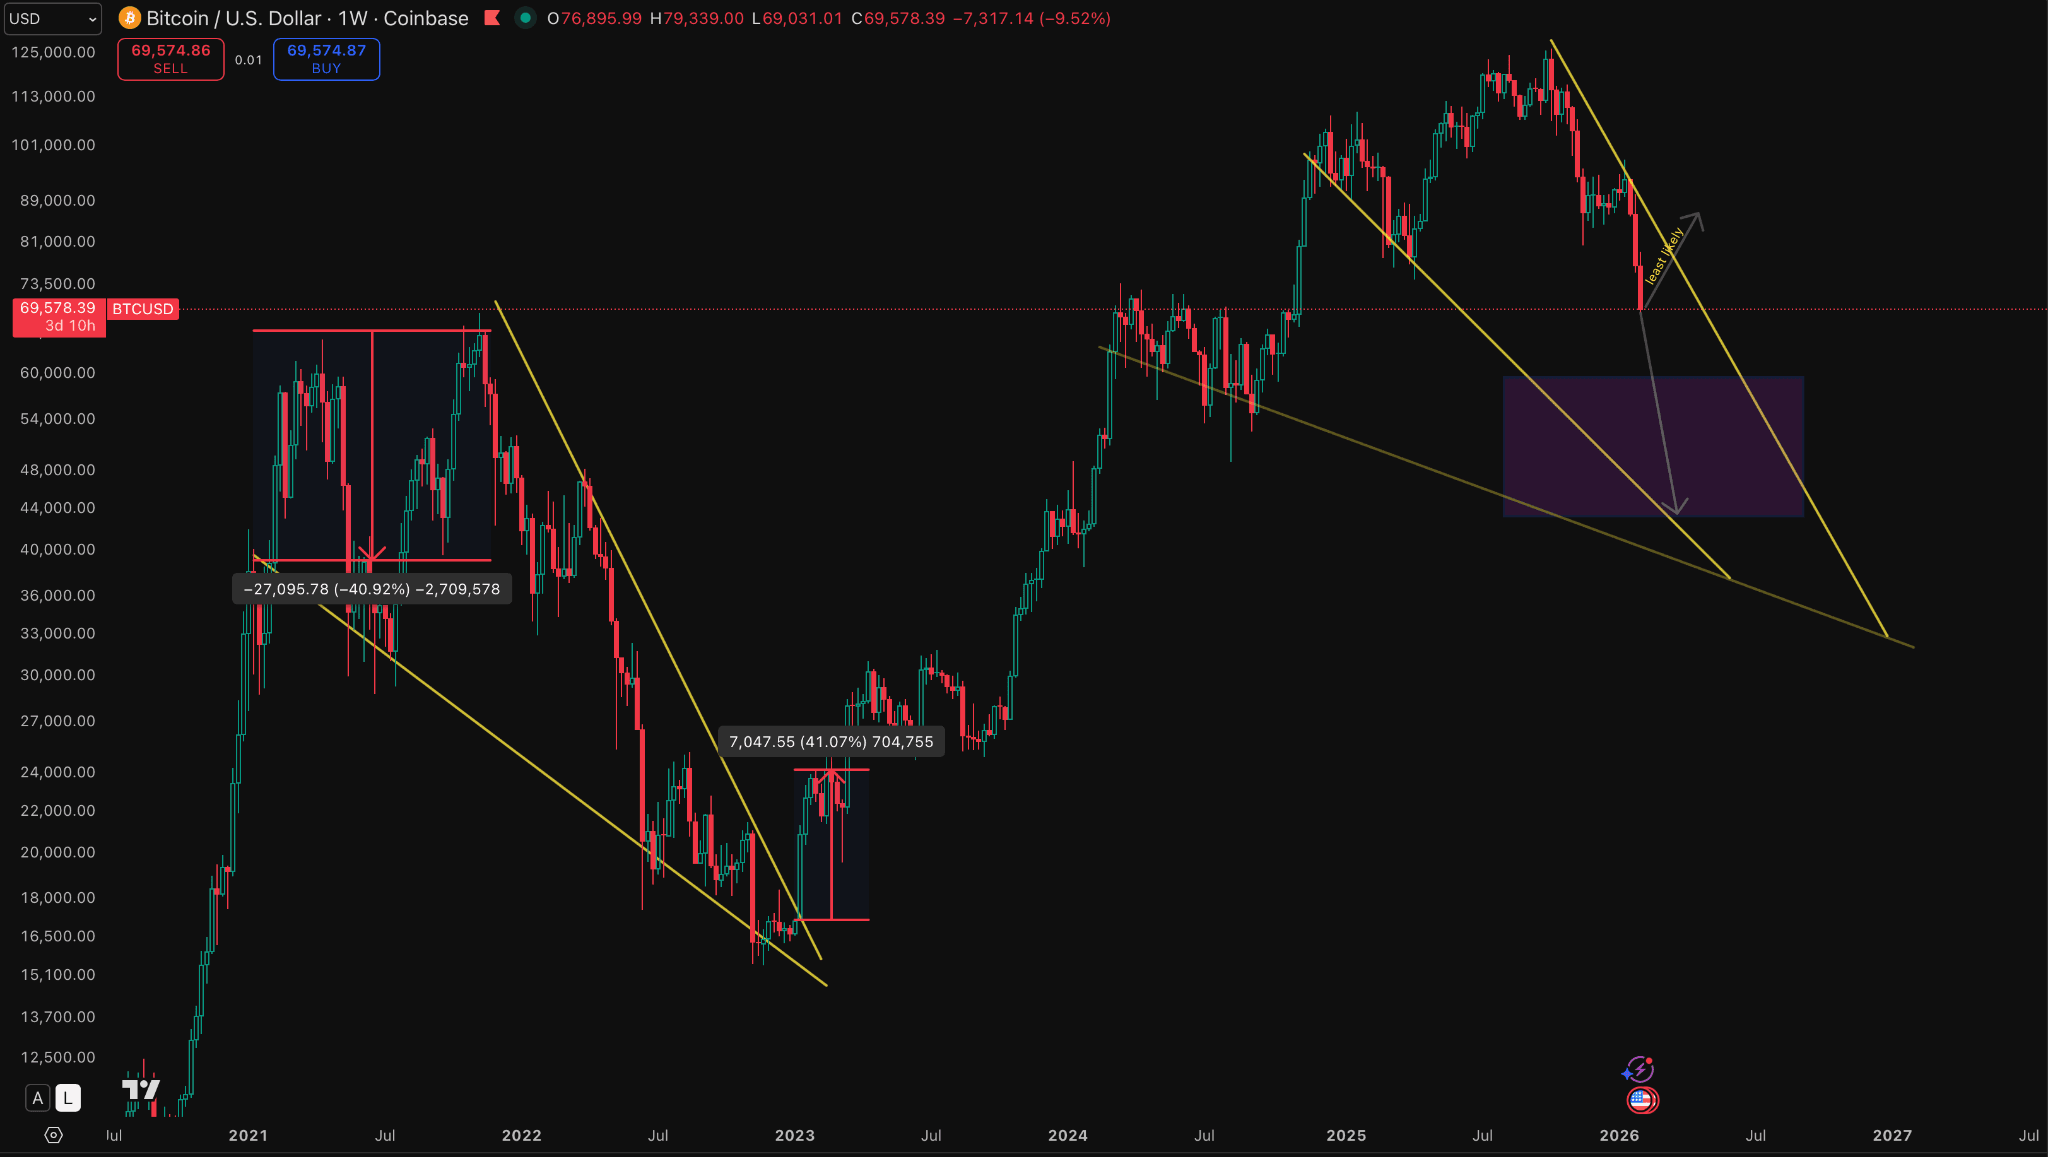
If Bitcoin begins to roll over and form a descending wedge similar to the 2021–2022 structure, the $56,000 level projects itself as a key near-term support zone.
Support hold: A successful defense of $56,000 could trigger a short-term bounce toward resistance.
Support failure: A clean crack below the support level in the chart below, raises the likelihood of a move toward the $50,000-$32,000 range, where broader panic may emerge.
Market context: Bitcoin is now down over 40% from its all-time high, reinforcing a cautious, risk-managed approach.
Broader Market and Sentiment Context
Ethereum and select altcoins are also showing signs of strain, with several assets trading near key decision levels that could either hold or give way as broader market pressure persists. Weakening momentum across majors suggests risk remains skewed to the downside in the short term.
From a sentiment perspective, conditions are now firmly in extreme fear. The Crypto Fear & Greed Index has fallen to 12, reflecting elevated anxiety and defensive positioning across the market. While extreme fear can sometimes precede relief rallies, it has historically also accompanied periods of continued volatility and trend development rather than immediate reversals.
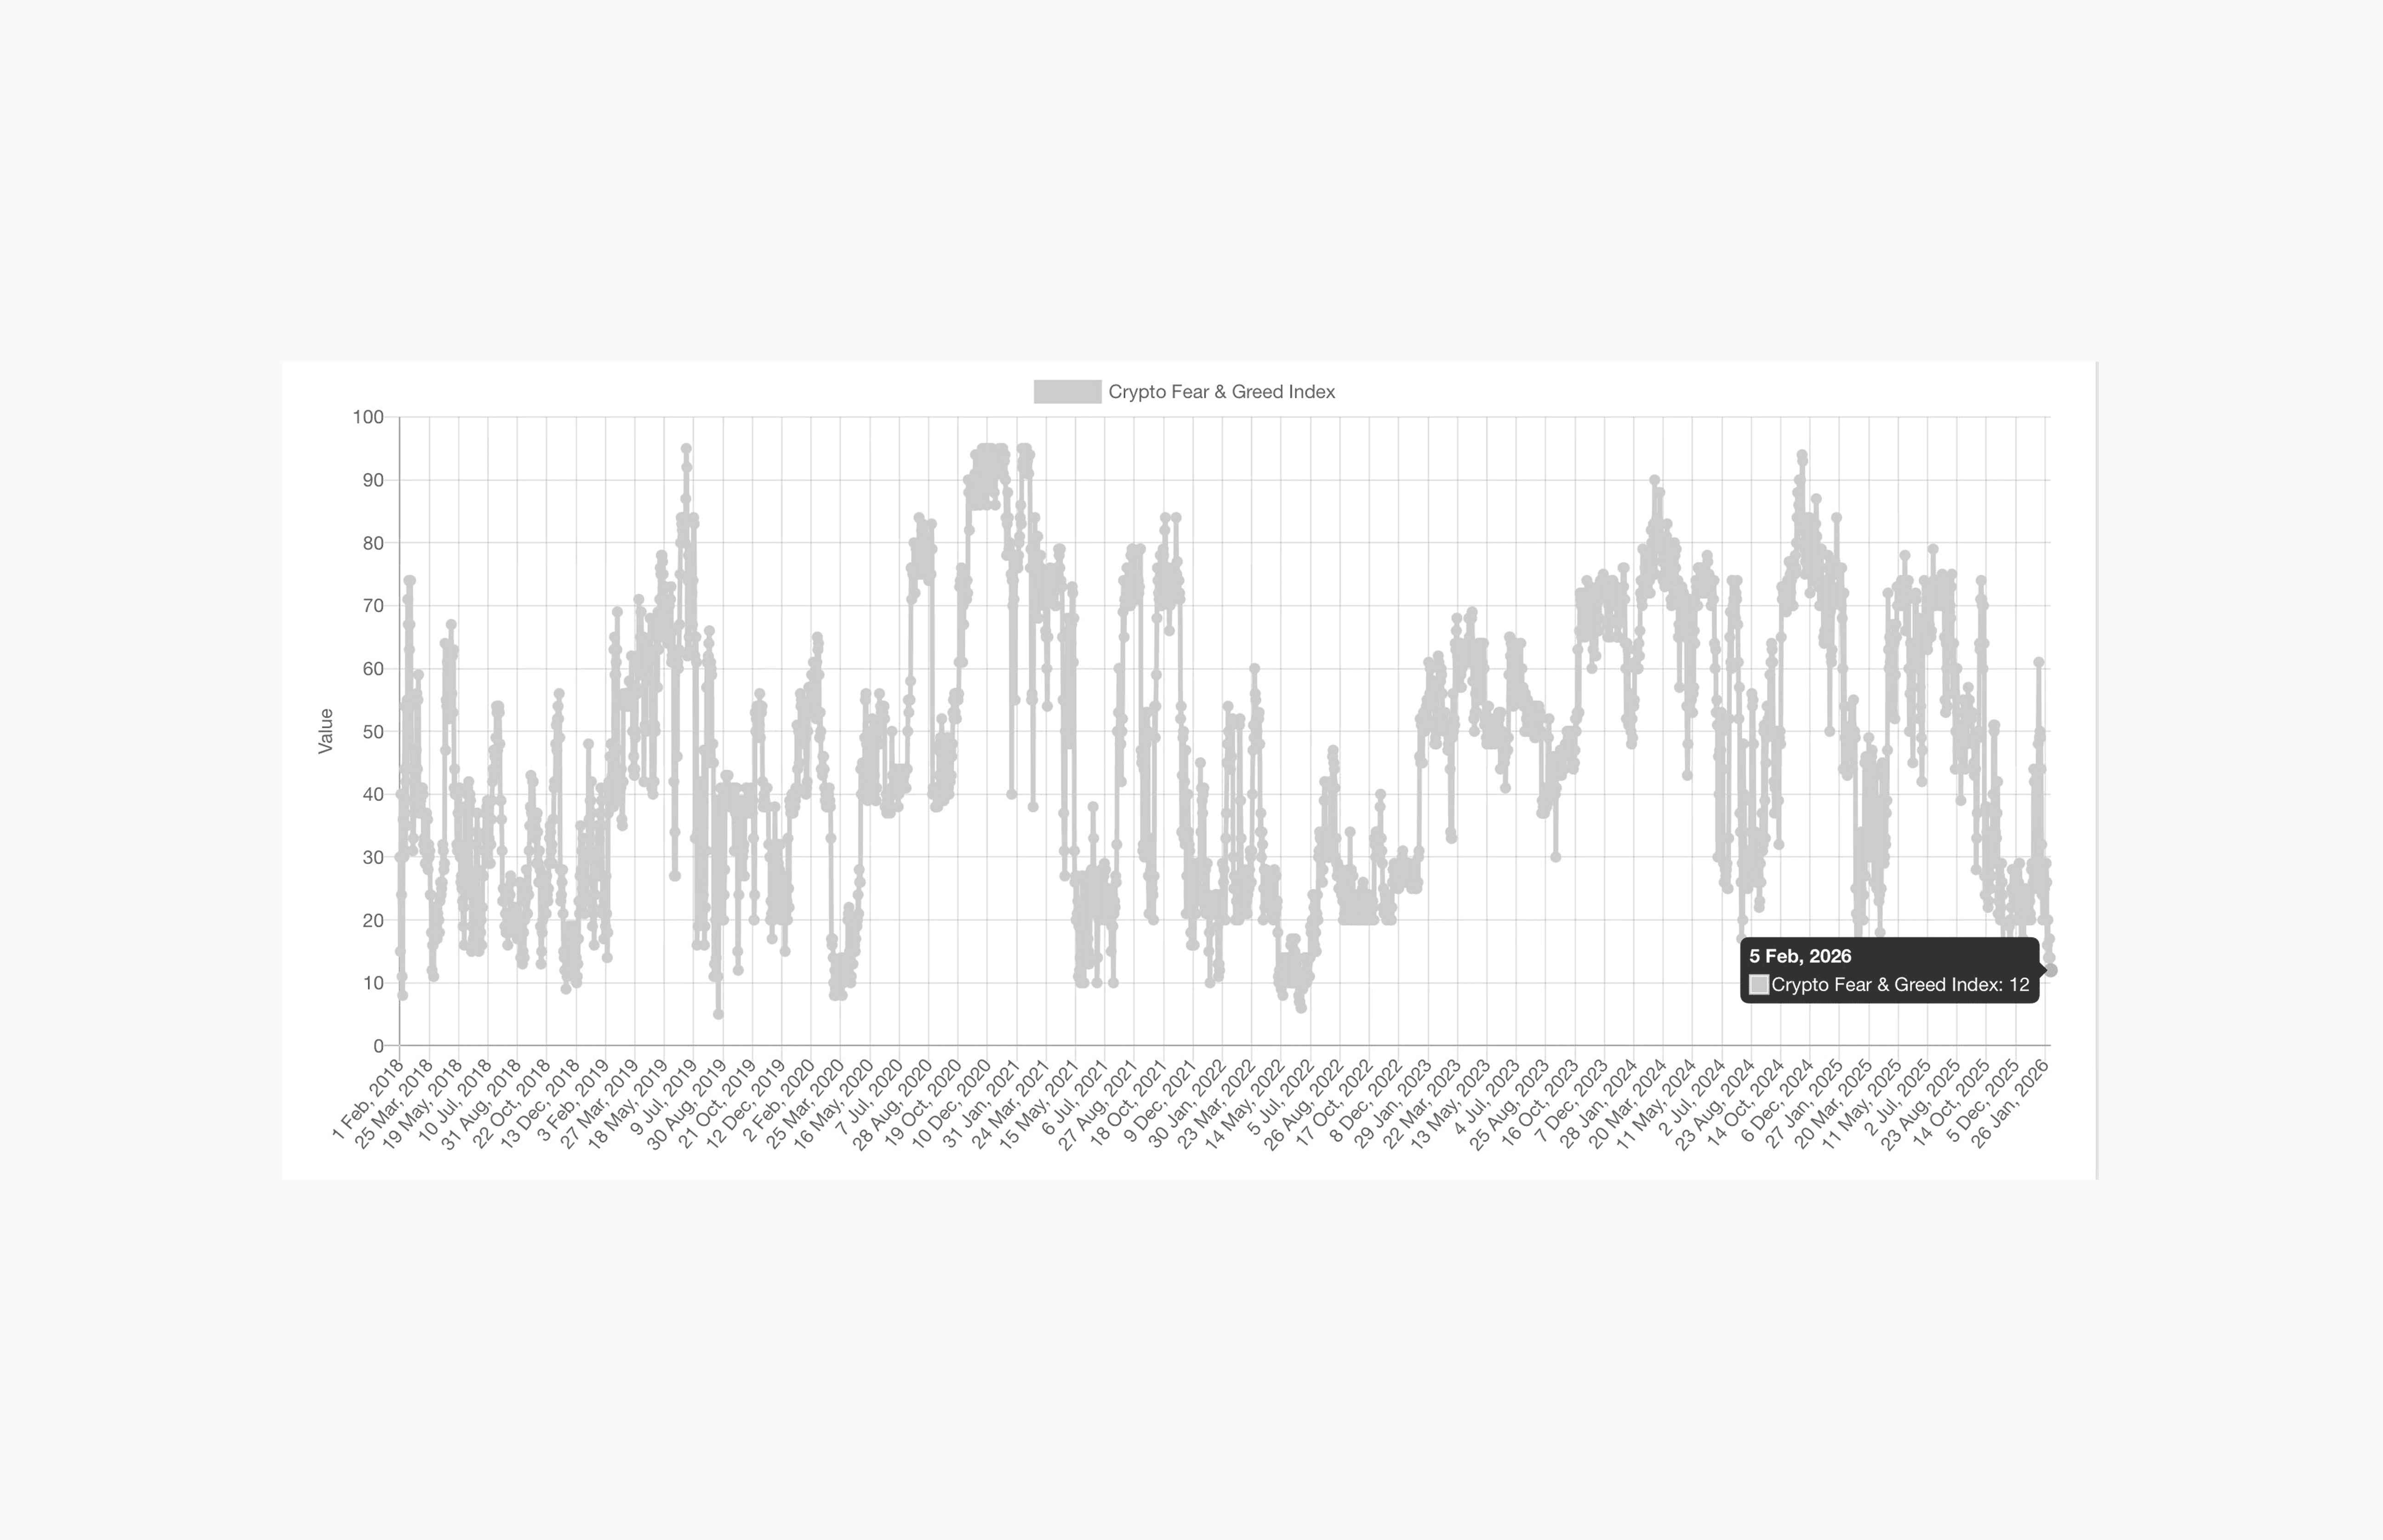
For context, during the June 2022 capitulation phase, the index briefly dropped as low as 5, highlighting how sentiment can remain depressed for extended periods once a broader bearish structure is in place.
As such, sentiment alone is not a timing tool, but it does reinforce the need for caution. In environments like this, patience, clarity, and disciplined risk management matter more than ever.
Conclusion
Bitcoin remains at a critical inflection point. While downside risk continues to dominate from a structural and momentum perspective, the $69,000 level now represents a critical and highly important pivot for near-term price action.
Former all-time high ($69,000): A sustained hold above this level could stabilize price and open the door for a broader recovery. Failure to maintain $69,000 as support would likely accelerate downside moves, given limited nearby structural support and prevailing sentiment.
Bullish invalidation level ($84,000): For any meaningful bullish continuation to develop, Bitcoin would need to reclaim and hold above $84,000, restoring higher highs and invalidating the current bearish structure. Until then, rallies should be treated cautiously within a fragile market environment.
In the current conditions, patience and disciplined risk management remain essential as the market resolves its next major move.
FAQ
What recent price action has raised concerns about Bitcoin’s market structure?
Bitcoin experienced a sharp sell-off on February 5, 2026, pushing price toward the $69,500 level and signaling a technically fragile phase with weakening momentum and expanding volatility.
Why does the previous ascending wedge pattern imply downside risk for Bitcoin?
Bitcoin traded within an ascending wedge until October 2025, a pattern characterized by rising price with weakening momentum that historically resolves to the downside, with a measured move suggesting potential risk toward the low $32,000 range.
What are the key support levels and downside scenarios discussed for Bitcoin?
The $56,000 level is highlighted as key near-term support; if it holds, a short-term bounce toward resistance is possible, but a clean break below it raises the likelihood of a move toward the $50,000–$32,000 range where broader panic may emerge.
How are broader crypto market conditions and sentiment currently described?
Ethereum and select altcoins are showing strain near key decision levels, momentum across majors is weakening with risk skewed to the downside, and sentiment is in extreme fear with the Crypto Fear & Greed Index at 12, reinforcing the need for caution and disciplined risk management.
Disclaimer
The information provided in this article is for informational purposes only. It is not intended to be, nor should it be construed as, financial advice. We do not make any warranties regarding the completeness, reliability, or accuracy of this information. All investments involve risk, and past performance does not guarantee future results. We recommend consulting a financial advisor before making any investment decisions.
Written by

Andrew Kamsky
Andrew Kamsky is a Bitcoin analyst. He spent a decade in traditional finance across a Big Four firm and a listed fintech bank before going deep on Bitcoin full-time.


