Bitcoin RSI Market Transition
  • $

    Loading

    미국 달러

  • $

    Loading

    미국 달러

  • $

    Loading

    미국 달러

  • $

    Loading

    미국 달러

  • $

    Loading

    미국 달러

  • $

    Loading

    미국 달러

  • $

    Loading

    미국 달러

  • $

    Loading

    미국 달러

  • $

    Loading

    미국 달러

  • $

    Loading

    미국 달러

  • $

    Loading

    미국 달러

  • $

    Loading

    미국 달러

  • $

    Loading

    미국 달러

  • $

    Loading

    미국 달러

  • $

    Loading

    미국 달러

  • $

    Loading

    미국 달러

  • $

    Loading

    미국 달러

  • $

    Loading

    미국 달러

  • $

    Loading

    미국 달러

  • $

    Loading

    미국 달러

Bitcoin RSI Update: Higher Timeframes Signal a Market in Transition

앤드류 캄스키

2026. 2. 4.

읽기 시간

2 mins

공유하기

오디오로 듣기

0:00/1:34

빠른 요약

  • Bitcoin is showing conditions consistent with a developing bear market based on monthly timeframe RSI

  • Monthly RSI near 46, below 50, suggests consolidation, elevated volatility, and delayed structural recoveries

  • Weekly RSI around 27 aligns with late-stage corrections and prolonged basing before trends resume

  • The approach emphasizes avoiding leverage, staggered limit orders toward ~$44,000, cautious treatment of relief rallies, and patience

Bitcoin’s RSI across higher timeframes is beginning to reflect that Bitcoin is around four months into a bear market. This is most visible when looking at the weekly and monthly RSI charts, where momentum often provides early context for how markets digest uncertainty.

Monthly RSI: Volatility and Consolidation Risk

On the monthly chart, RSI is below 50 at approximately 46 on February 4, 2026. Historically, this has been associated with:

  • Extended consolidation: price spending time ranging rather than trending

  • Elevated volatility: sharper moves in both directions without sustained follow-through

  • Delayed recoveries: rebounds that struggle to repair broader structure

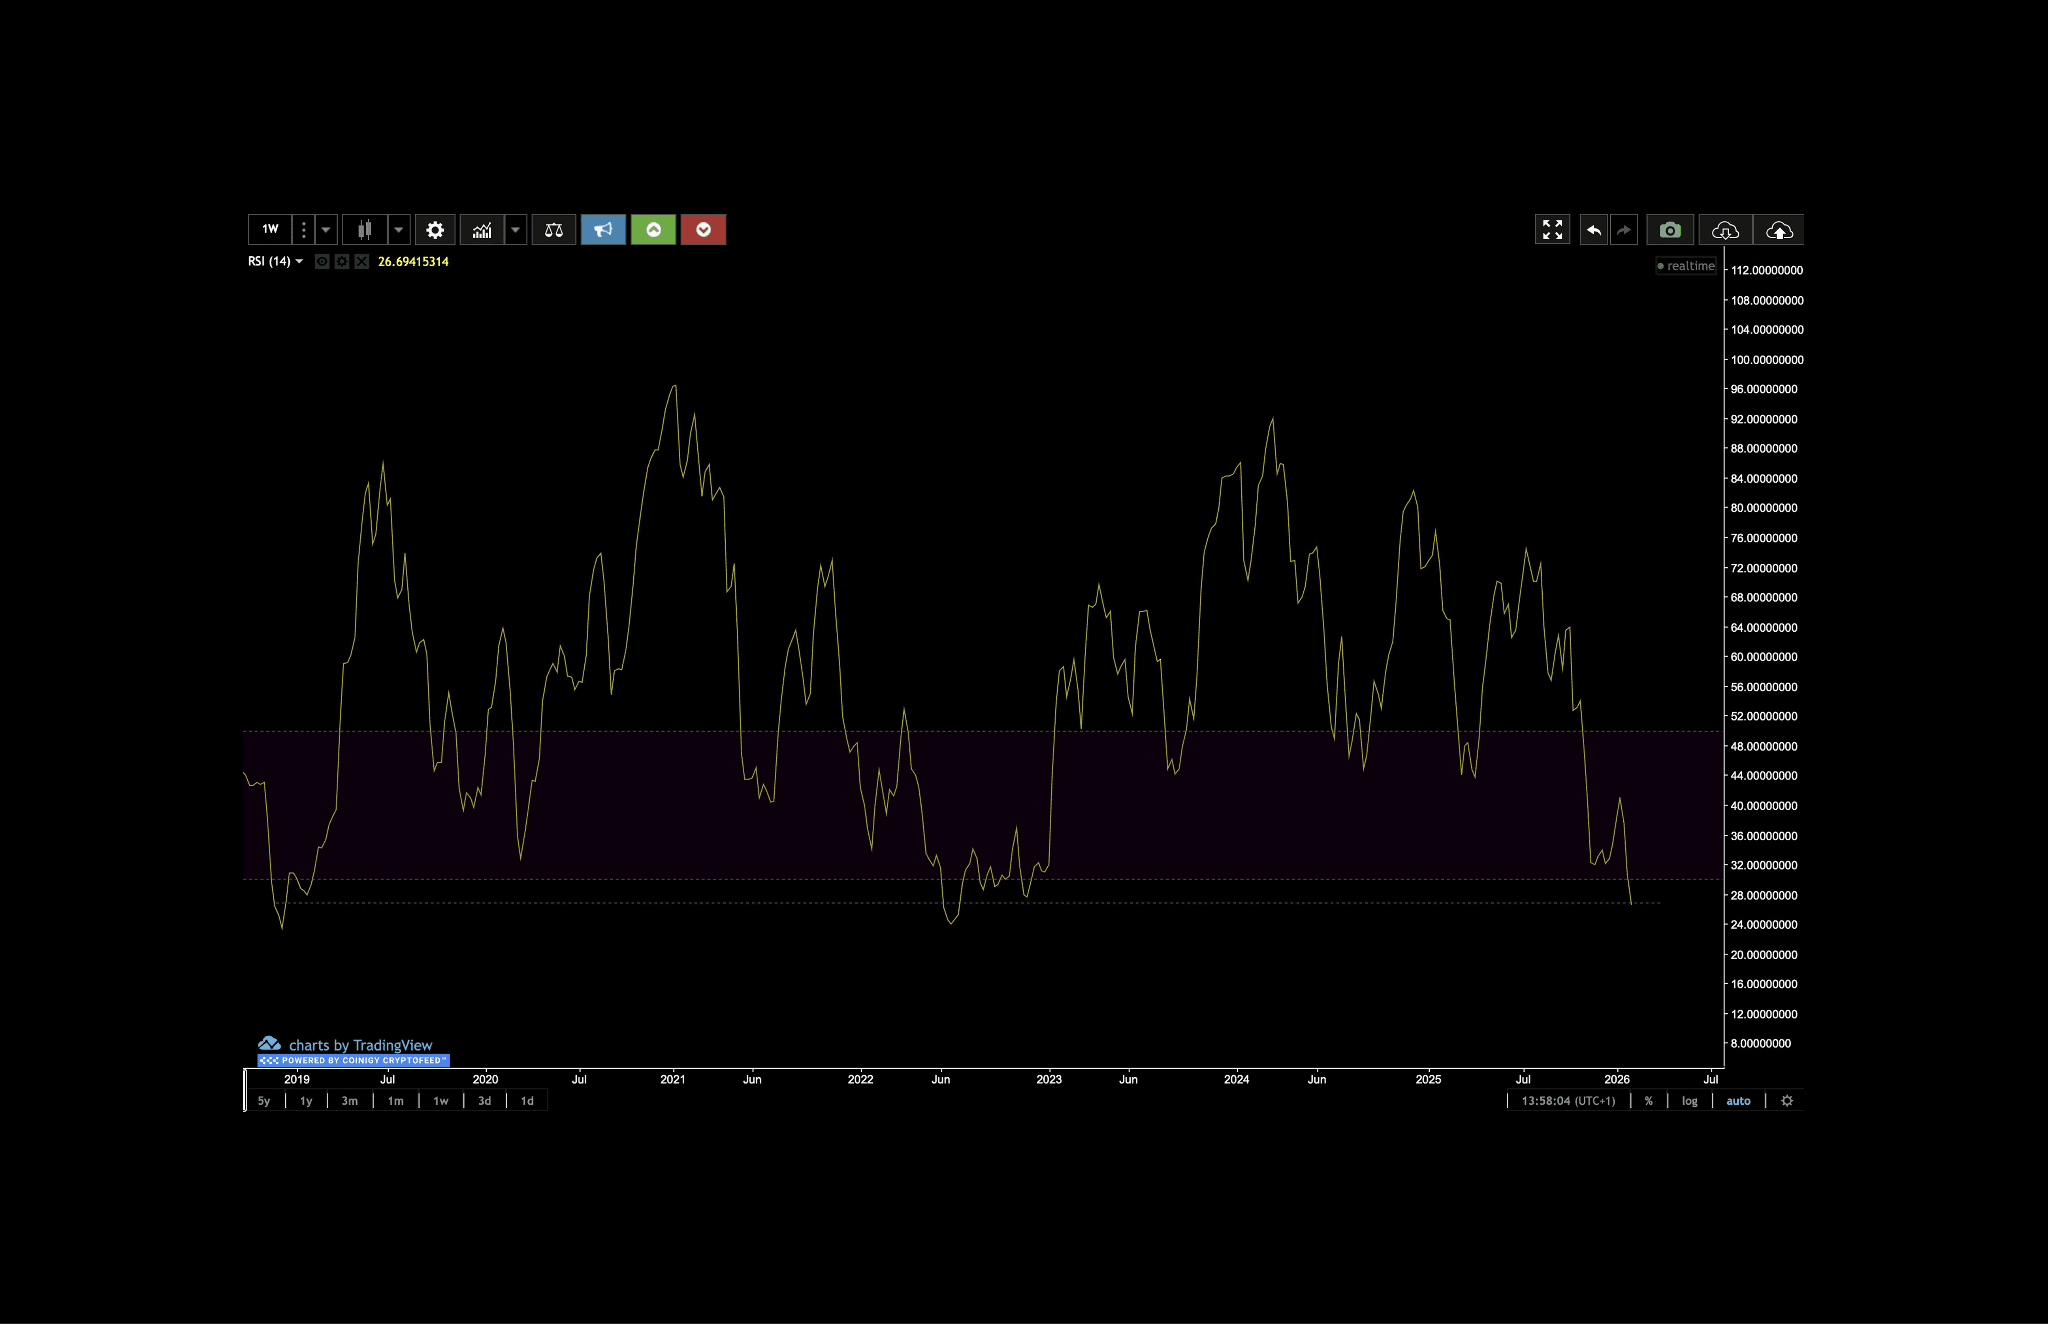
RSI Weekly at around 27

Weekly RSI: Late-Stage Correction Signals

The weekly RSI at around 27,  is already sitting near levels that, in past cycles, have coincided with:

  • Late-stage corrections: periods where downside pressure slows but doesn’t immediately reverse

  • Prolonged basing phases: markets testing patience before a clearer trend emerges

How to Approach This Environment

Based on the current RSI structure, without trying to predict exact outcomes or call a bottom. The focus is on how RSI has behaved in previous cycles and what that tends to imply for timing and patience.

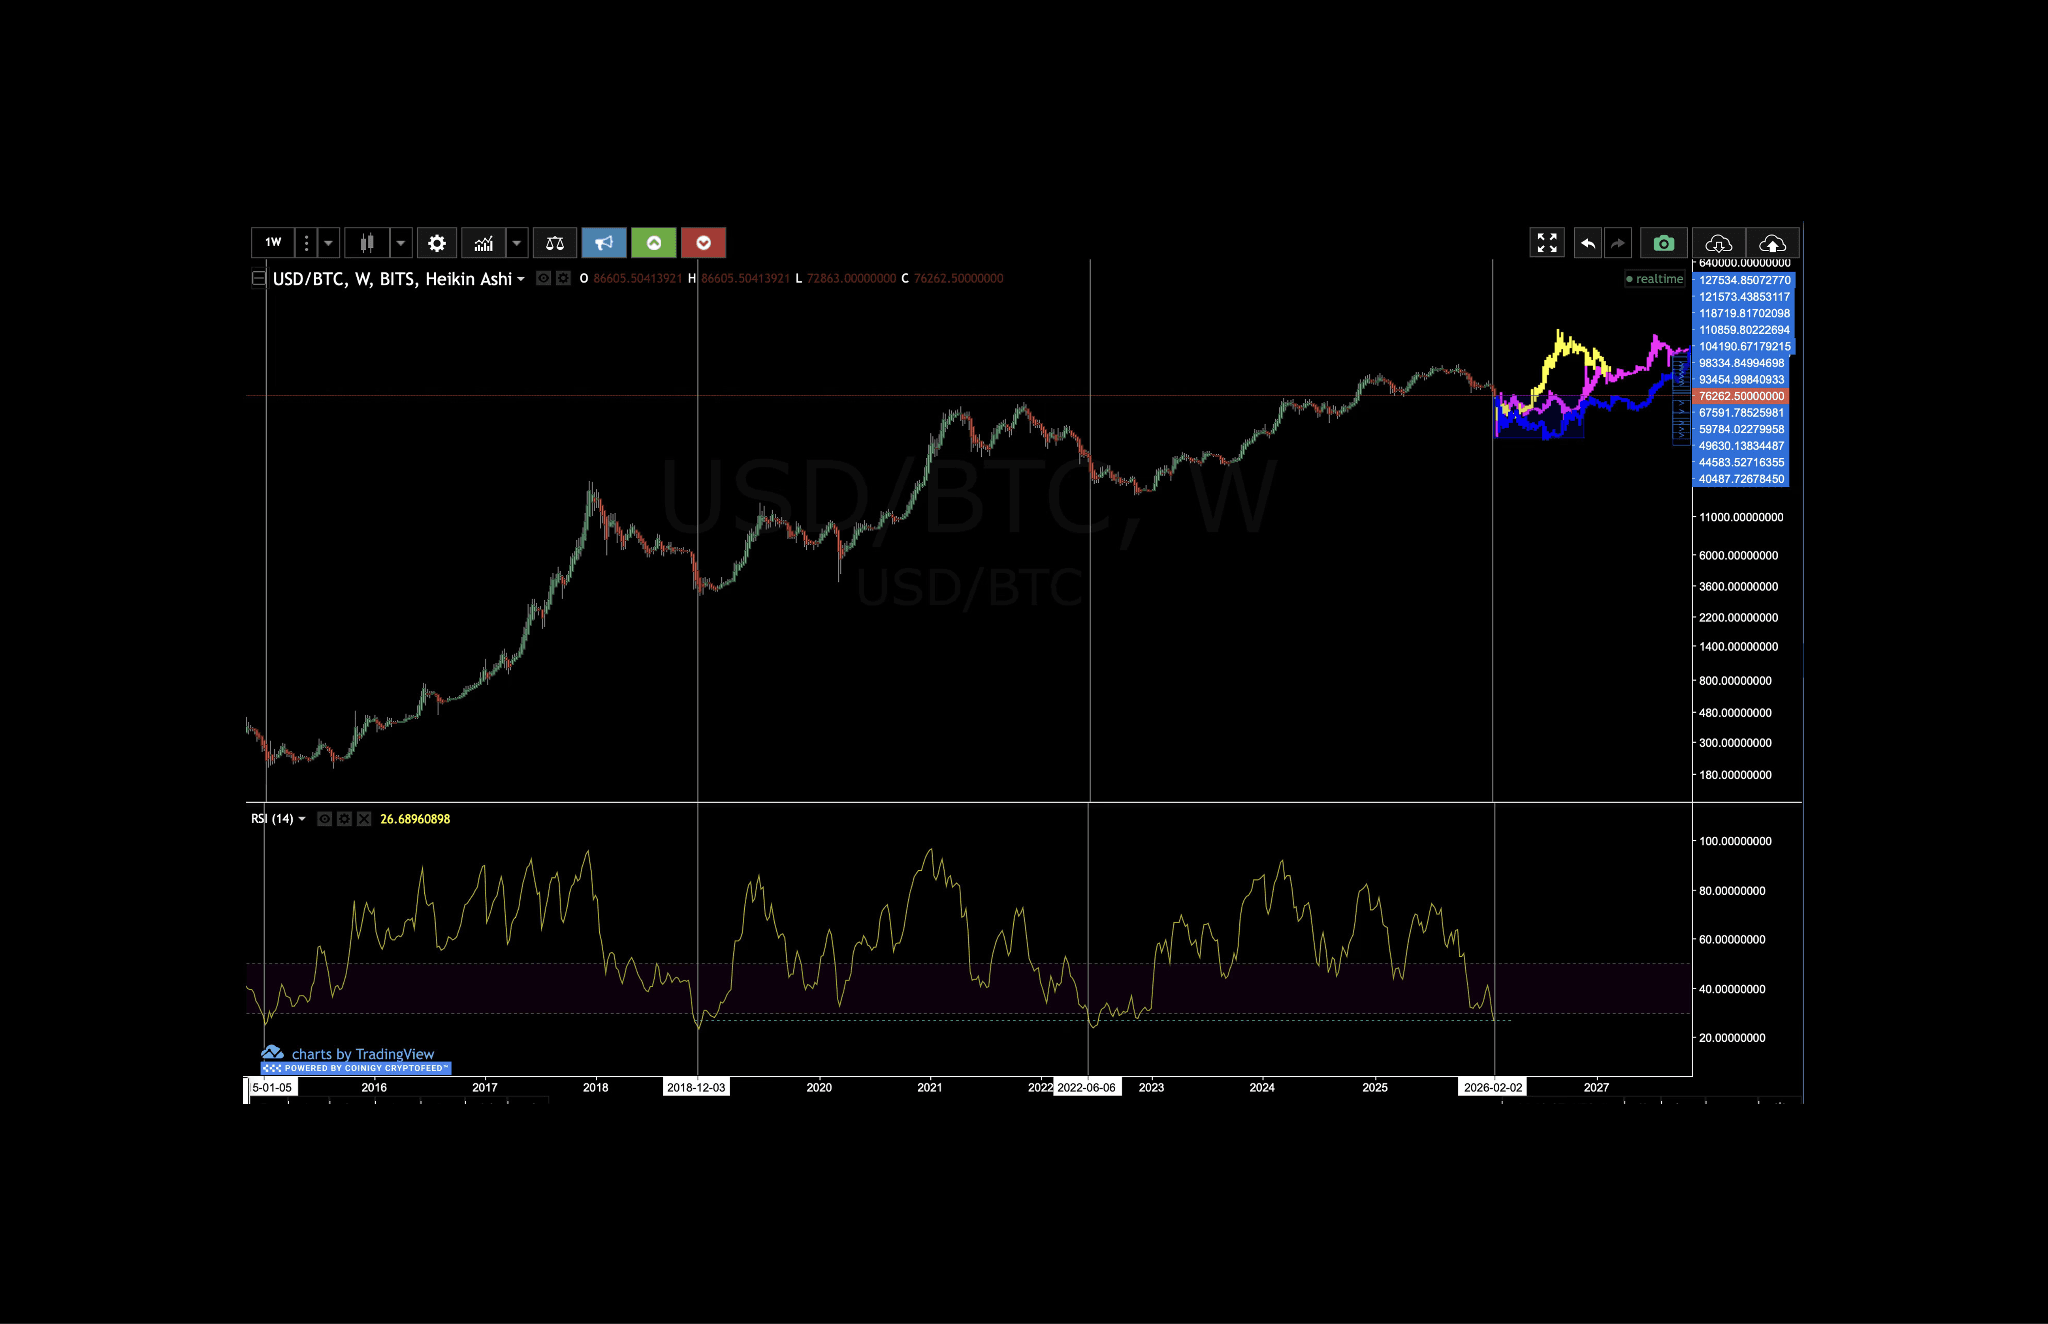
RSI Weekly Fractals from 2015 | 2018 and 2022

When RSI reaches these low levels on the weekly and monthly charts, history shows that price often spends time chopping, with volatility increasing and leverage getting flushed out before any sustained move resumes. 

That process can take longer than expected and doesn’t resolve in a straight line.

Because of this, my approach is straightforward and scenario-based:

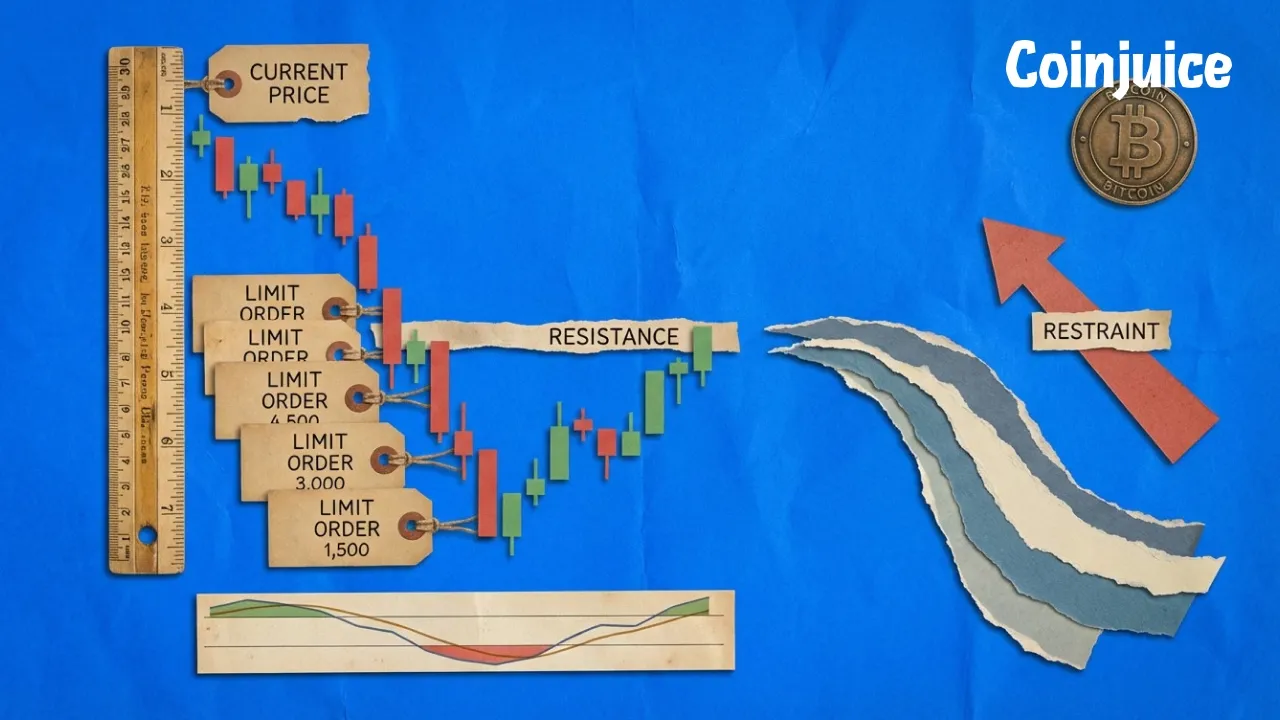
  • If price cracks lower: I’m avoiding leverage and placing layered limit orders across a defined range, extending as low as the ~$48,000 area in case we see a fast panic or forced selling. Some of these orders may take weeks or months to fill, and that’s intentional.

  • If price resolves higher: I’m open to relief rallies, but I’m treating them cautiously. A bounce on its own doesn’t mean the broader structure has been repaired or that a new trend is in place.

  • At all times: The focus is on patience and risk management rather than directional certainty.

If you’re looking for a clearer way to read charts, plan entries and exits like was spoken about , and reduce emotional decision-making, How to Trade Without Leverage may be useful.

자주 묻는 질문

What does Bitcoin’s current monthly RSI level around 46 typically indicate?

A monthly RSI below 50 around 46 has historically been associated with extended consolidation, elevated volatility, and delayed recoveries where rebounds struggle to repair broader structure.

What does a weekly RSI around 27 suggest based on past cycles?

A weekly RSI near 27 has coincided with late-stage corrections, where downside pressure slows but doesn’t immediately reverse, and prolonged basing phases before a clearer trend emerges.

How does Bitcoin’s price often behave when both weekly and monthly RSI reach low levels?

Price often spends time chopping, with increasing volatility and leverage getting flushed out before any sustained move resumes, and this process can take longer than expected and not resolve in a straight line.

What is the outlined trading approach for potential moves lower or higher in this environment?

If price cracks lower, the approach is to avoid leverage and place layered limit orders across a defined range down to about $44,000, accepting that some may take weeks or months to fill. If price resolves higher, relief rallies are treated cautiously, since a bounce alone doesn’t mean the broader structure is repaired or a new trend is in place, with the focus always on patience and risk management rather than directional certainty.

면책 조항

이 글에 제공된 정보는 정보 제공을 위한 것입니다. 이는 금융 자문으로 간주되어서는 안 되며, 금융 자문을 의미하지 않습니다. 우리는 이 정보의 완전성, 신뢰성, 정확성에 대해 어떠한 보증도 하지 않습니다. 모든 투자는 위험을 수반하며 과거의 실적이 미래의 결과를 보장하지 않습니다. 투자 결정을 내리기 전에 금융 자문가와 상담할 것을 권장합니다.

공유하기

작성자

앤드류 캄스키

2026. 2. 4.

공유하기

작성자

앤드류 캄스키

2026. 2. 4.

비트코인과 알트코인을 청산, 지표 또는 추측 없이 거래하세요

두려움 속에서 구매하고 회복 중에 판매하는 간단한 반복 가능한 프레임워크입니다. 청산 위험이나 하루 종일 차트를 보는 위험 없이 가능합니다.

신호, 전문가, 또는 운에 의존하지 마십시오. 일단 보면 잊을 수 없는 너무나도 간단한 시스템을 배우세요. 완전히 소유하고 영원히 사용하세요.

비트코인과 알트코인을 청산, 지표 또는 추측 없이 거래하세요

두려움 속에서 구매하고 회복 중에 판매하는 간단한 반복 가능한 프레임워크입니다. 청산 위험이나 하루 종일 차트를 보는 위험 없이 가능합니다.

신호, 전문가, 또는 운에 의존하지 마십시오. 일단 보면 잊을 수 없는 너무나도 간단한 시스템을 배우세요. 완전히 소유하고 영원히 사용하세요.

비트코인과 알트코인을 청산, 지표 또는 추측 없이 거래하세요

두려움 속에서 구매하고 회복 중에 판매하는 간단한 반복 가능한 프레임워크입니다. 청산 위험이나 하루 종일 차트를 보는 위험 없이 가능합니다.

신호, 전문가, 또는 운에 의존하지 마십시오. 일단 보면 잊을 수 없는 너무나도 간단한 시스템을 배우세요. 완전히 소유하고 영원히 사용하세요.

비트코인과 알트코인을 청산, 지표 또는 추측 없이 거래하세요

두려움 속에서 구매하고 회복 중에 판매하는 간단한 반복 가능한 프레임워크입니다. 청산 위험이나 하루 종일 차트를 보는 위험 없이 가능합니다.

신호, 전문가, 또는 운에 의존하지 마십시오. 일단 보면 잊을 수 없는 너무나도 간단한 시스템을 배우세요. 완전히 소유하고 영원히 사용하세요.